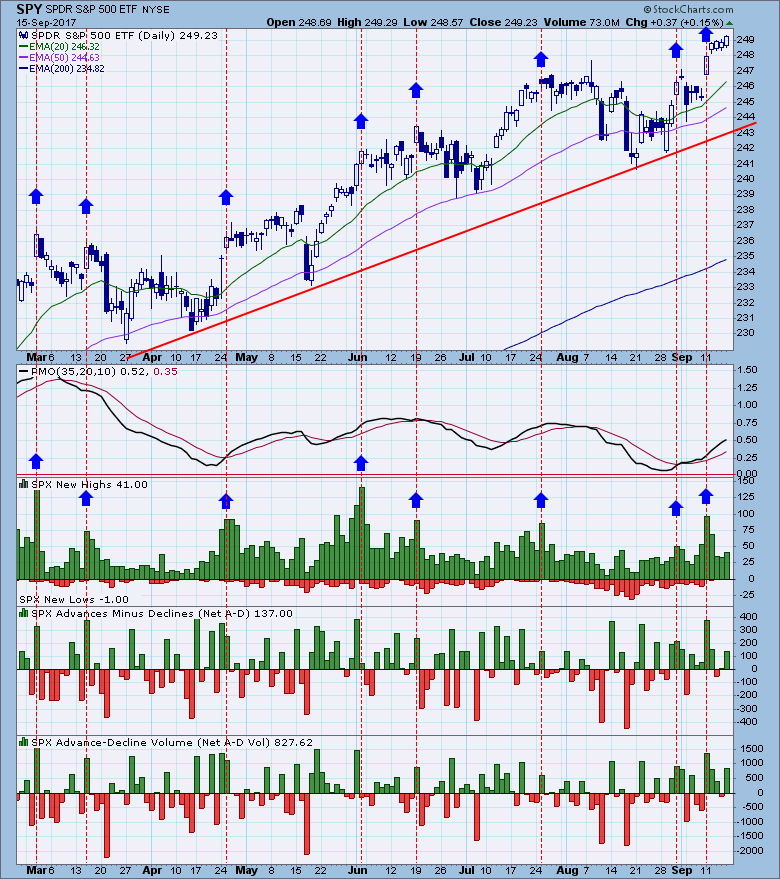
For a few weeks I have been expecting an upside breakout, and on Monday the breakout finally happened. The internal action on that day indicated that a buying climax had taken place, an event that very often leads to some post-climax churning or pullback. Also, this was an options expiration week, a process that tends to keep prices fairly quiet.
Regarding climaxes, the chart above illustrates the phenomenon. To identify upside climaxes I use new highs, as well as net breadth and volume. There are no specific levels that these indicators need to reach, rather we look for a spike that stands out from the bars that surround it. The spike is normally the highest in the group, so it cannot be positively identified until we see that the next day's reading is lower. Nevertheless, a lack of follow through early in the next day will increase our confidence that the climax has been identified. I recommend that you study the chart for a few minutes. I have identified the upside climaxes with up-pointing blue arrows. Pay close attention to the type of price action that follows these climaxes.
The DecisionPoint Weekly Wrap presents an end-of-week assessment of the trend and condition of the stock market (S&P 500), the U.S. Dollar, Gold, Crude Oil, and Bonds.
STOCKS
IT Trend Model: BUY as of 11/15/2016
LT Trend Model: BUY as of 4/1/2016
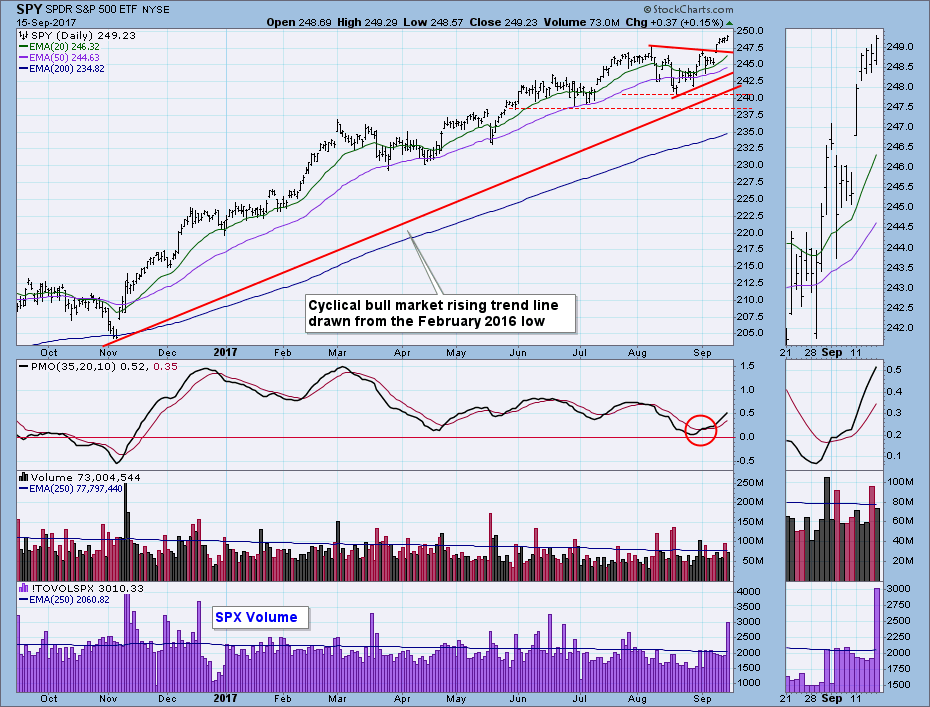
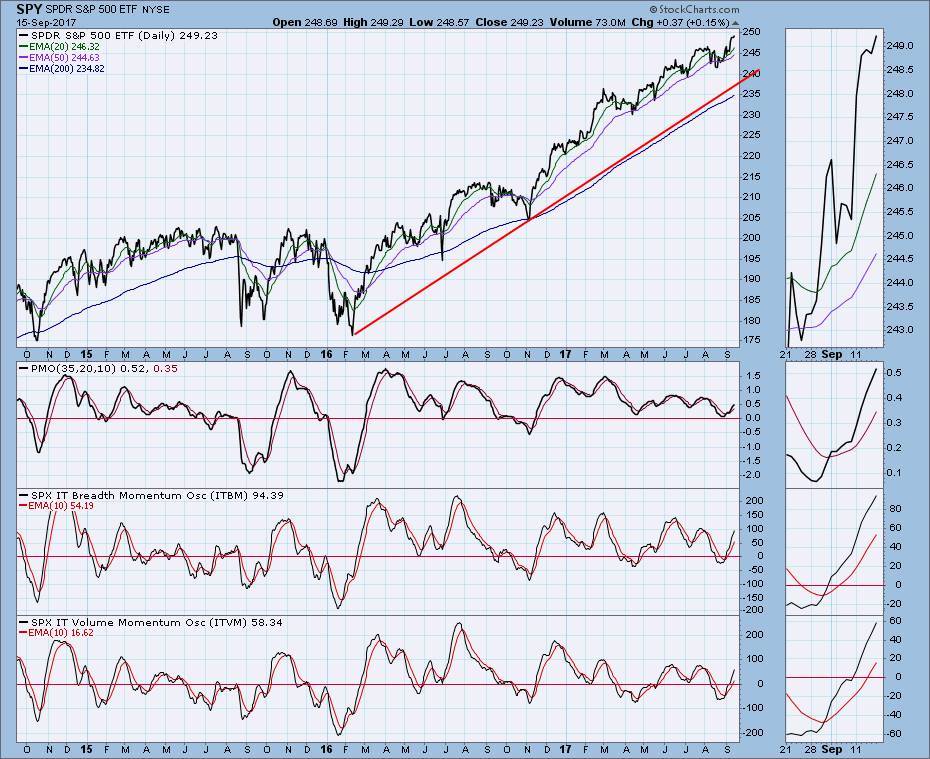
The triangle formation resolved to the upside this week, and the market once again made new, all-time highs. The extremely high SPX volume on Friday has to do with options expiration, not any of the things we normally associate with high volume. The daily PMO is rising from a fairly solid PMO bottom in August. There is plenty of room to accommodate higher prices.
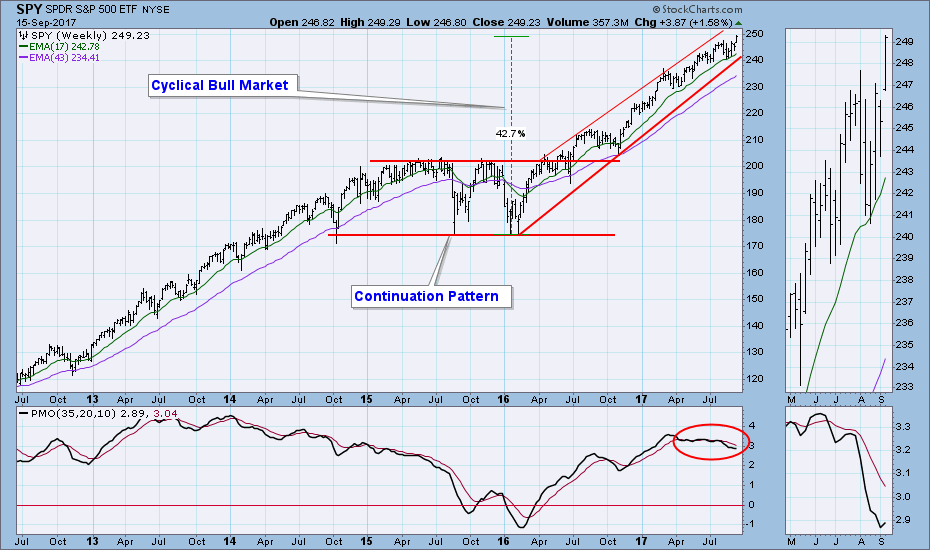
During the brief correction SPY never challenged the bottom of the rising trend channel, and it is now headed for the top of the channel. The weekly PMO turned up.
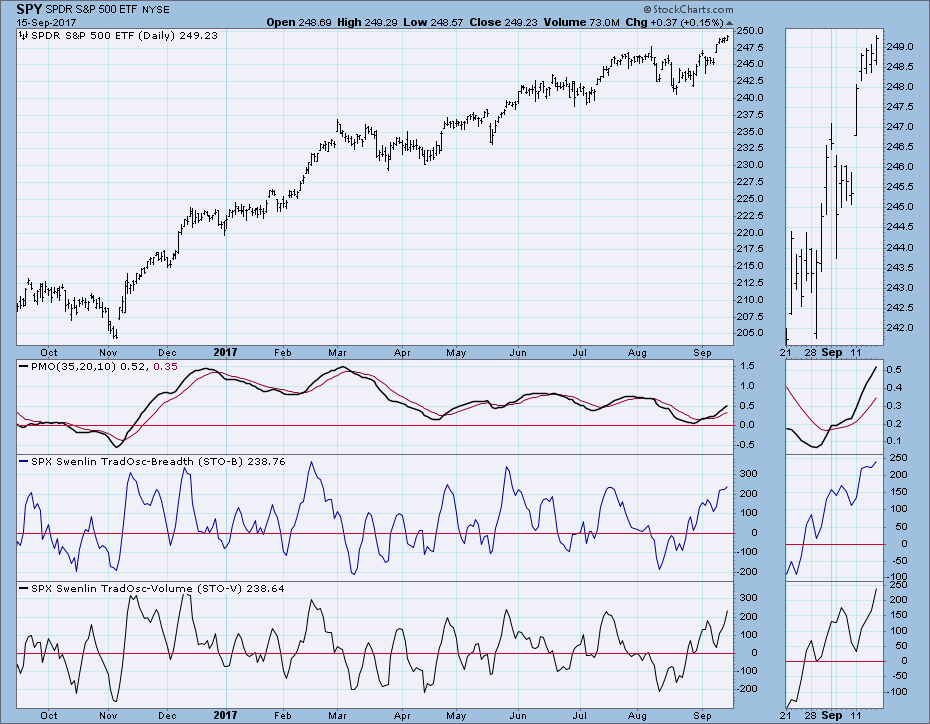
Short-Term Market Indicators: These indicators are now overbought.
Intermediate-Term Market Indicators: These indicators are also somewhat overbought.
Conclusion: We got the breakout we were expecting, and it doesn't look at all like a blowoff. Internals are somewhat overbought, but in a bull market that is not necessarily an obstacle to higher prices. Since the election, the market has been grinding steadily higher, and corrections have been small and brief. At this point, I expect that kind of action to continue.
DOLLAR (UUP)
IT Trend Model: NEUTRAL as of 3/21/2017
LT Trend Model: SELL as of 5/24/2017
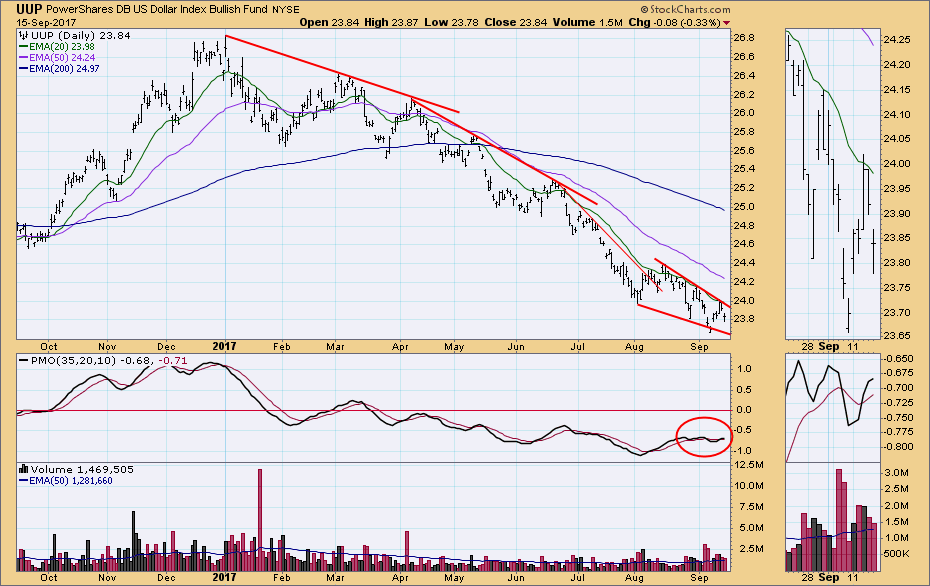
Last week it appeared that price had broken down from the falling wedge formation, but it bounced back up into the wedge this week, and the expectation of an upside resolution has returned. The daily PMO is flat and basically no help.
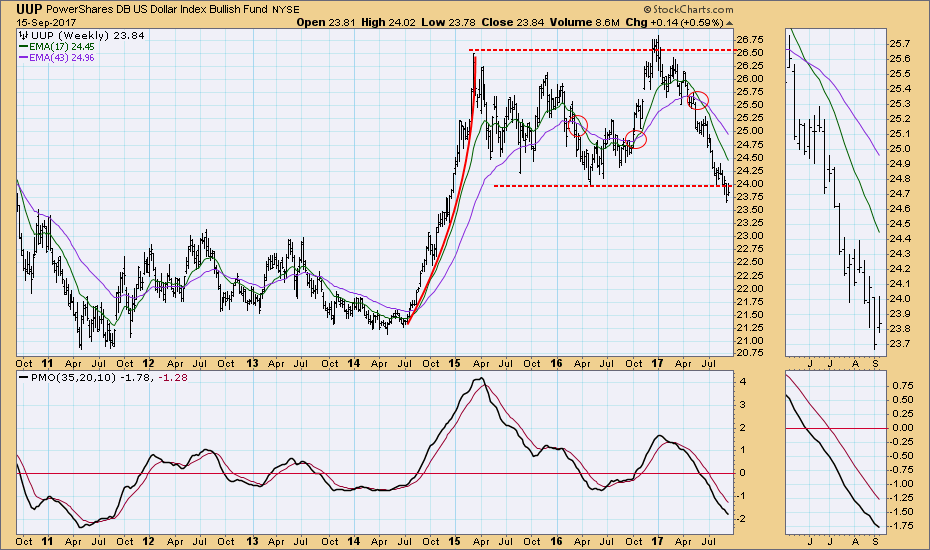
Bullish expectations from the daily chart are dampened by what we see on the weekly chart. Price has broken below longer-term support, and the weekly PMO is falling.
GOLD
IT Trend Model: BUY as of 7/31/2017
LT Trend Model: BUY as of 4/12/2017
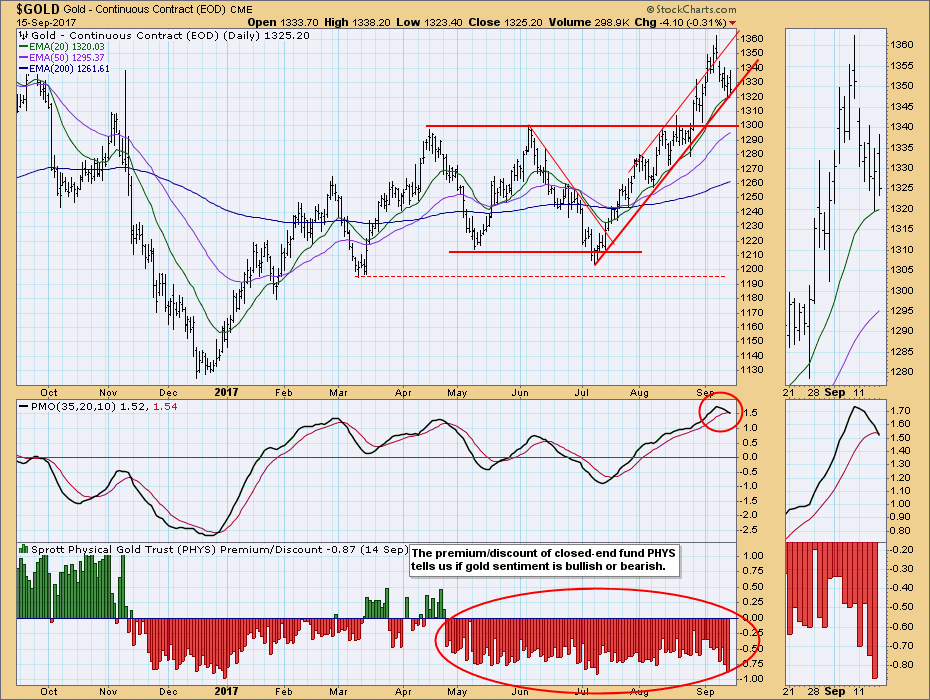
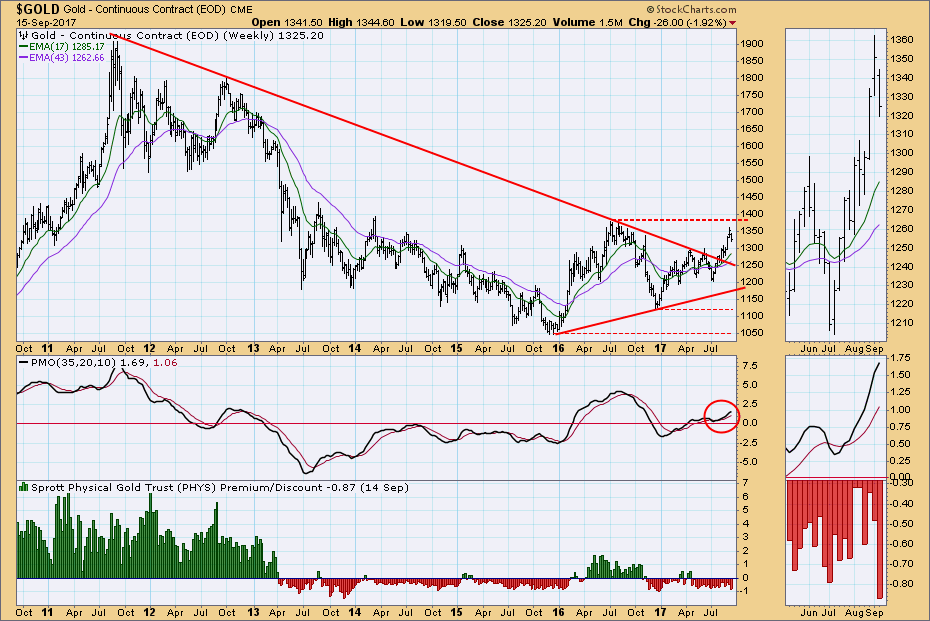
We can see where last week the price of gold became somewhat extended relative to the two-month rising trend line. This week gold corrected back to the rising trend line, and has so far remained above it. The daily PMO has topped and may be hinting that more price decline is ahead.
The weekly chart looks very positive, with price being well above the long-term declining tops line, and the weekly PMO in a steep rise. The main problem with gold is that sentiment has not turned bullish, and that needs to happen before we can feel confident that gold will continue to rally in the long term.
CRUDE OIL (USO)
IT Trend Model: BUY as of 9/6/2017
LT Trend Model: SELL as of 3/9/2017
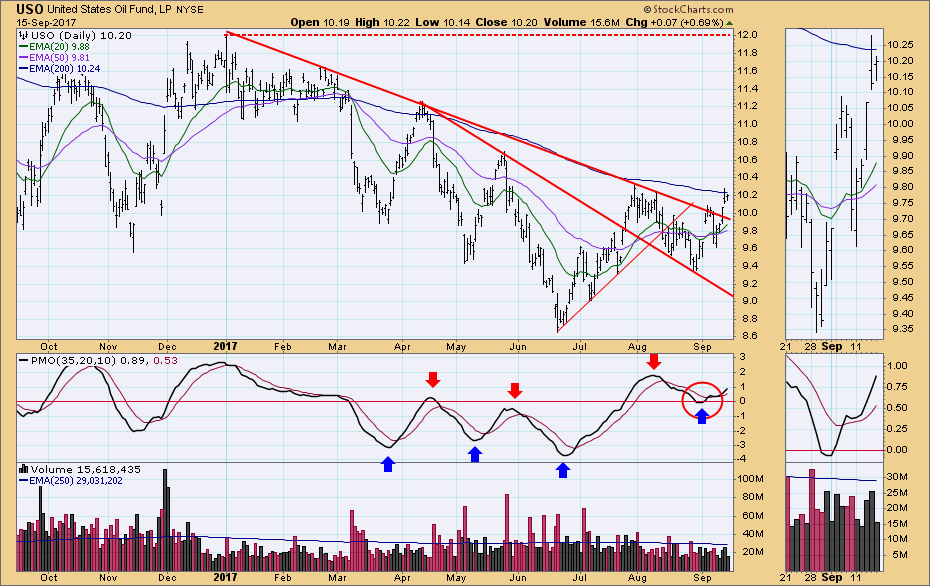
USO finally overcame the eight-month declining tops line this week. The daily PMO allows for the rally to continue.
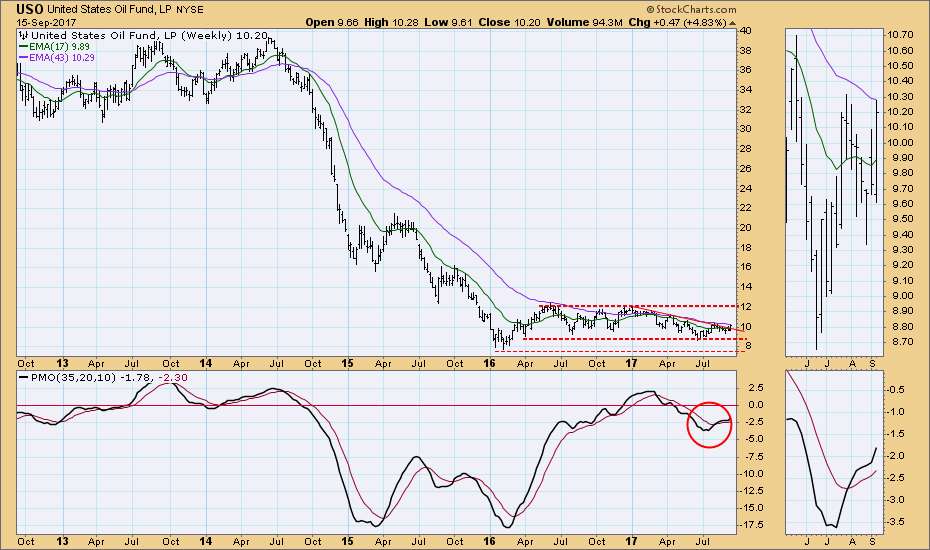
The weekly chart shows the broader context of price being contained within an 18-month trading channel. I see the top of that channel as being both a reasonable target and the probable limit to the rally.
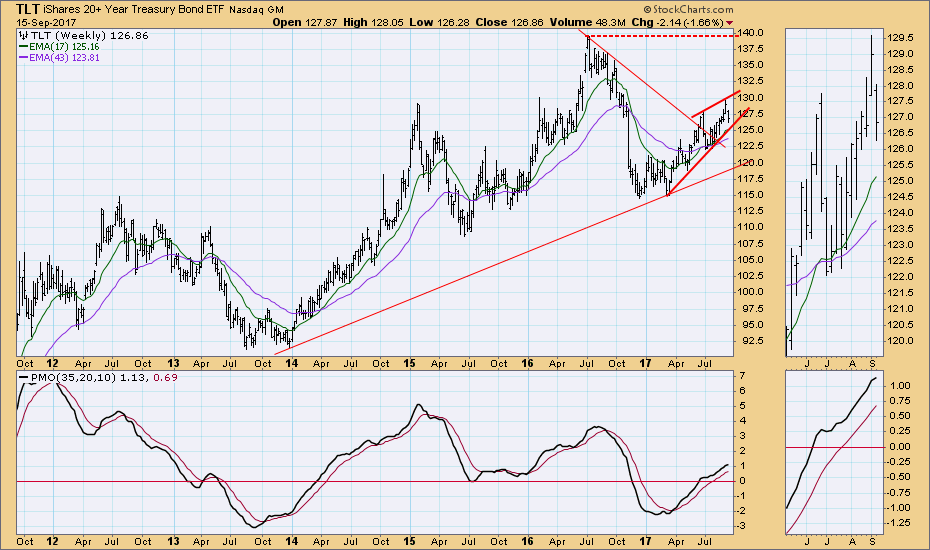
BONDS (TLT)
IT Trend Model: BUY as of 3/31/2017
LT Trend Model: BUY as of 6/16/2017
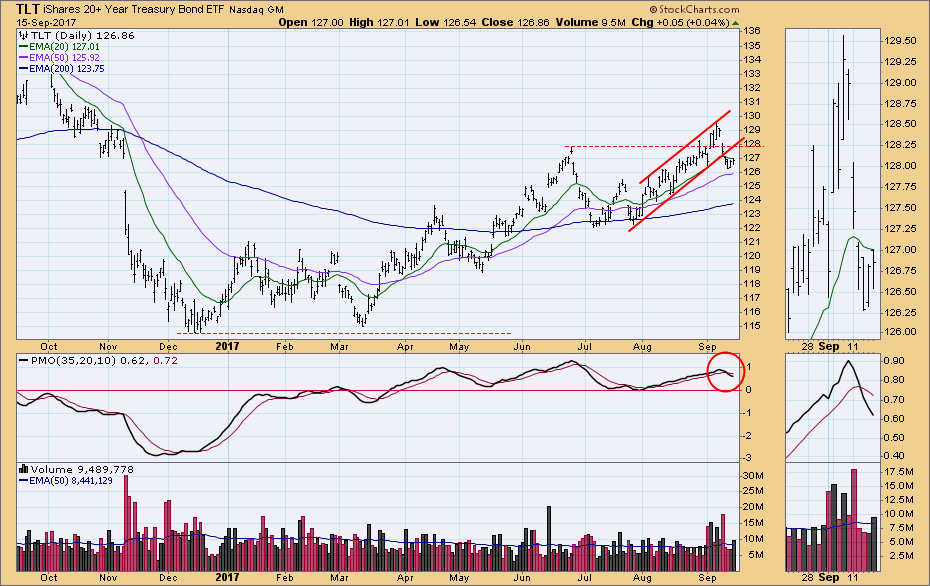
Price had overcome the resistance line drawn across the June top, but this week price collapsed, falling out of the rising trend channel. The daily PMO had become overbought relative to other PMO tops this year, and it topped and crossed down through the signal line. The picture is turning negative.
The dominant feature on the weekly chart is the bearish rising wedge formation, which we should expect to resolve downward. That is the only negative in an otherwise bullish picture.
**Don't miss any of the DecisionPoint commentaries! Go to the "Notify Me" box toward the end of this blog page to be notified as soon as they are published.**
Technical Analysis is a windsock, not a crystal ball.
Happy Charting!
- Carl
NOTE: The signal status reported herein is based upon mechanical trading model signals, specifically, the DecisionPoint Trend Model. They define the implied bias of the price index based upon moving average relationships, but they do not necessarily call for a specific action. They are information flags that should prompt chart review. Further, they do not call for continuous buying or selling during the life of the signal. For example, a BUY signal will probably (but not necessarily) return the best results if action is taken soon after the signal is generated. Additional opportunities for buying may be found as price zigzags higher, but the trader must look for optimum entry points. Conversely, exit points to preserve gains (or minimize losses) may be evident before the model mechanically closes the signal.
Helpful DecisionPoint Links:
DecisionPoint Shared ChartList and DecisionPoint Chart Gallery
Price Momentum Oscillator (PMO)
Swenlin Trading Oscillators (STO-B and STO-V)

