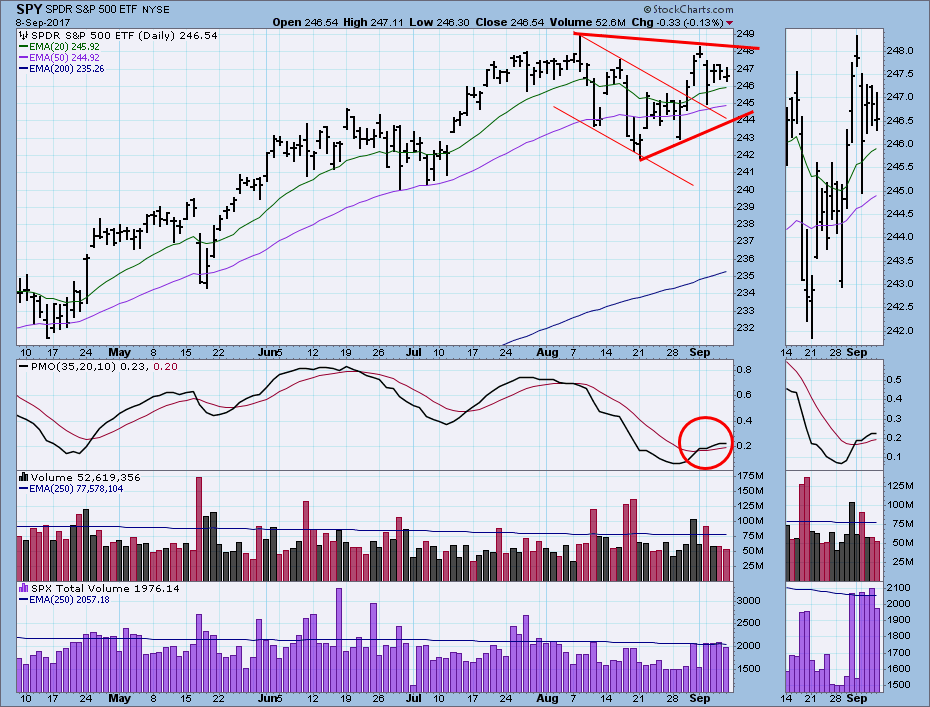
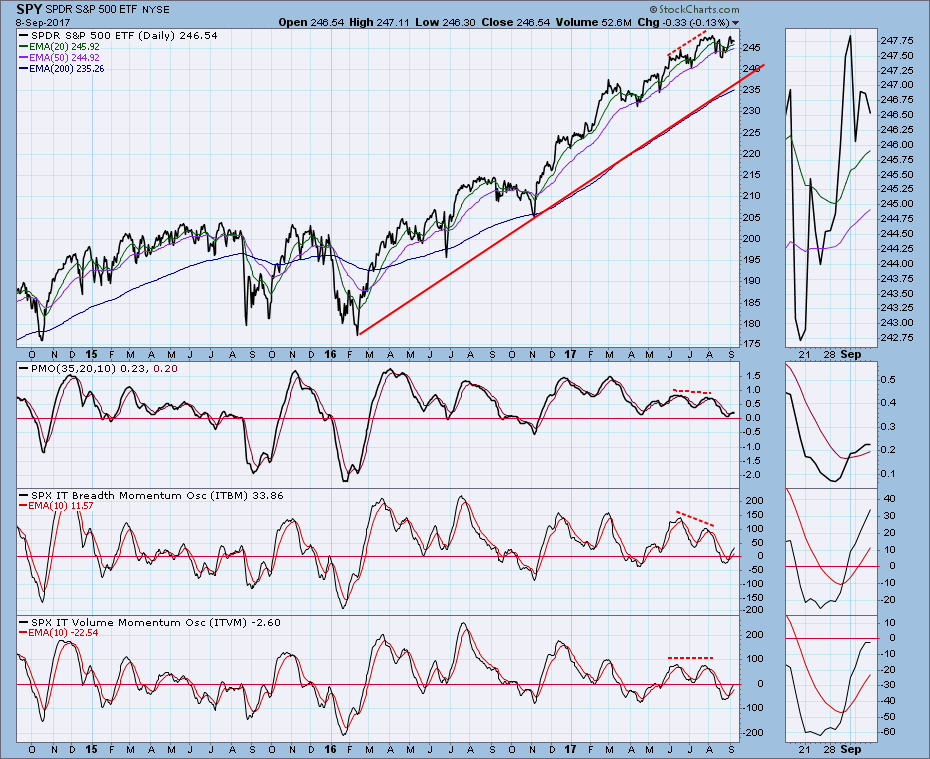
Last week there was a high-volume breakout above a declining tops line. This week price pulled back to the line, bounced somewhat higher, then moved sideways the rest of the week. S&P 500 total volume was fairly robust compared to the weaker SPY trading volume, so there was more going on than we might have expected during a short week. The daily PMO lost its starch and went flat. Most interesting, a new price pattern, a triangle, has emerged. Since the top of the triangle is not as steep as the bottom line, I believe the bias is bullish.
The DecisionPoint Weekly Wrap presents an end-of-week assessment of the trend and condition of the stock market (S&P 500), the U.S. Dollar, Gold, Crude Oil, and Bonds.
STOCKS
IT Trend Model: BUY as of 11/15/2016
LT Trend Model: BUY as of 4/1/2016
The most immediately dominant feature on the daily chart is the triangle formation drawn from the August high and low. Price has been moving sideways for about two months.
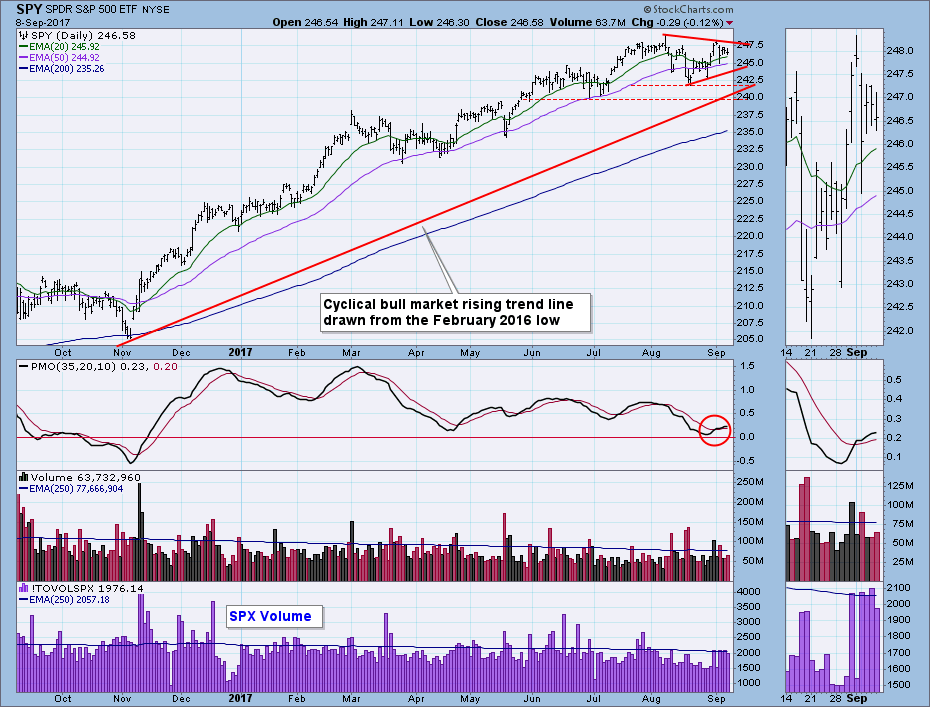
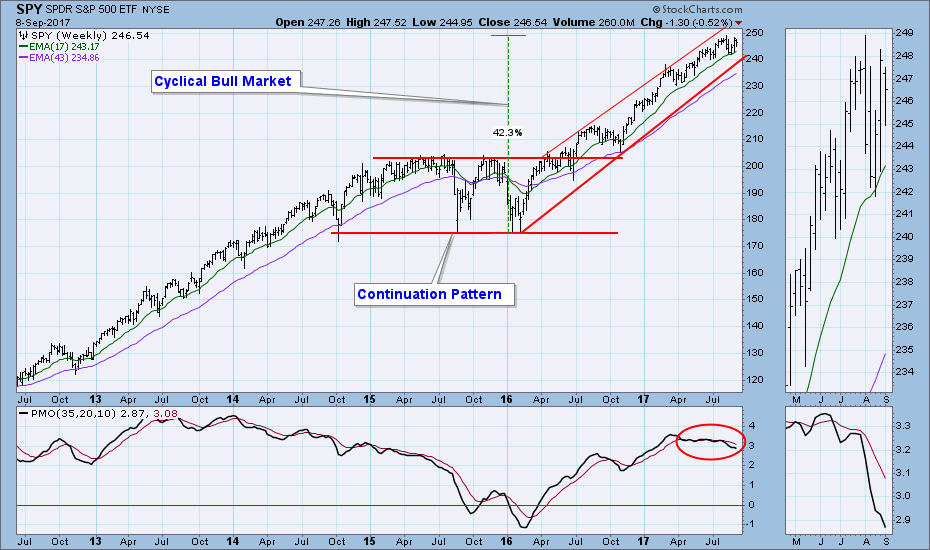
The weekly chart shows the solid bull market rising trend channel, and price is about midway that channel. The cyclical bull market is defined by the rising trend line drawn from the February 2016 low. Violation of the line would be a serious technical issue, but price is still well above it. The weekly PMO is below its signal line and it reflects the pause in upward price movement.
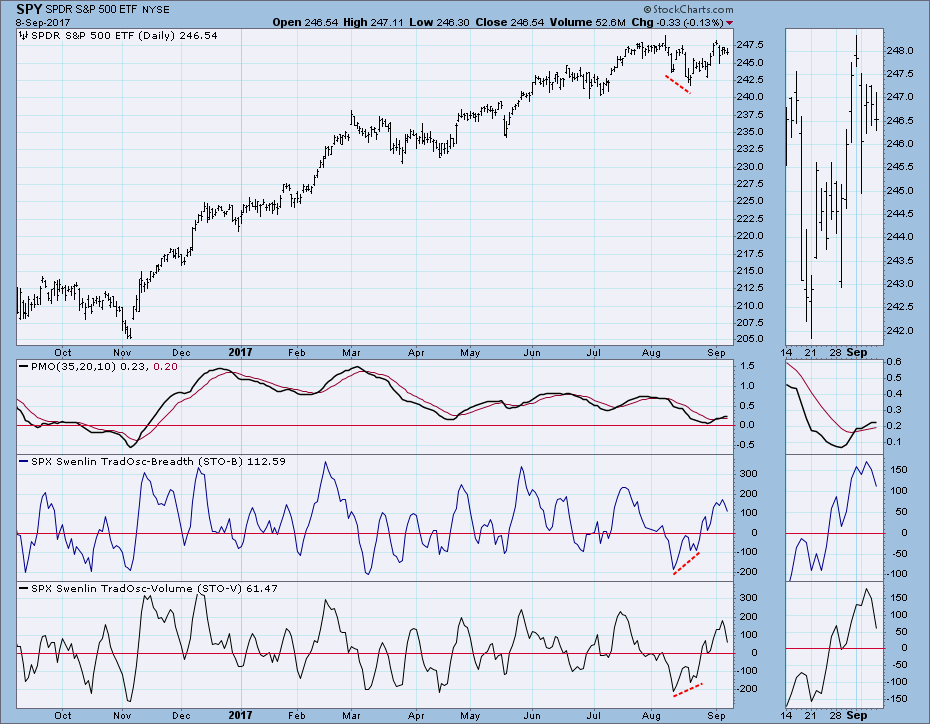
Short-Term Market Indicators: These indicators are falling from modestly overbought levels, but note how many direction changes they have had as they moved up from their August lows. Unusually choppy and hard to interpret.
Intermediate-Term Market Indicators: The PMO and ITVM are trying to top. If they were to do so, it would be very negative.
Conclusion: Last week I wrote: The market has broken its short-term down trend and is once again challenging all-time highs. Maybe it will have to churn sideways some more before a decisive breakout takes place, but at this point I am not expecting the August low to be taken out. In fact, I would venture to say that a breakout is not far away. If the correction is in fact over, it has not been a very bad one. On a closing basis only -2.1% was lost, and only -2.9% intraday.
I don't think I want to change any of that. Since the breakout didn't happen this week, I am, perhaps, just a smidge less confident than I was last week, but our indicators leave plenty of room for continued price advance.
DOLLAR (UUP)
IT Trend Model: NEUTRAL as of 3/21/2017
LT Trend Model: SELL as of 5/24/2017
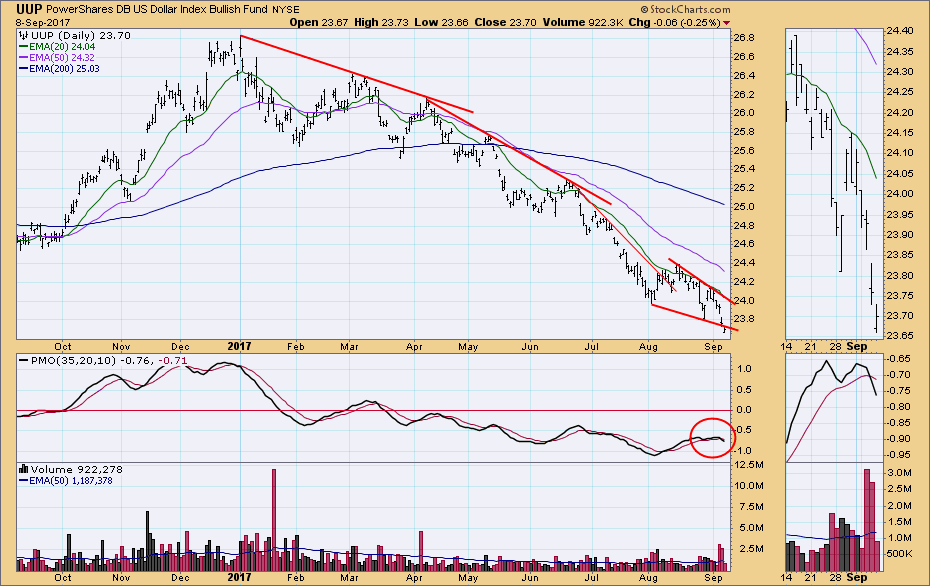
After the bounce off of last week's low, a falling wedge formed. We normally expect a bullish resolution from this pattern, but the dollar is in a bear market, and on Friday UUP broke down from the wedge. The daily PMO has topped and crossed down through the signal line.
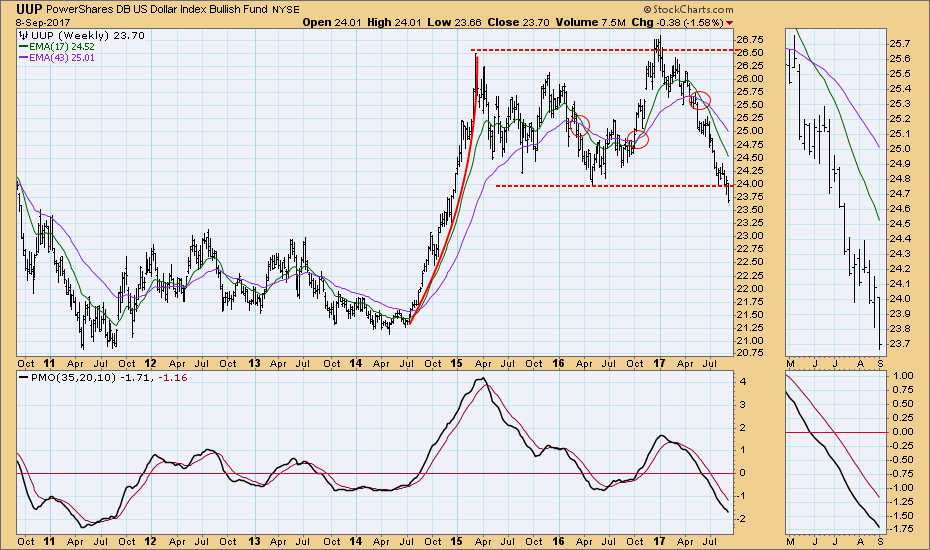
The weekly chart shows that there was important support at 24.00 That support has clearly failed, but the breakdown will not become 'decisive' until about 23.25.
GOLD
IT Trend Model: BUY as of 7/31/2017
LT Trend Model: BUY as of 4/12/2017
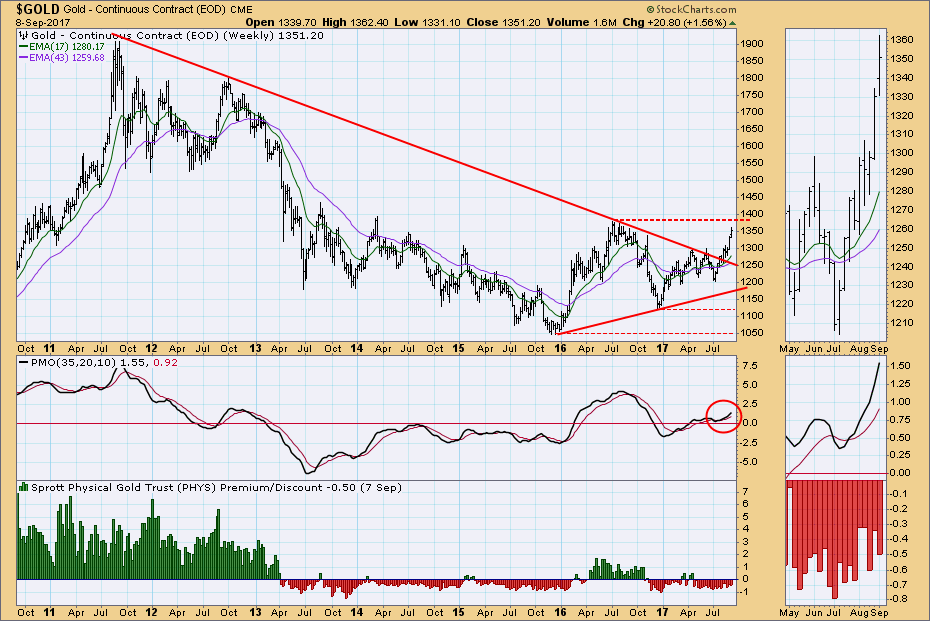
Gold's breakout from the recent trading range is now 'decisive,' meaning that it is at least three percent above the point of breakout. The daily PMO is overbought relative to its recent range, but PMO 2.0 or higher is more typical of a bull market. Gold is in a bull market, but we still need to see sentiment turn bullish before we can consider the bull market to be in full force.
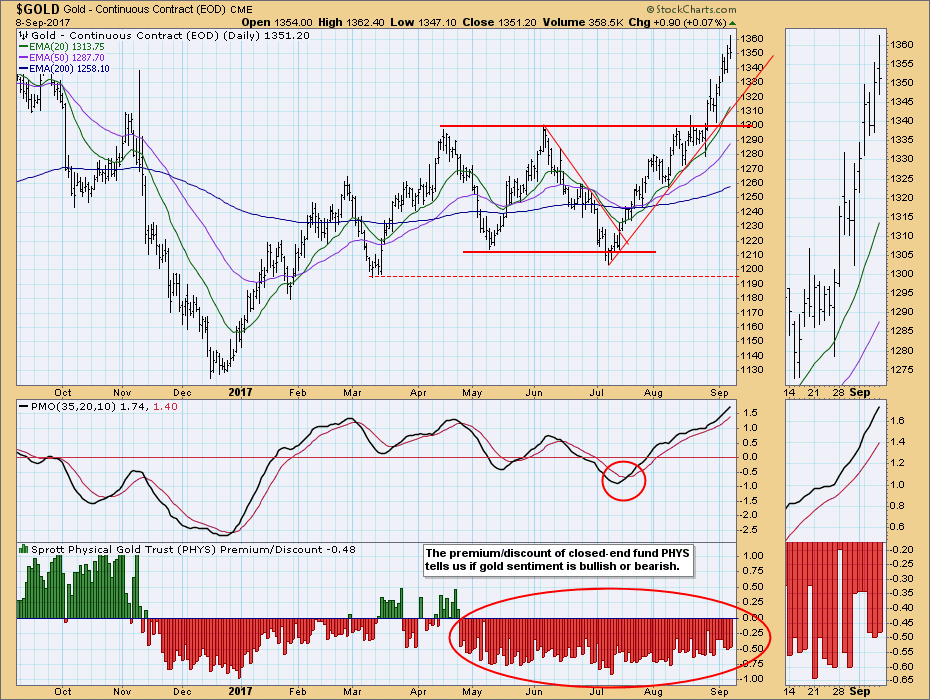
The breakout through the bear market declining tops line is clearly a decisive move. Price needs to break through the resistance line drawn across the 2016 top in order to establish a long-term rising trend.
CRUDE OIL (USO)
IT Trend Model: BUY as of 9/6/2017
LT Trend Model: SELL as of 3/9/2017
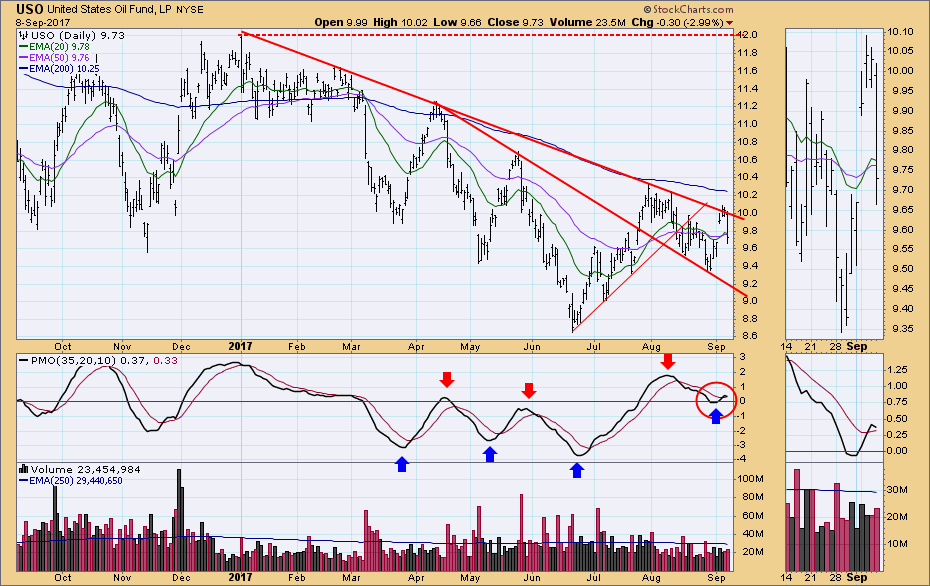
On Wednesday USO generated a new IT Trend Model BUY signal, when the 20EMA crossed up through the 50EMA. There is a good chance that this is a whipsaw signal because today price was turned back from the declining tops line drawn from the January top. Note that the daily PMO topped.
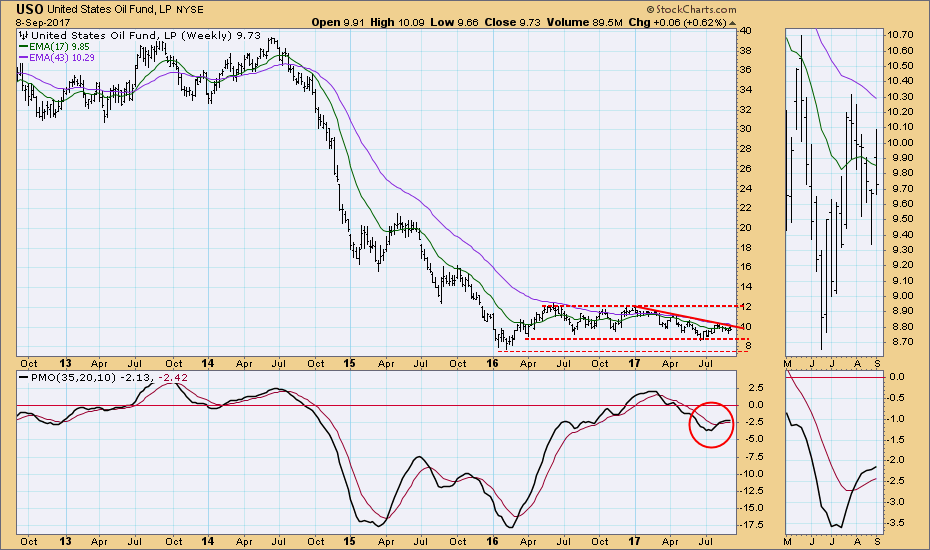
USO had a solid advance for the week, easily seen on the thumbnail chart, but price closed at the low end of the week's range. The declining tops line still rules inside the 18-month trading range.
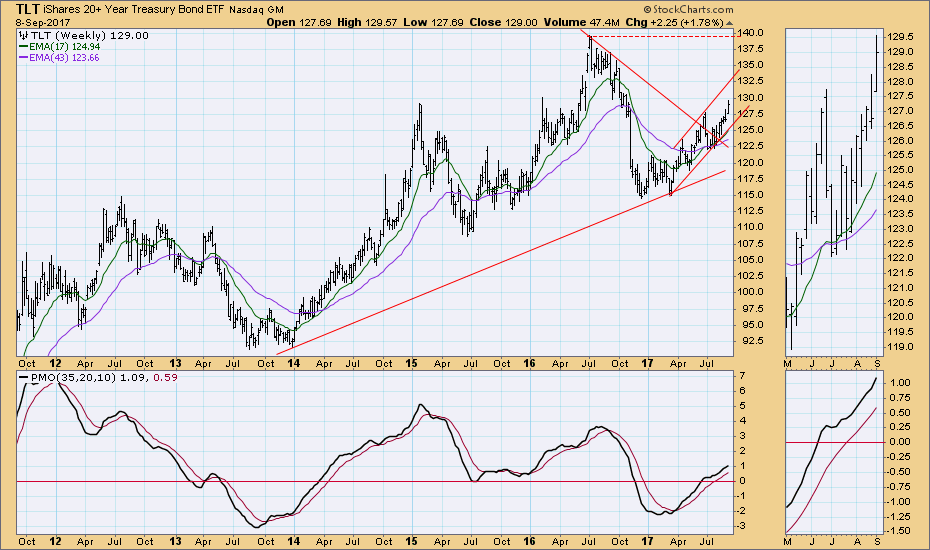
BONDS (TLT)
IT Trend Model: BUY as of 3/31/2017
LT Trend Model: BUY as of 6/16/2017
The daily PMO is reaching previously overbought levels seen in April and June, but historically, PMO readings of around 2.0 are the more normal overbought level.
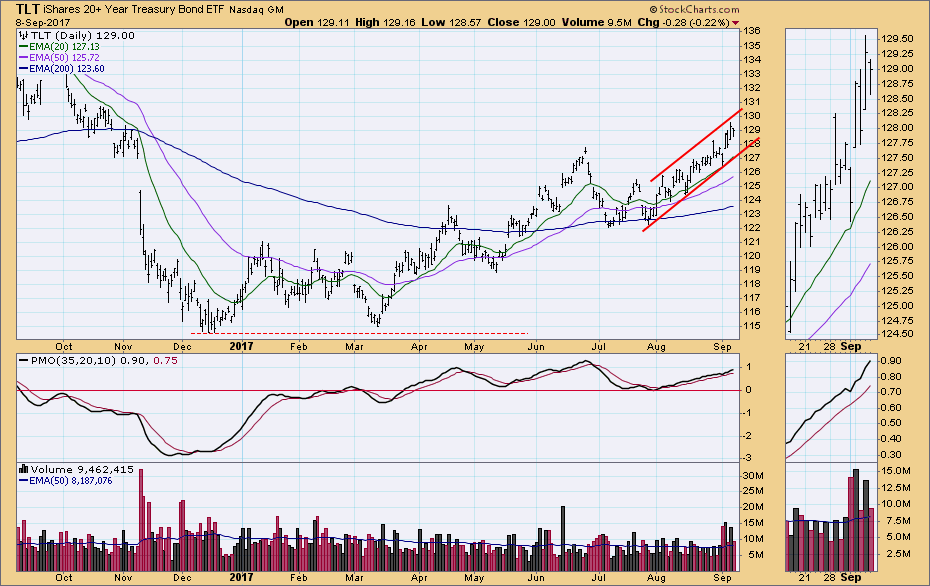
The weekly chart is very bullish. The resistance line drawn across the all-time high is still quite far away, and there is also plenty of room before price reaches the top of the rising trend channel.
**Don't miss any of the DecisionPoint commentaries! Go to the "Notify Me" box toward the end of this blog page to be notified as soon as they are published.**
Technical Analysis is a windsock, not a crystal ball.
Happy Charting!
- Carl
NOTE: The signal status reported herein is based upon mechanical trading model signals, specifically, the DecisionPoint Trend Model. They define the implied bias of the price index based upon moving average relationships, but they do not necessarily call for a specific action. They are information flags that should prompt chart review. Further, they do not call for continuous buying or selling during the life of the signal. For example, a BUY signal will probably (but not necessarily) return the best results if action is taken soon after the signal is generated. Additional opportunities for buying may be found as price zigzags higher, but the trader must look for optimum entry points. Conversely, exit points to preserve gains (or minimize losses) may be evident before the model mechanically closes the signal.
Helpful DecisionPoint Links:
DecisionPoint Shared ChartList and DecisionPoint Chart Gallery
Price Momentum Oscillator (PMO)
Swenlin Trading Oscillators (STO-B and STO-V)


