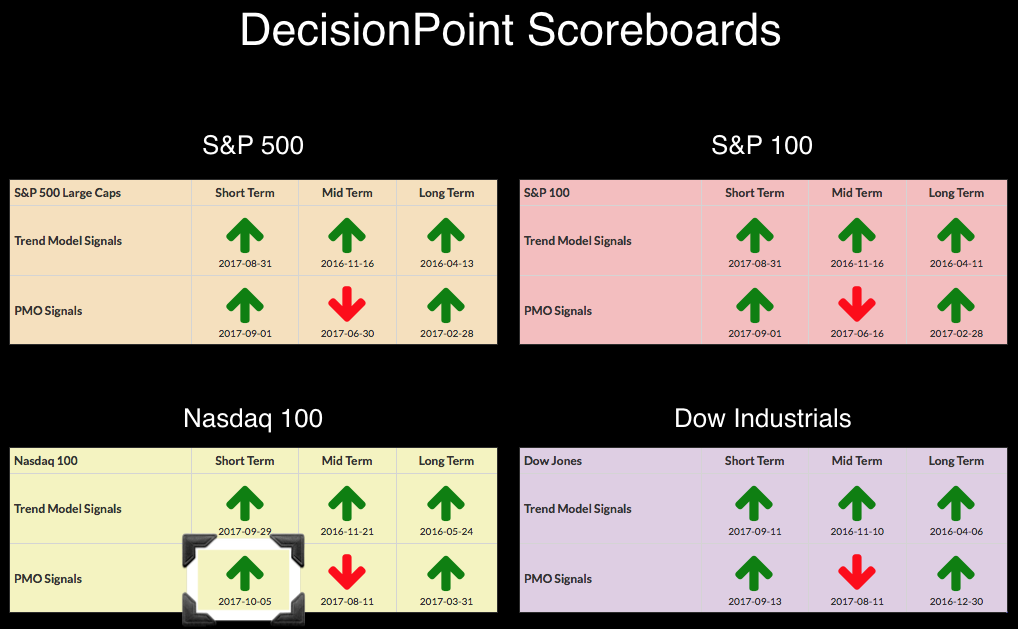
It took the NDX two weeks to a month more to update its Short-Term PMO to a BUY signal in comparison to its peers. The dates underneath the signals on the Scoreboard tell the story of a difficult decline and then rally run for the NDX and technology in general. Two more interesting signals came in today. GSG, the Commodities iShares ETF logged a new Long-Term Trend Model BUY signal. Additionally, TLT triggered a new IT Trend Model Neutral signal.

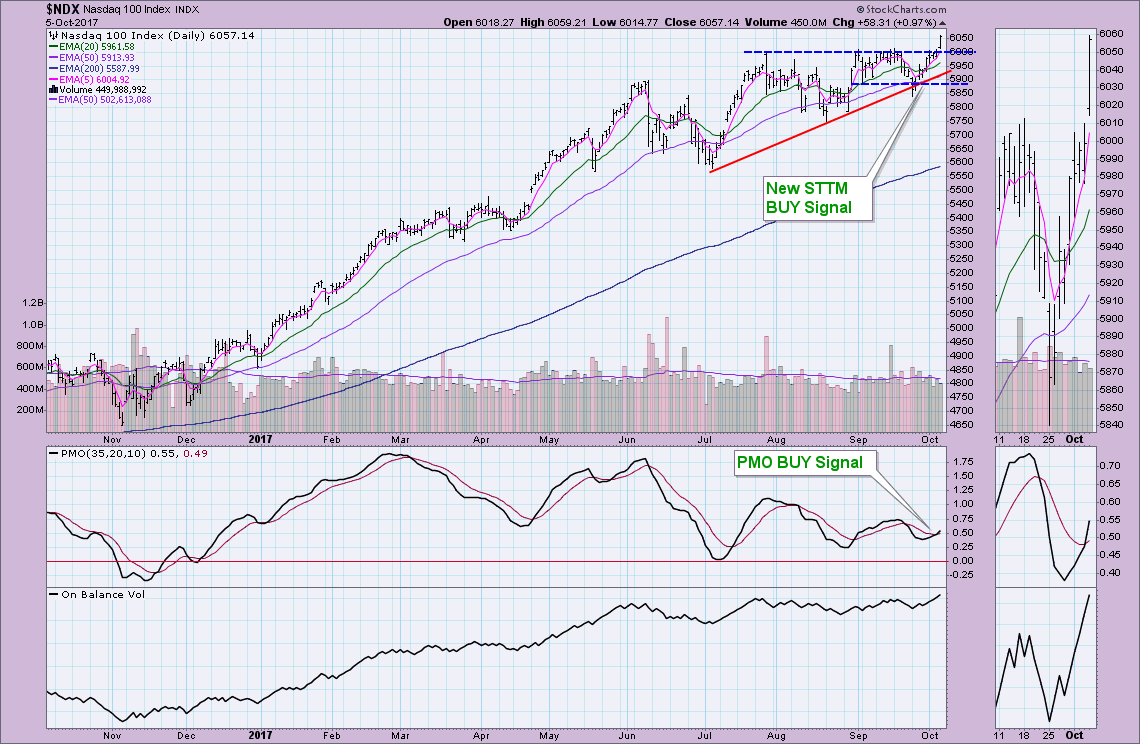
The NDX recently logged a ST Trend Model BUY signal (9/29) and today's PMO BUY signal confirms the price trend and especially the breakout to new all-time highs. The OBV on this breakout has moved above the top in July which can be considered a bullish confirmation.
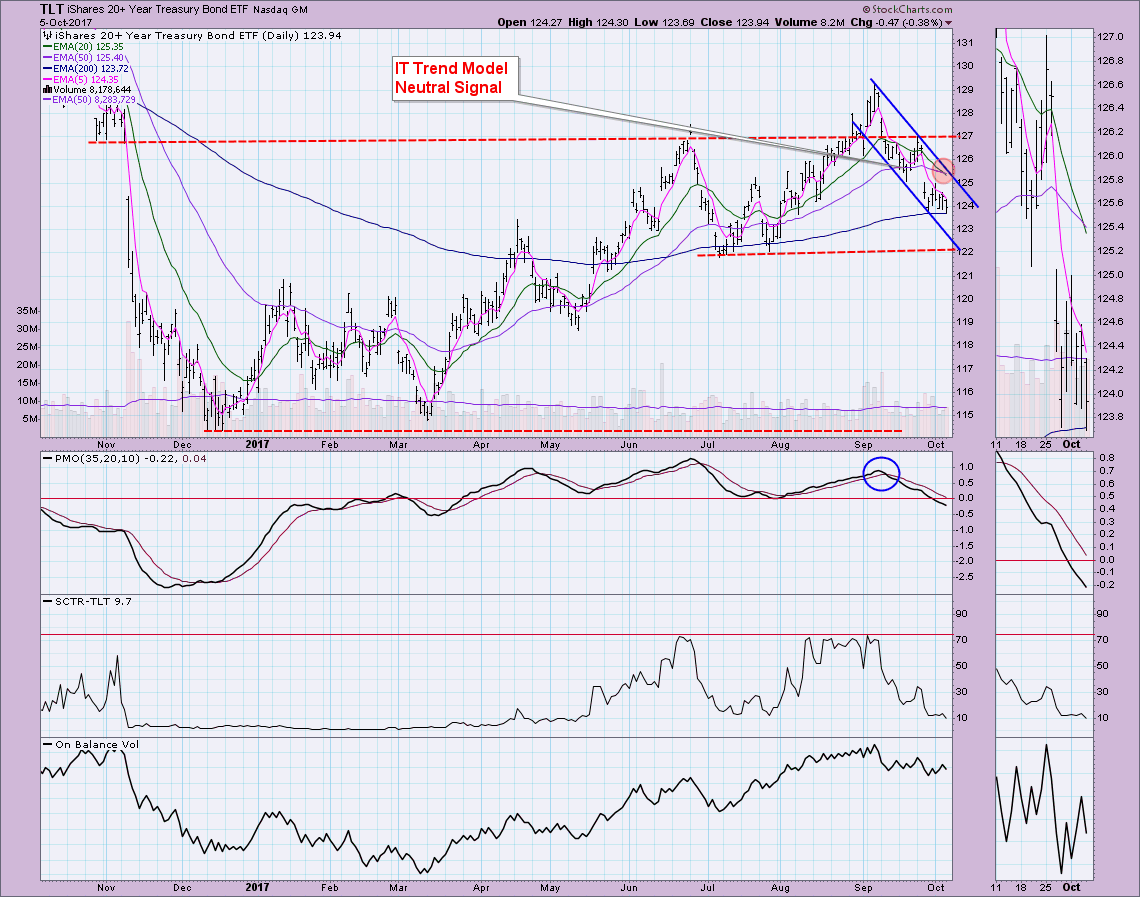
Bonds on the other hand, just logged an IT Trend Model Neutral signal. The signal was triggered when the 20-EMA crossed below the 50-EMA while the 50-EMA was above the 200-EMA. DecisionPoint considers any stock, ETF, index, etc. to be in a "bull market" while the 50-EMA is above the 200-EMA; so rather than move to a SELL signal while that stock, index, etc. is in a "bull market", we choose a Neutral signal (meaning fully hedged or in cash). TLT has been forming what could be considered an island which would set up a closure of the gap down. We're also seeing price hold the 200-EMA. The PMO is unwinding and is below zero for the time since March. While I think this would be a great place for a reversal, I know that yields are rising, the financial sector is beginning to thrive again and all of that has me less than bullish on bonds. I don't think this will be the reversal point. Given the PMO is continuing lower and we're not seeing convincing evidence from either the OBV or SCTR, I expect the decline to continue to $122 for TLT.
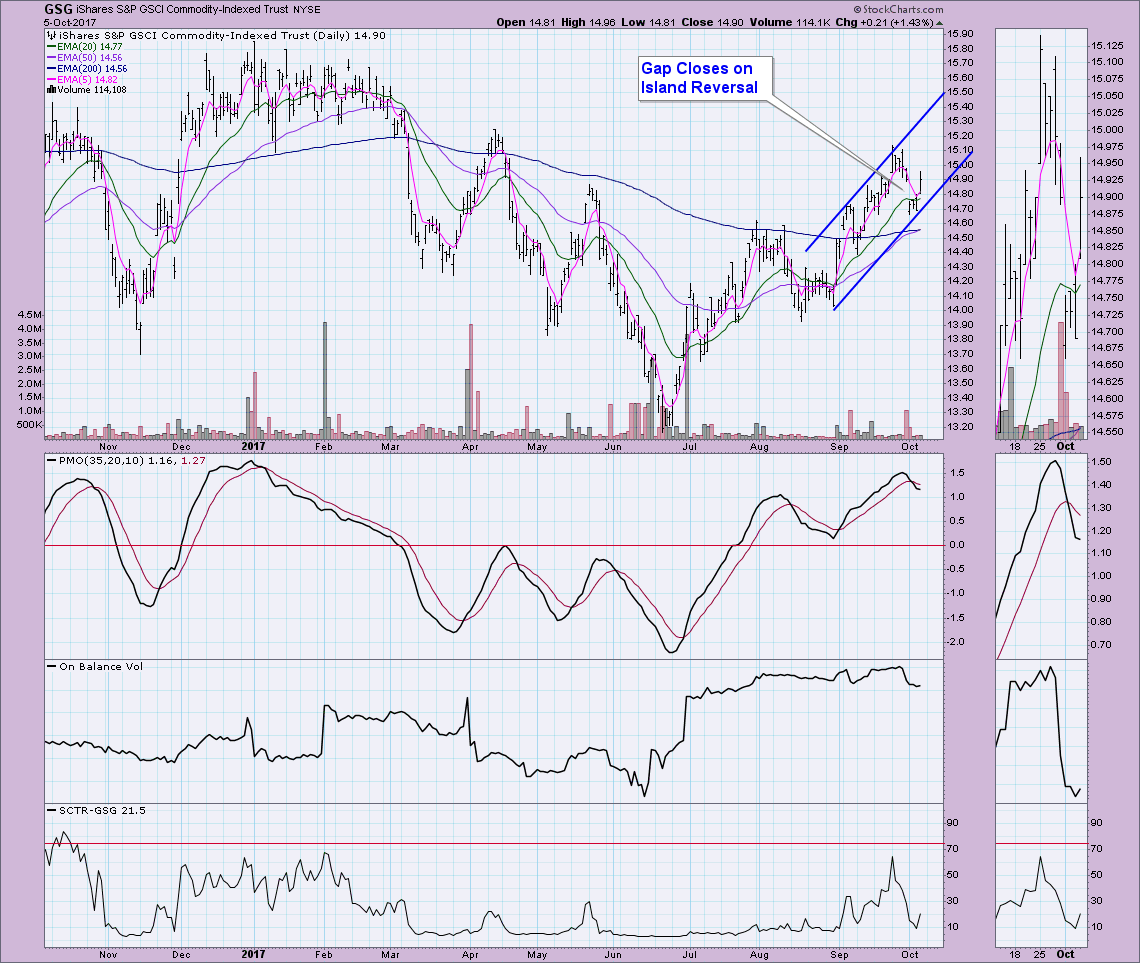
With the rally in the Oil and Gas sector, GSG had begun to enjoy a rally itself. Unfortunately being tied so closely to Oil, when Oil began to drop, so did GSG. However, the rising trend channel and price remaining above the 200-EMA triggered a Long-Term Trend Model BUY signal as the 50-EMA crossed above the 200-EMA. The overbought PMO SELL signal isn't good, but it is decelerating and trying to turn up. The OBV isn't convincing nor is the volume pattern. Last week there was a glut of selling on very high volume and today's breakout showed very unimpressive volume. So while we are seeing this closure of the gap on the island and a new Long-Term Trend Model BUY signal, I wouldn't be jumping into GSG to catch a rally. It could be very short-lived. One nice thing about the LTTM BUY signal is that it does set up GSG in a "bull market" configuration and that will definitely provide fertile ground for a subsequent rally. I would be cautious right now.
Helpful DecisionPoint Links:
DecisionPoint Shared ChartList and DecisionPoint Chart Gallery
Price Momentum Oscillator (PMO)
Swenlin Trading Oscillators (STO-B and STO-V)
Technical Analysis is a windsock, not a crystal ball.
Happy Charting!
- Erin
**Don't miss DecisionPoint Commentary! Add your email below to be notified of new updates"**


