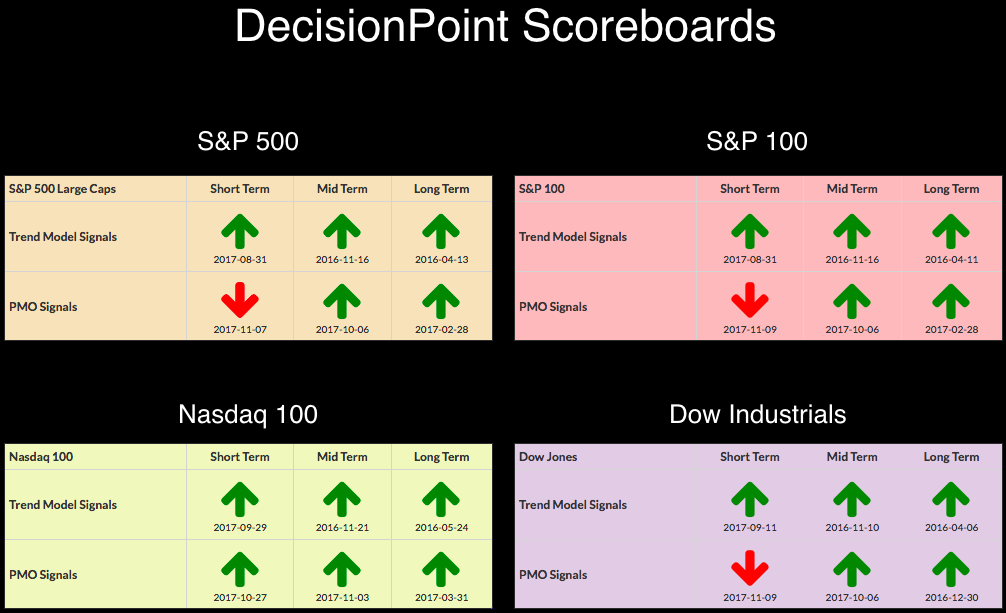
 Since November 9th, the DP Scoreboards have been quiet. It isn't surprising to see the weakness on these Scoreboards to be short-term momentum given the recent decline. The SPY/SPX have now dropped below rising trend channels, but support remains. With DP indicators looking bearish, we could be in for more downside in both the short and intermediate terms.
The purpose of the DecisionPoint Alert Daily Update is to quickly review the day's action, internal condition, and Trend Model status of the broad market (S&P 500), the nine SPDR Sectors, the U.S. Dollar, Gold, Crude Oil, and Bonds. To ensure that using this daily reference will be quick and painless, we are as brief as possible, and sometimes we let a chart speak for itself.
SIGNALS: Here we include charts of any important signal changes triggered today by our Intermediate-Term Trend Model.
NO NEW SIGNALS TO REPORT
NOTE: Mechanical trading model signals define the implied bias of the price index based upon moving average relationships, but they do not necessarily call for a specific action. They are information flags that should prompt chart review. Further, they do not call for continuous buying or selling during the life of the signal. For example, a BUY signal will probably return the best results if action is taken soon after the signal is generated. Additional opportunities for buying may be found as price zigzags higher, but the trader must look for optimum entry points. Conversely, exit points to preserve gains (or minimize losses) may be evident before the model mechanically closes the signal.
STOCKS
IT Trend Model: BUY as of 11/15/2016
LT Trend Model: BUY as of 4/1/2016
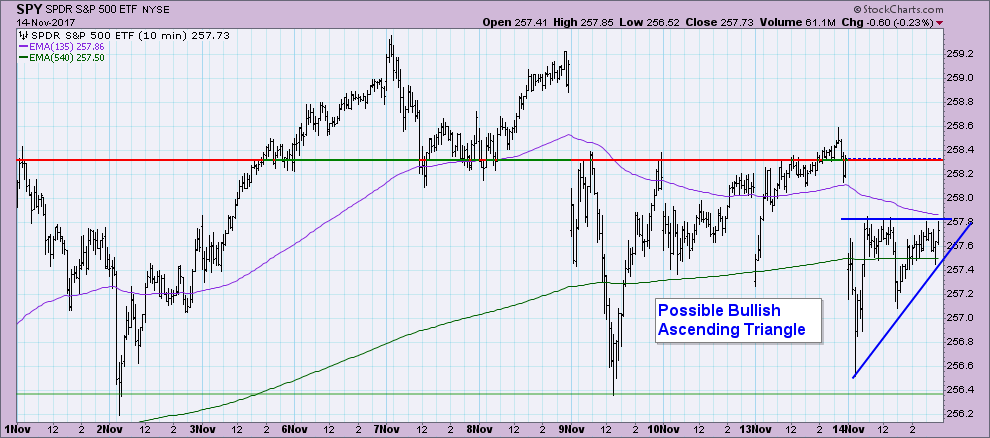
When you look at market action over the past 10 trading days, the decline we've been experiencing doesn't look so bad. Price has now bounced off the November 2 low twice. I do see a possible bullish ascending triangle which would call for some upside movement tomorrow.
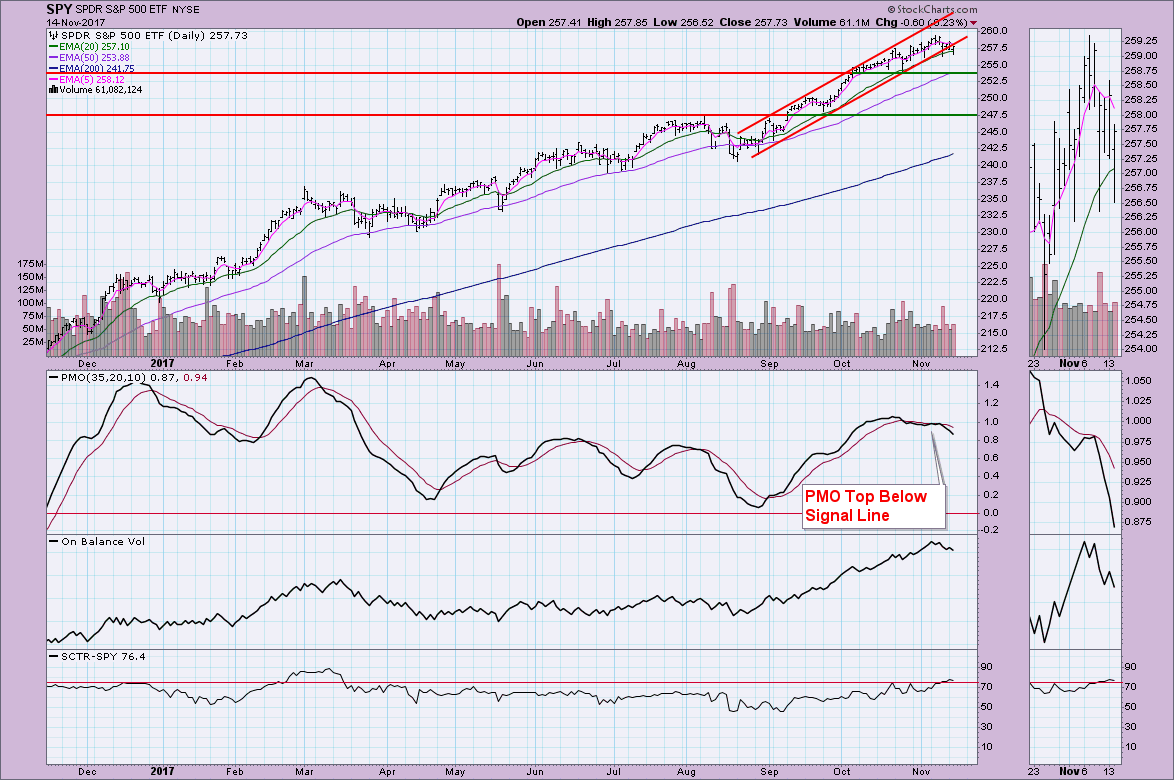
It is hard to call this a "breakdown" from the rising trend channel as it has more of the appearance of a 'drift' through the rising bottoms trendline. At this point, the 20-EMA is providing some support as well as the November low. The PMO is certainly a problem and now we can see OBV is trailing off. Internal strength remains based on the high SCTR value. If we do see more decline, the next area of support is at the mid-October lows.
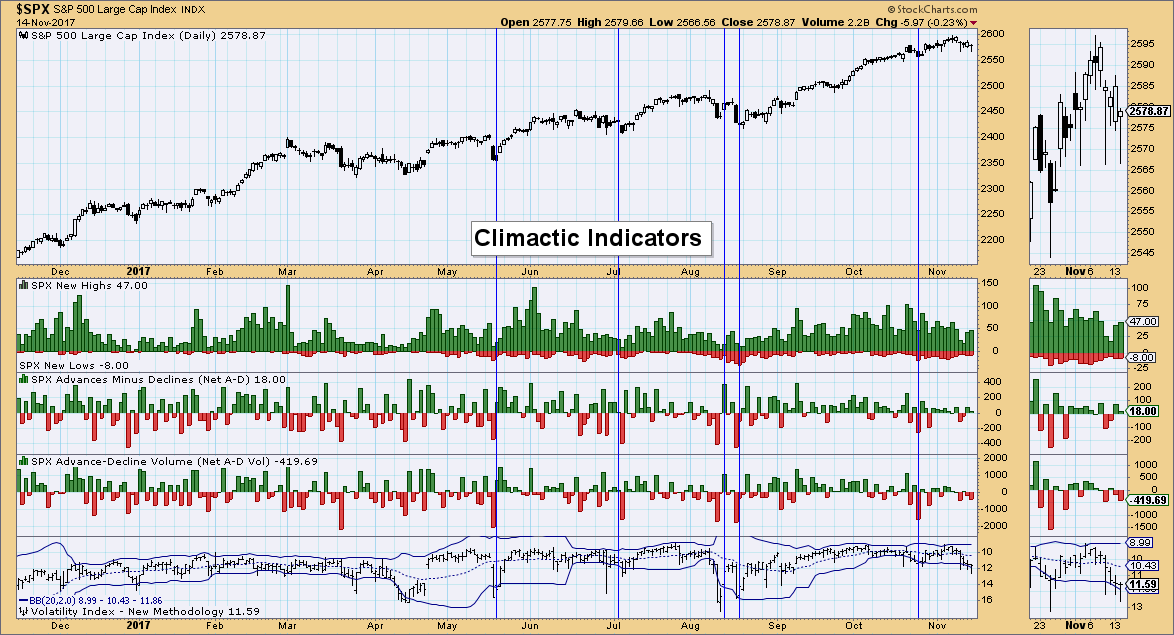
Climactic Indicators: I've annotated what usually happens when we get a penetration of the lower Bollinger Band on the VIX. This has the appearance of a selling exhaustion. Unfortunately, I'm not getting any climactic readings on the other indicators. The final candlestick in this current decline is a hammer which would also suggest a rally pop tomorrow.
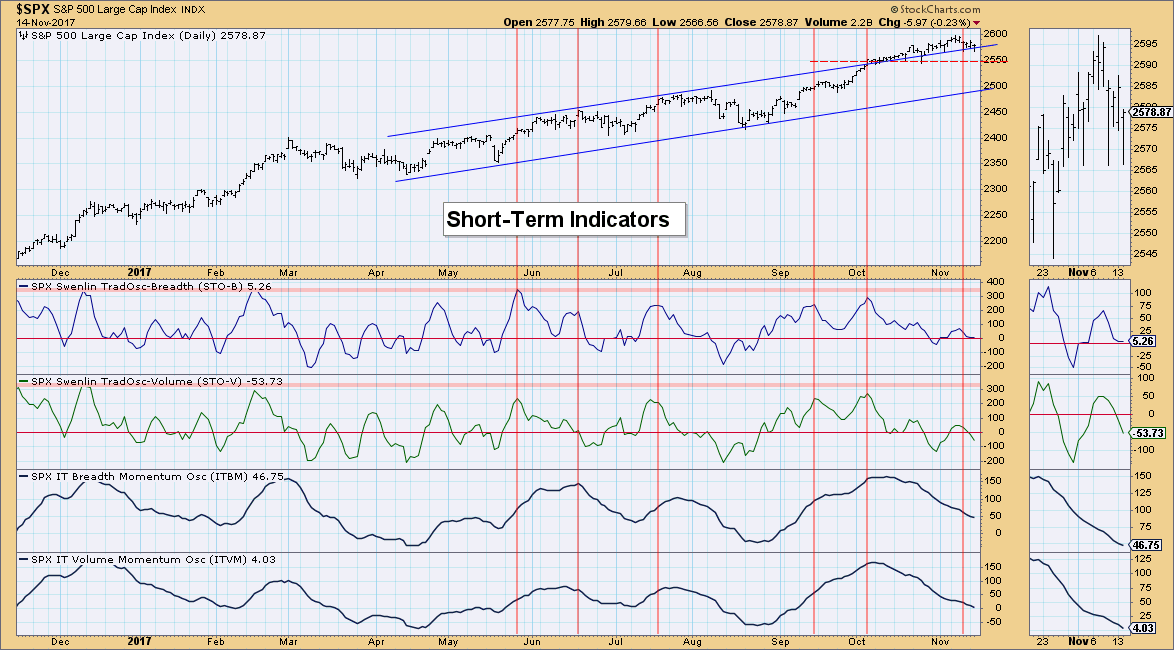
Short-Term Indicators: The remainder of our indicators are quite negative. STOs topped a week or so ago and continue to decline. I've included the IT indicators in the lower windows to give you a view of what is happening with them in their oscillation. Obviously what we want to see is both bottoming and rising at the same time. The pivotal moves typically occur at coincident bottoms. We're not there yet.
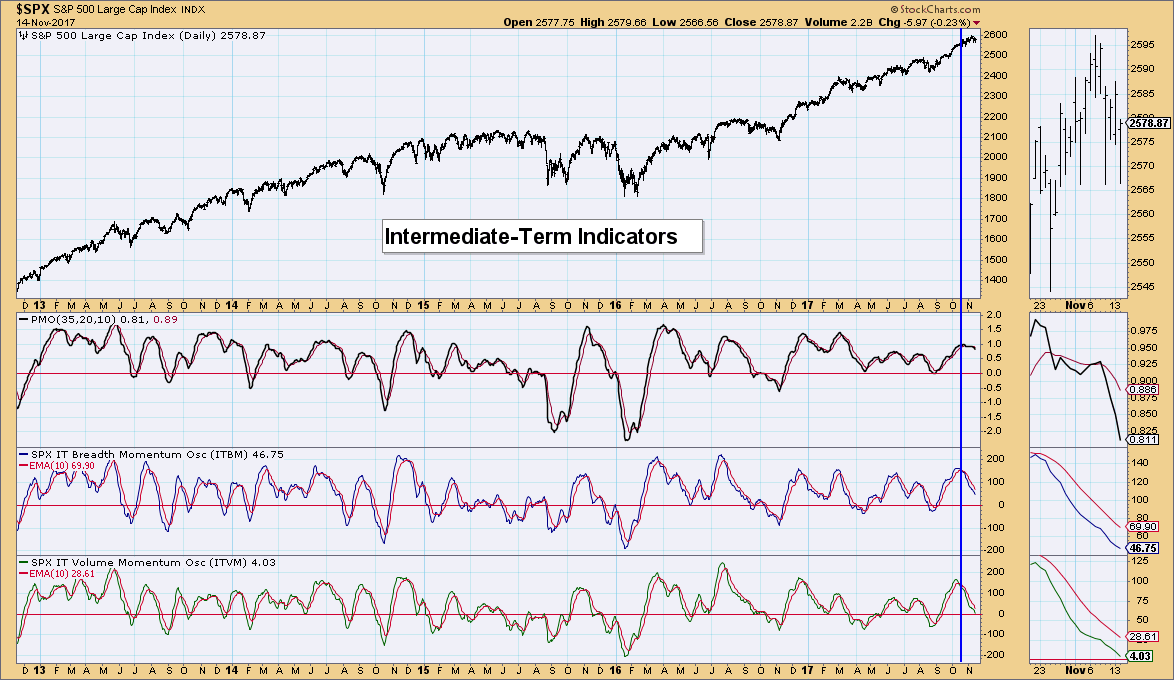
Intermediate-Term Indicators: The decline and lack of deceleration is clear on not only the PMO but the ITBM and ITVM. They are reaching neutral territory but appear to have no interest in decelerating, let alone bottoming. I would expect to see more difficulties in the market, although not a correction. Those seem to have become extinct since November 2016.
Conclusion: We should see a bit of a rally pop tomorrow or Thursday based on VIX readings moving outside the lower Bollinger Band. However, short and intermediate-term indicators are configured very bearishly, so I would expect to see more consolidation or possibly a pullback to October lows.
DOLLAR
IT Trend Model: BUY as of 10/23/2017
LT Trend Model: SELL as of 05/24/2017
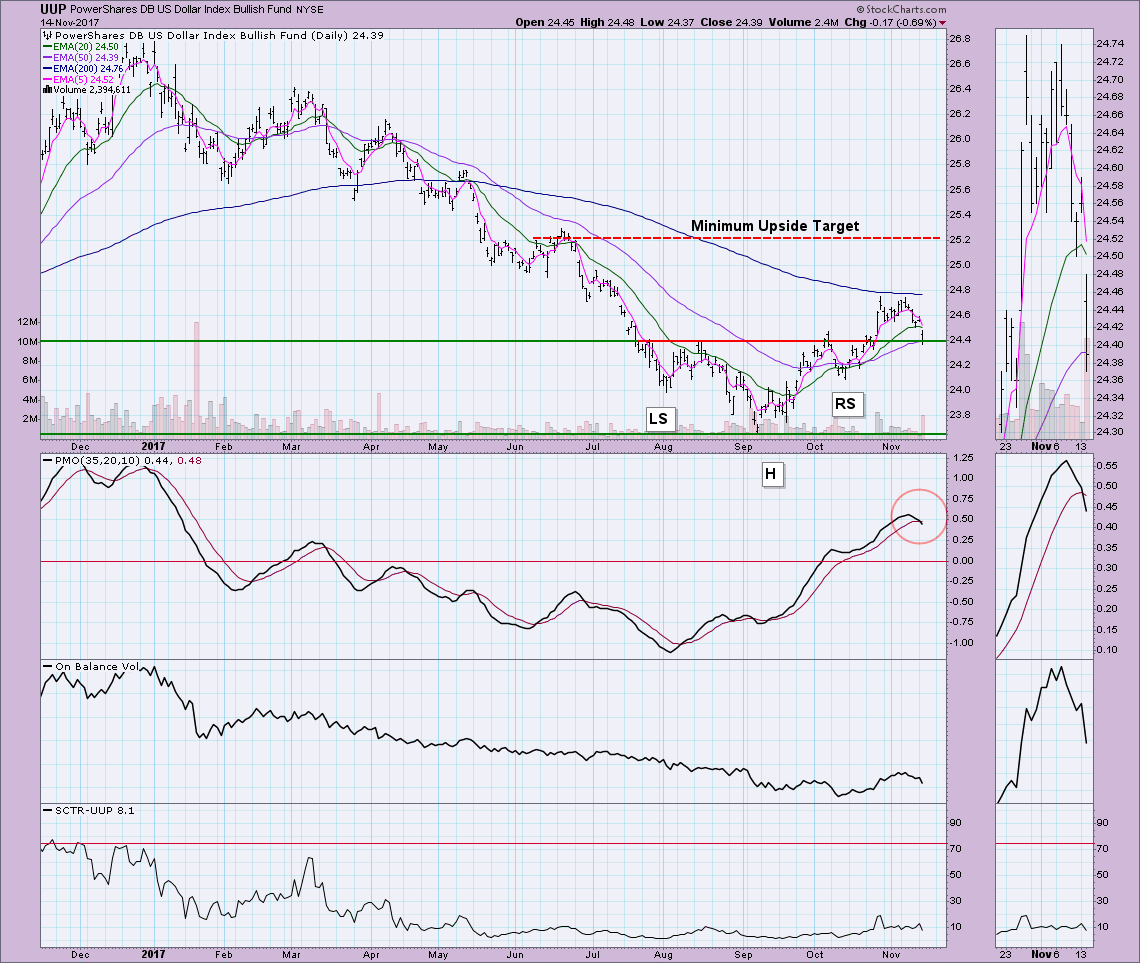
The Dollar has just about busted the near "textbook" reverse head and shoulders. Just goes to show you, they don't always execute, even when they have a textbook set-up. Today's PMO SELL signal was triggered on the gap down decline in UUP. Based on the PMO I have to believe we're going to see a breakdown below the neckline to officially bust the pattern.
GOLD
IT Trend Model: NEUTRAL as of 10/20/2017
LT Trend Model: BUY as of 4/12/2017
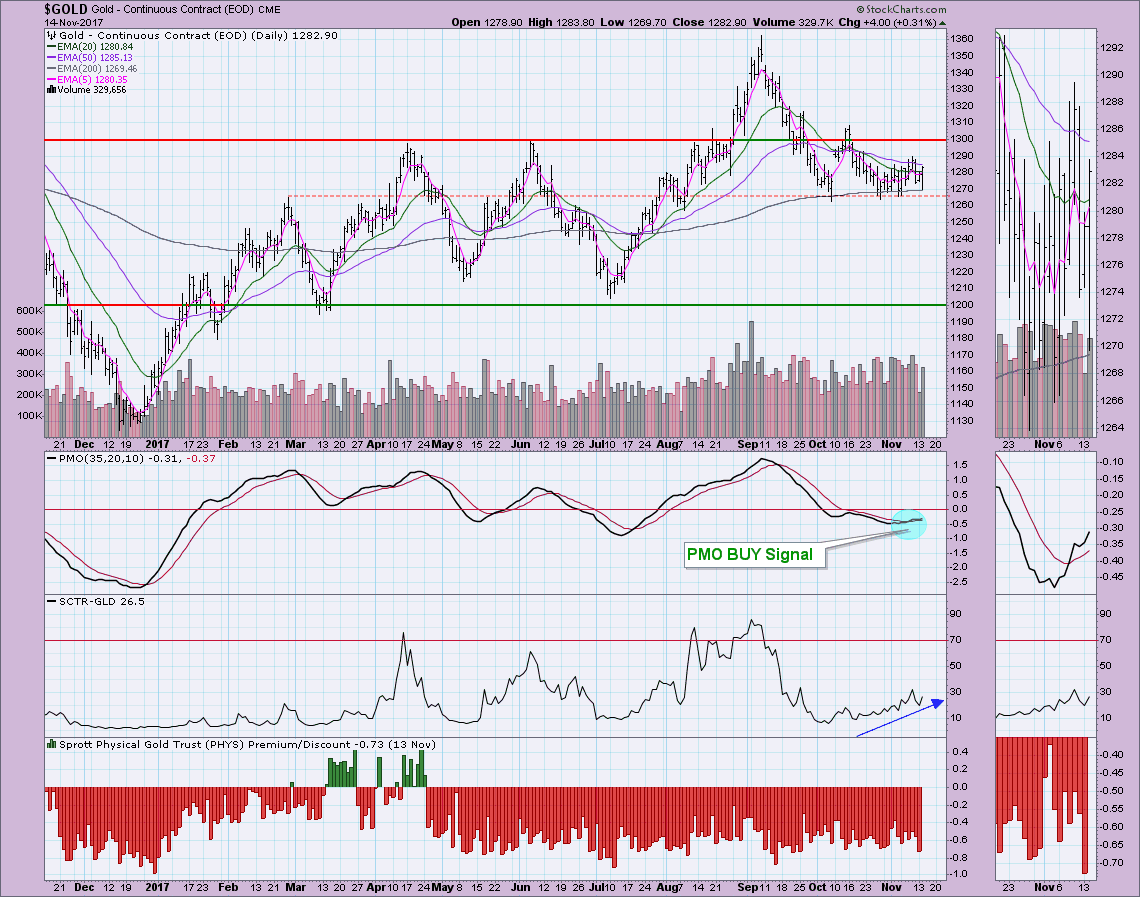
Well if the Dollar is weak, I have to look at bullish possibilities for Gold. Many have asked me during the MarketWatchers LIVE show why I haven't been bullish on Gold. One thing that bothers me on this chart is the clear negative divergence between PMO bottoms and price bottoms. The PMO had actually turned down yesterday. However, I have to say that this level of support has been rock solid and the PMO has turned back up. Notice the bump on discounts today, that implies the sentiment on Gold is bearish. The more bearish Gold investors are, the more likely Gold is in for a rally. I can't get behind a big rally, but a move to at least test the 1300 level is plausible.
CRUDE OIL (USO)
IT Trend Model: BUY as of 11/2/2017
LT Trend Model: BUY as of 9/7/2017
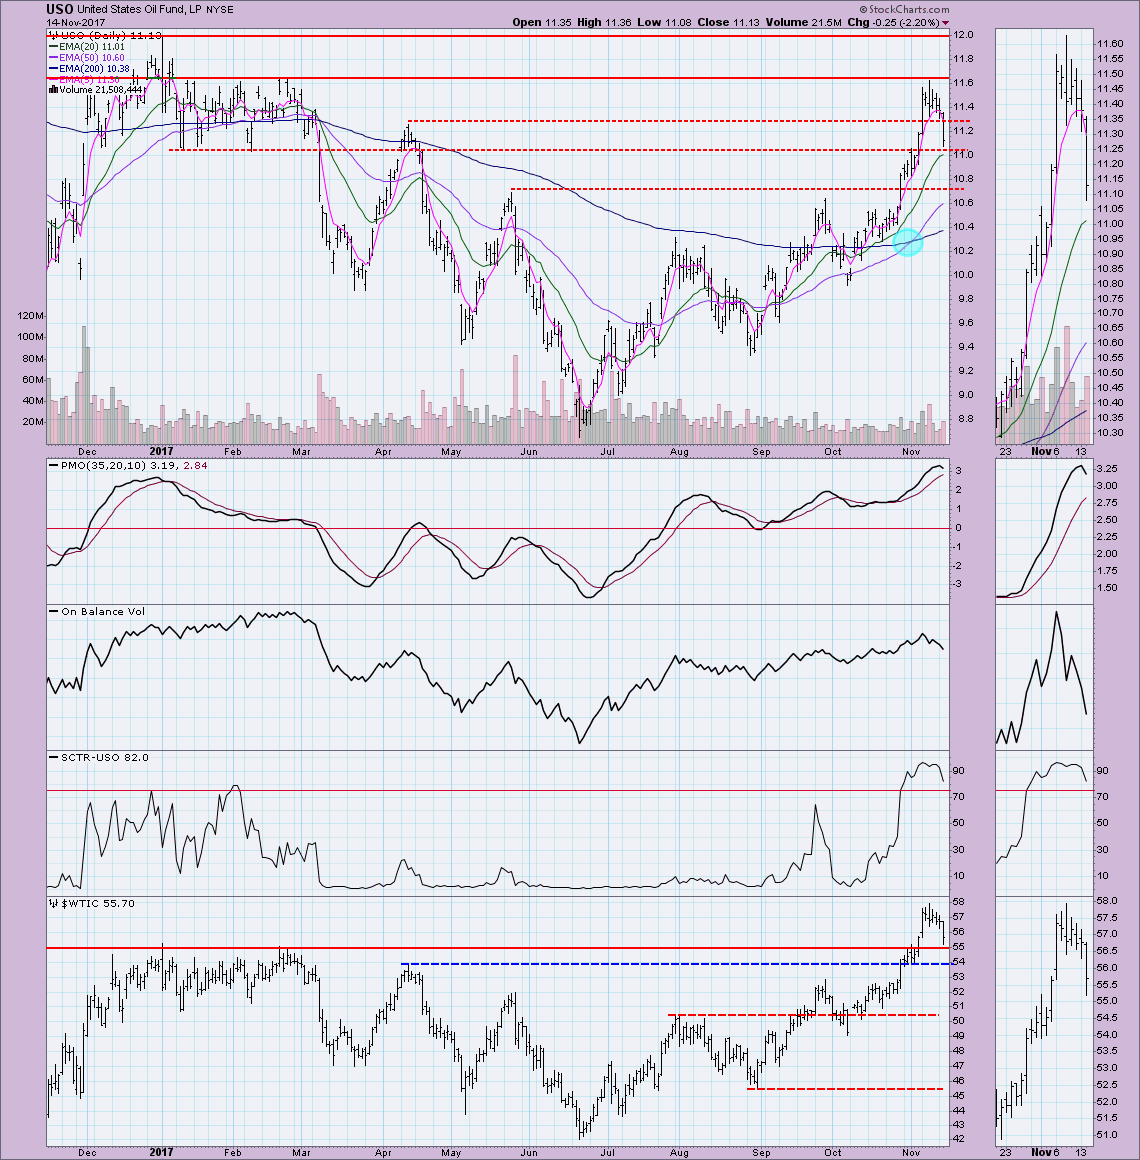
Oil has been busting through line after line of overhead resistance, but USO was finally stopped at the $11.60 level and has declined since. Today, it took out support at the April high. The PMO has topped in very overbought territory. It's time for a correction or more pullback.
BONDS (TLT)
IT Trend Model: Neutral as of 10/5/2017
LT Trend Model: BUY as of 6/16/2017
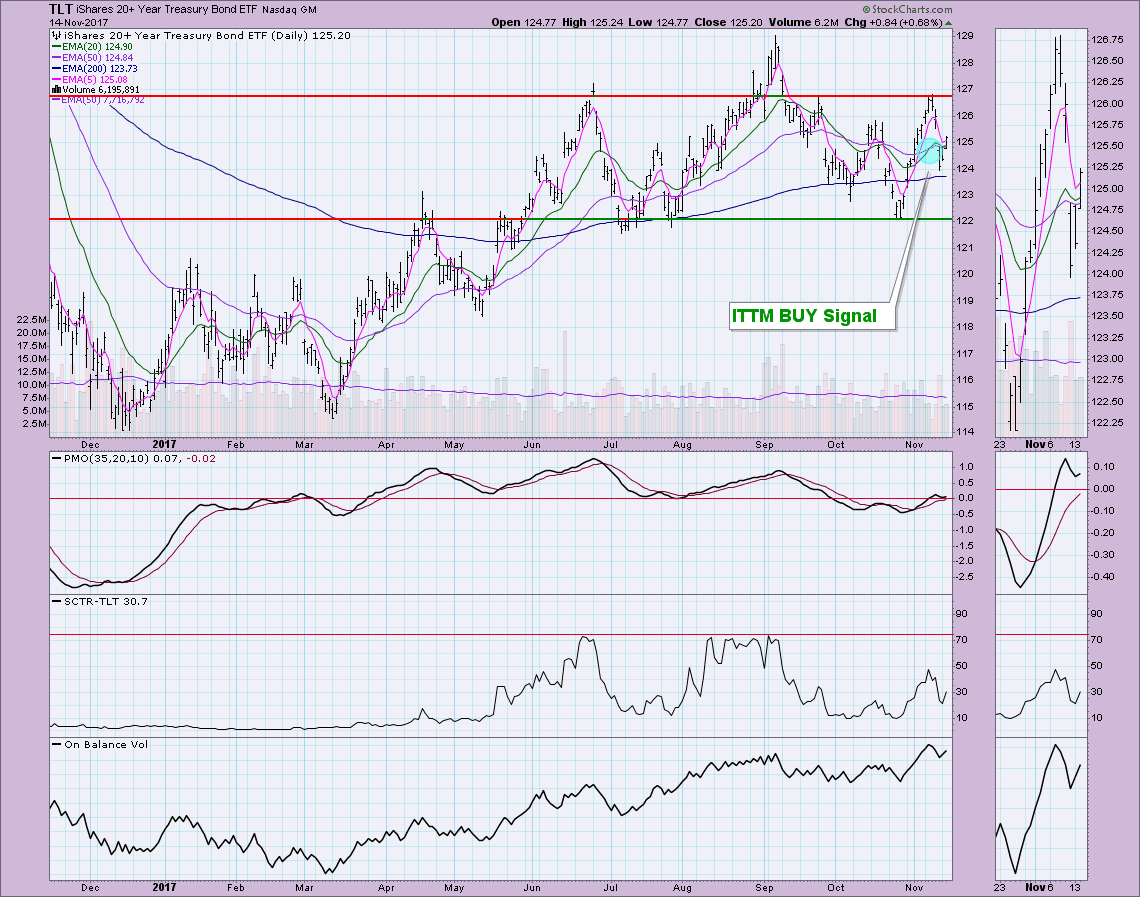
After receiving a new ITTM BUY signal, TLT promptly gapped down. The IT Trend Model BUY signal remains intact and now that price has gotten back above the 20/50-EMAs, it should stay protected. The PMO has turned back up which is also encouraging.
Helpful DecisionPoint Links:
DecisionPoint Shared ChartList and DecisionPoint Chart Gallery
Price Momentum Oscillator (PMO)
Swenlin Trading Oscillators (STO-B and STO-V)
Technical Analysis is a windsock, not a crystal ball.
Happy Charting!
- Erin
**Don't miss DecisionPoint Commentary! Add your email below to be notified of new updates"**

