I should probably watch less business news, but I only have it on to catch any big news developments, and the sound is usually off. Nevertheless, I can't avoid some stuff that I'd rather filter out. For example, there was talk on Thursday and Friday about whether investors should be "buying the dip." To clarify, the distance from Tuesday's intraday all-time high to Thursday's intraday low was -1.2%. The distance from Wednesday's all-time closing high to Thursday's close was -0.4%. In my experience, that ain't a dip, but the discussion shows how rose-colored the crowd's view has become.
The DecisionPoint Weekly Wrap presents an end-of-week assessment of the trend and condition of the stock market (S&P 500), the U.S. Dollar, Gold, Crude Oil, and Bonds.
STOCKS
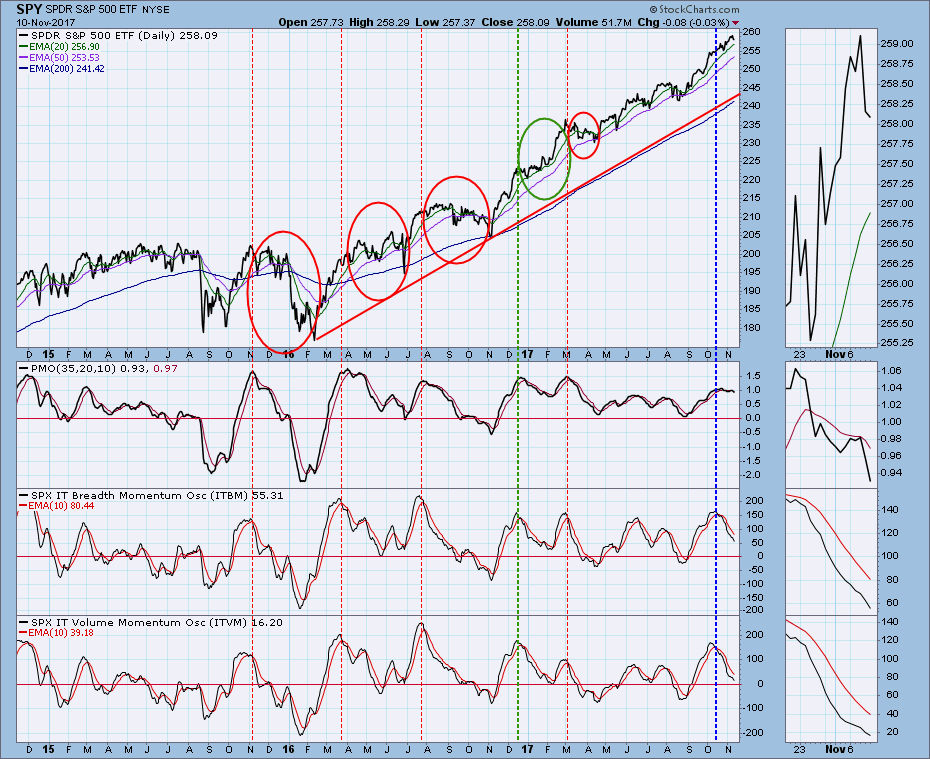
IT Trend Model: BUY as of 11/15/2016
LT Trend Model: BUY as of 4/1/2016
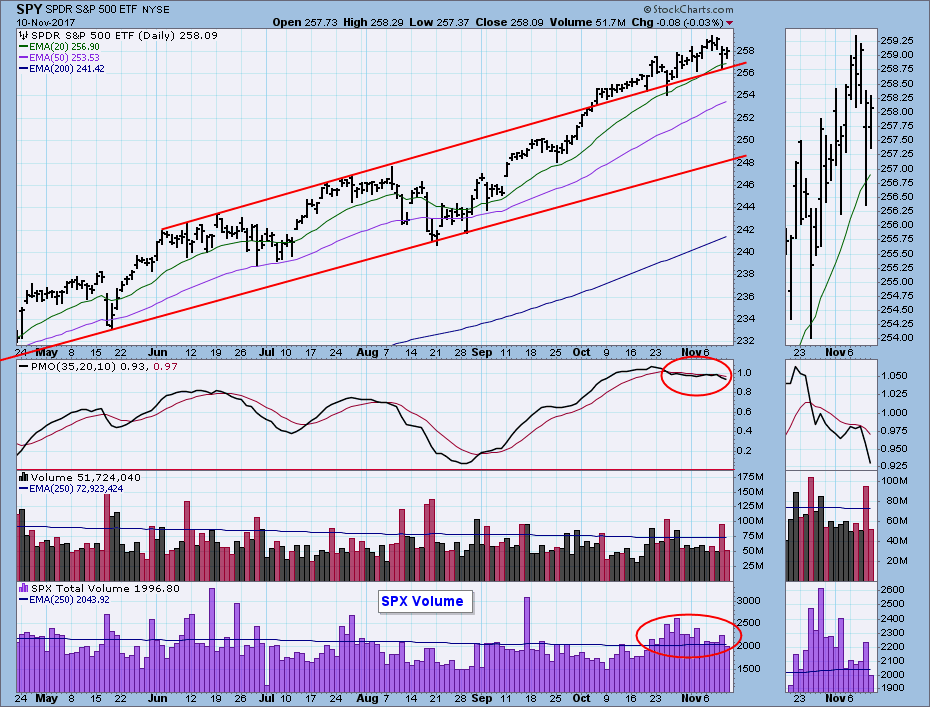
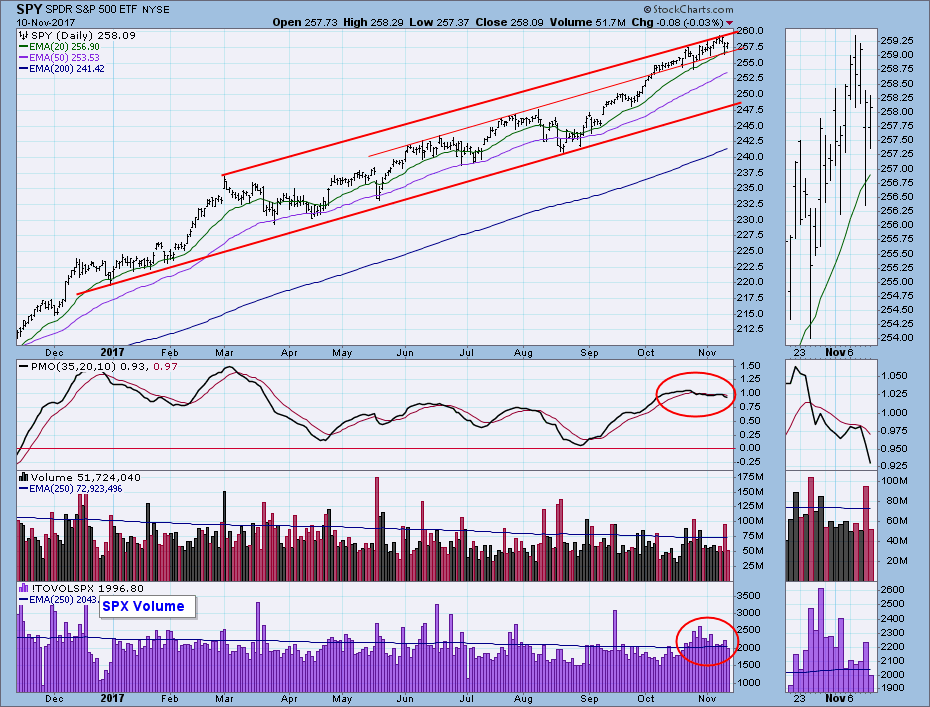
Daily Chart: This week's minor pullback did virtually no technical damage. The daily PMO dipped a little on Friday, but the month-long, flat configuration conveys how bullish the market remains. Yes, the PMO is flat, but it is well above the zero line. Flat means that the rate-of-change is very steady, and the solidly positive reading means that the trend is up. While this is obvious by looking at the price chart, I thought it would be useful to explain what the flat PMO meant. Higher than normal S&P 500 volume continued this week, and I still interpret it as distribution ahead of a top.
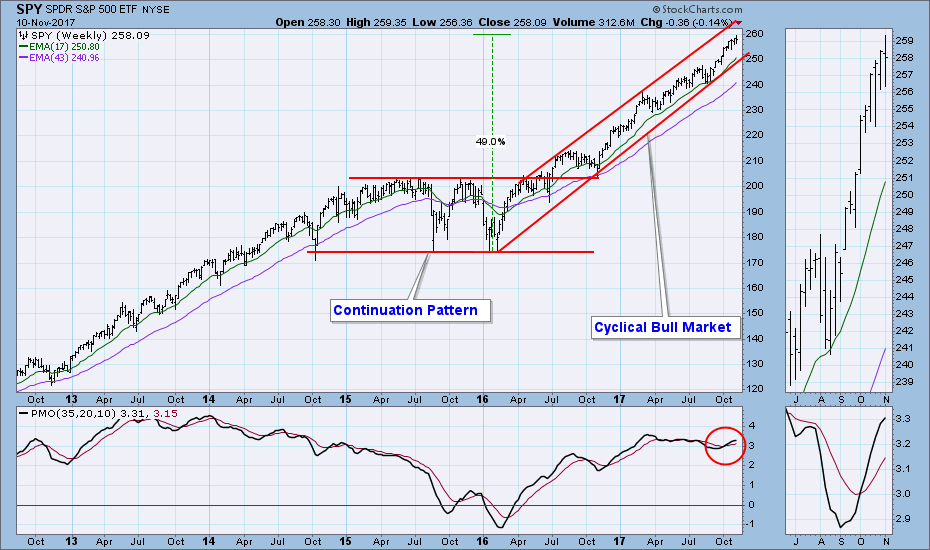
Weekly Chart: The cyclical bull market has advanced +49% so far, and there is not really anything on this chart that gives me heartburn.
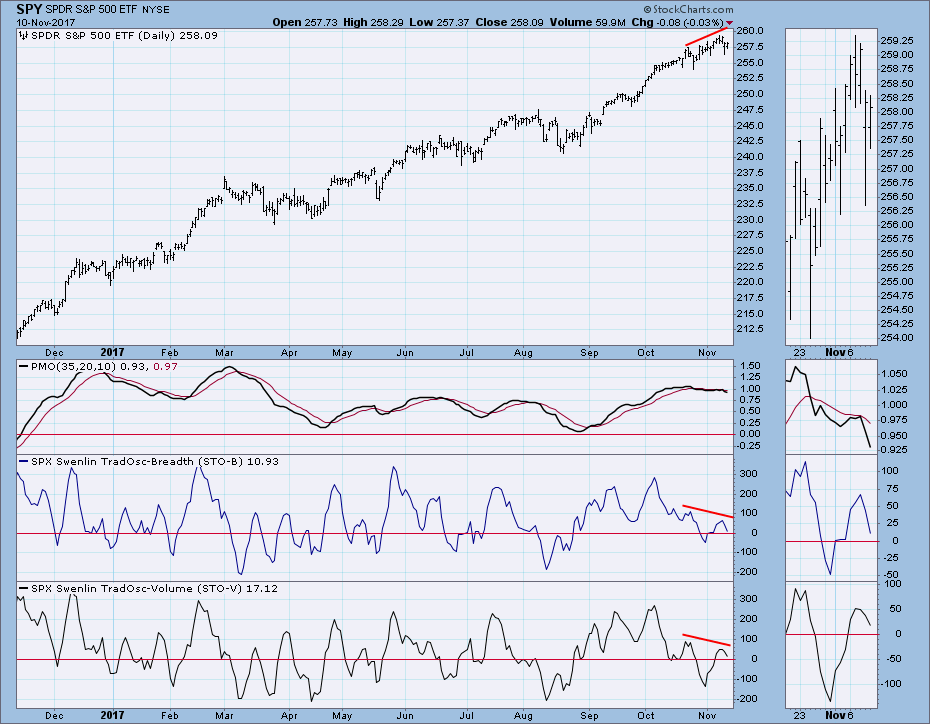
Short-Term Market Indicators: There are some negative divergences visible, and the daily PMO has topped below the signal line.
Intermediate-Term Market Indicators: Typically (but not always), after these indicators top, a period of corrective action takes place. The indicators topped in October, and we are still waiting for a downside reaction.
Conclusion: I have mentioned the things on the charts that bother me, but over all I don't see any major technical problems. Weakness isn't showing in market action. For example, this week we had a selloff that lasted less than a day and resulted in minuscule losses, and this is typical of what we have seen all this year. It's not going to last forever, so be sure to have an exit strategy planned.
Afterthought: In the last few weeks Neil Cavuto (Fox Business) has had some of the old-time technicians on his show -- Robert Prechter and Peter Eliades. It has been interesting because they are technicians, but you don't normally hear from these guys unless you are one of their subscribers. To cut to the chase, both of them are looking for a major market top soon (weeks to months?). I don't disagree with them for no other reason than that it has been so long since there has been a major bear market. On top of this is the fact that John Mauldin, a brazenly unapologetic economist and fundamental analyst (just kidding), who normally is quite sanguine in his belief that the market will "muddle through," has expressed major concerns about the fate of the market. It seems that there is a growing sense of dread. All-in-all these thoughts may not have any "redeeming social value," but they were on my mind and I thought I would share them with you.
DOLLAR (UUP)
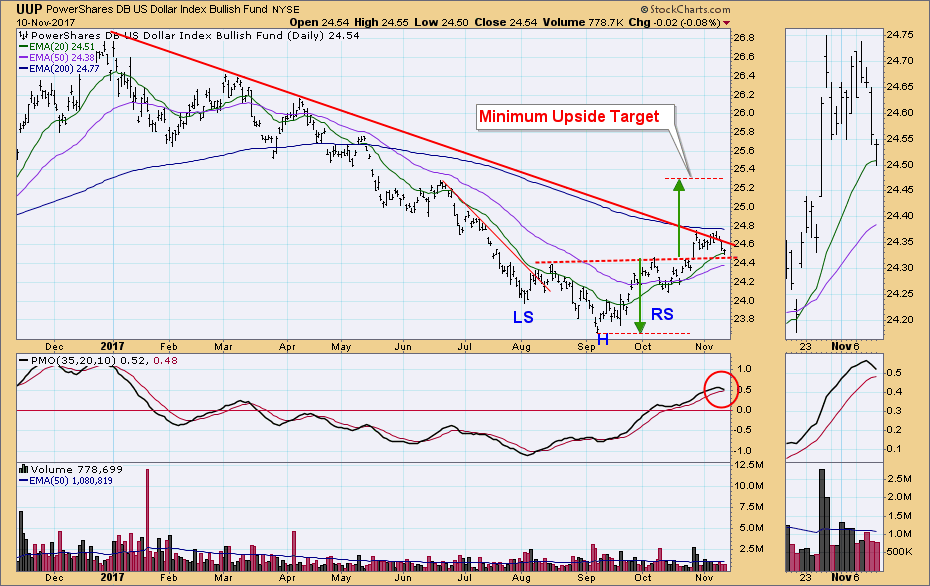
IT Trend Model: BUY as of 10/23/2017
LT Trend Model: SELL as of 5/24/2017
Daily Chart: UUP has coincidentally been stalled by the declining tops line and the 200EMA. In the process it has moved back to the line of support provided by the reverse head and shoulders neckline. Friday's price bar gives the impression that the pullback is over, and that resistance will probably be attacked again next week.
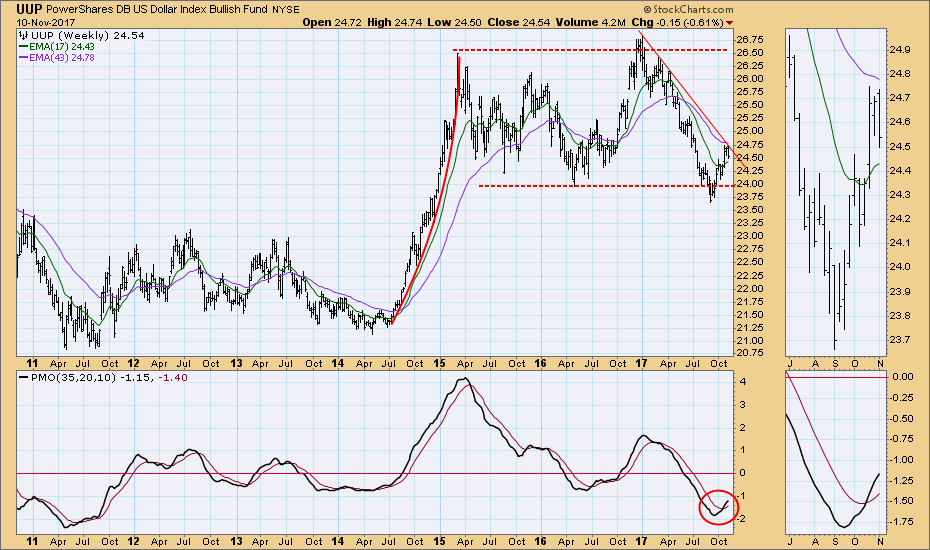
Weekly Chart: The weekly PMO has the best looking bottom seen in seven years, and it bodes well for the upside possibilities.
GOLD
IT Trend Model: NEUTRAL as of 10/20/2017
LT Trend Model: BUY as of 4/12/2017
Daily Chart: A few days ago gold broke above a declining tops line, and on Friday it snapped back to the point of breakout. Also this week, the PMO formed a rather shallow bottom and crossed up through the signal line. Note that the PMO bottom in the thumbnail is not so shallow due to the magnification, but on the main chart we like to see PMO bottoms more like the one in July.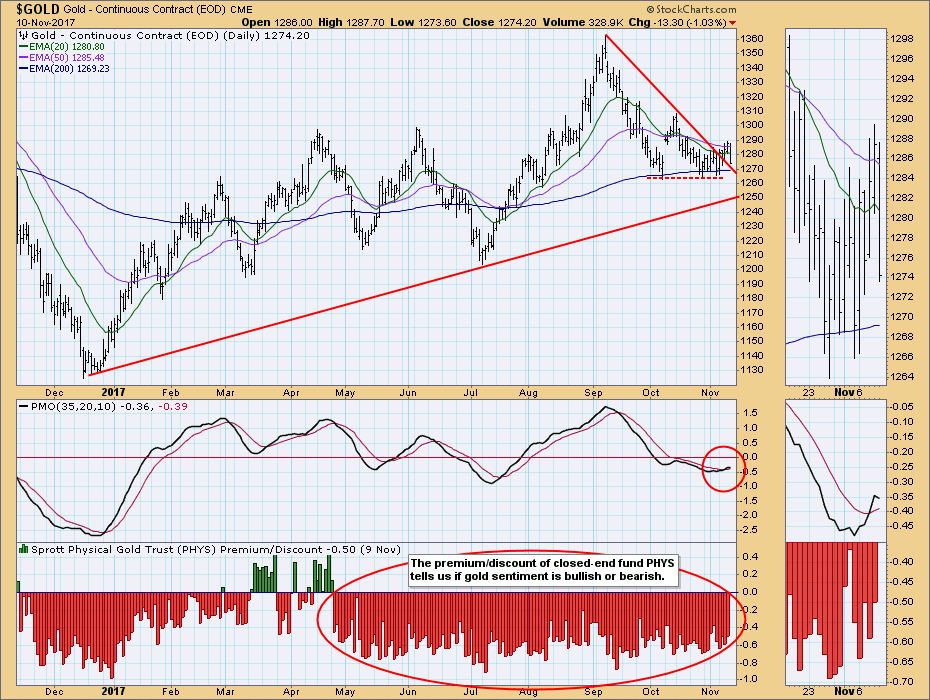
Weekly Chart: In this time frame gold looks positive, but I really want to see the 2016 top taken out with a strong move to officially establish a long-term rising trend.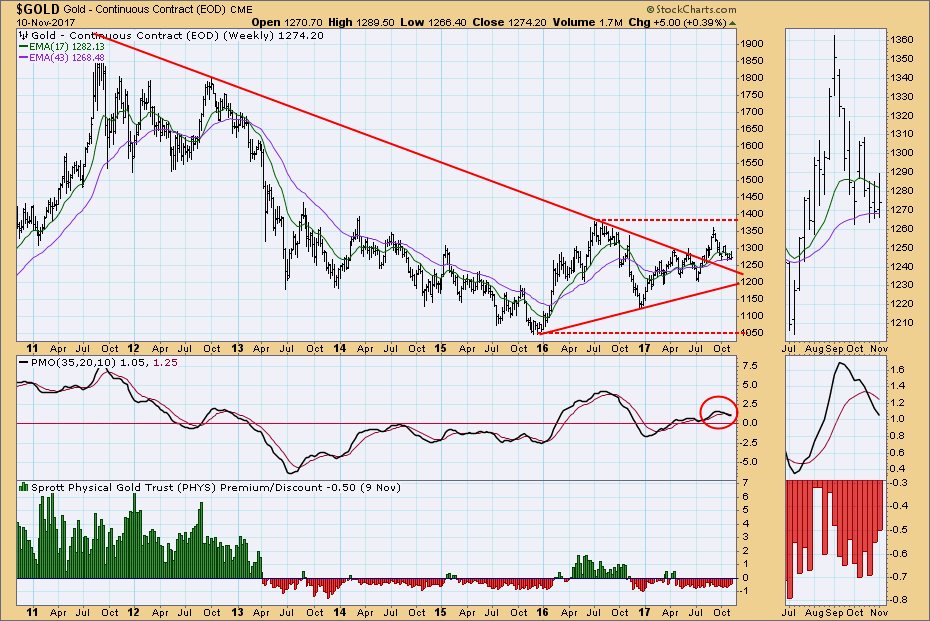
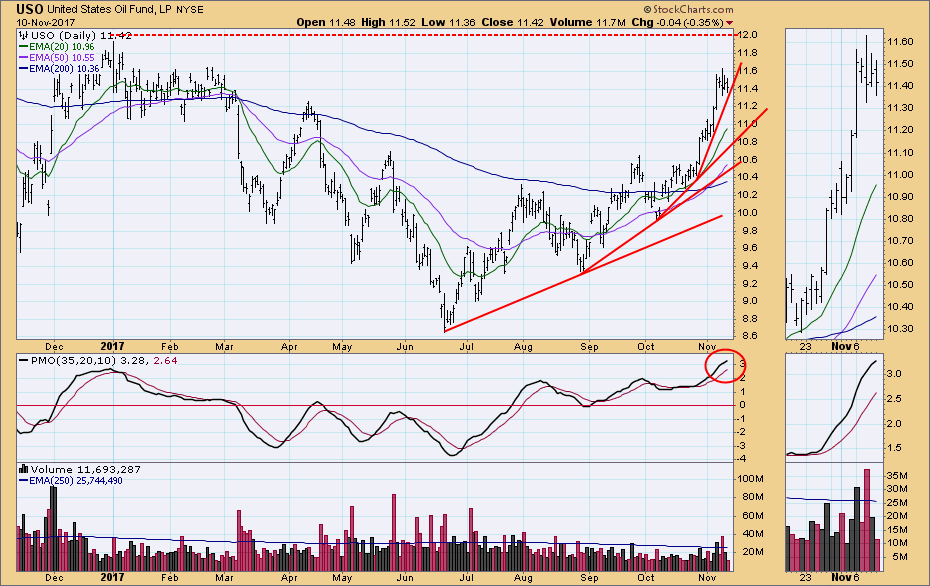
CRUDE OIL (USO)
IT Trend Model: BUY as of 9/6/2017
LT Trend Model: BUY as of 11/2/2017
Daily Chart: Political upheaval in Saudi Arabia has spurred a rapid advance in oil prices -- note the presence of ever-accelerating rising trend lines, which identify a short-term parabolic rise. Parabolic rises can't be sustained, although, it is not easy to determine where they will finally run out of steam. The PMO is overbought, and there is overhead resistance at 12.00, so that would be a reasonable upside target.
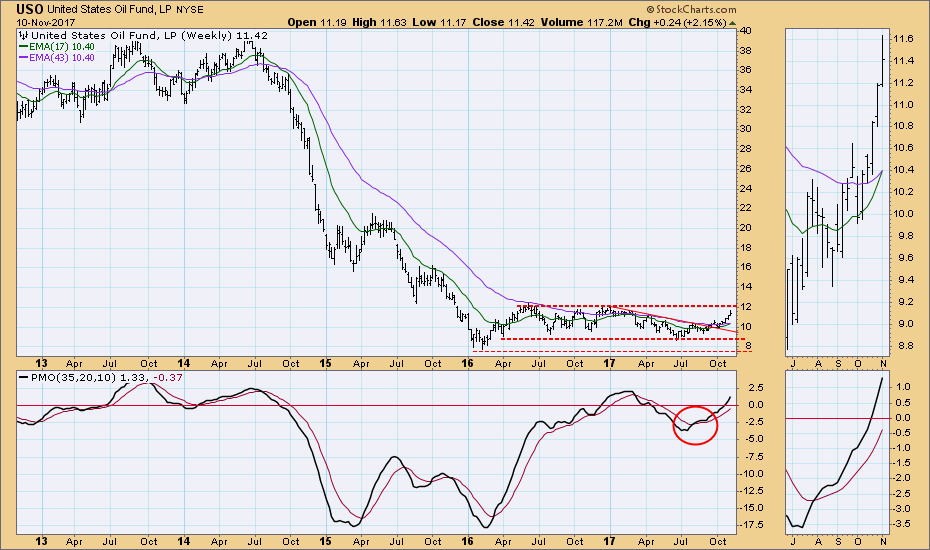
Weekly Chart: USO is reaching the top of the trading range, and the weekly PMO is reaching a level that earlier this year proved to be overbought.
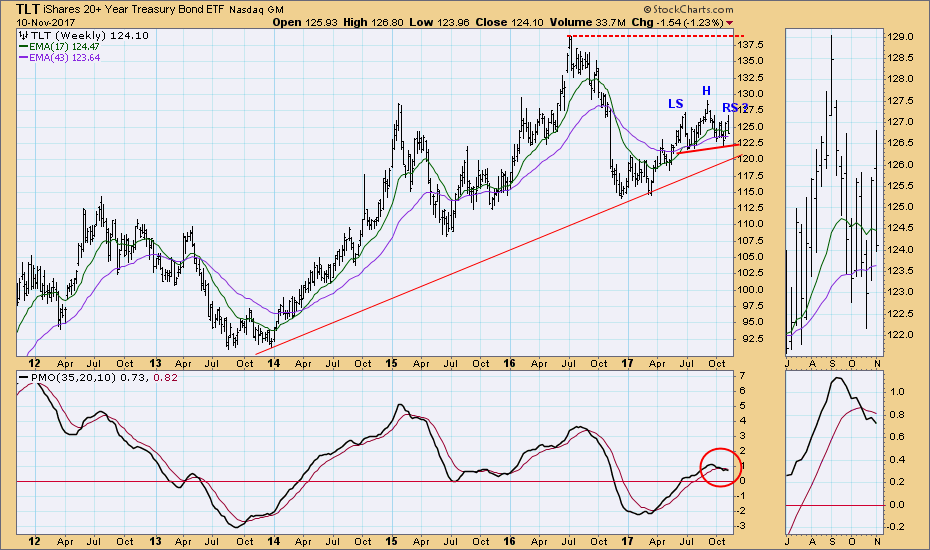
BONDS (TLT)
IT Trend Model: BUY as of 11/8/2017
LT Trend Model: BUY as of 6/16/2017
Daily Chart: TLT broke out of the falling wedge, as expected, but this week all those gains were erased. Falling wedges will usually resolve bullishly, but the breakout doesn't necessarily mean that the trend will turn up. Here is a case where the wedge expectation was met, but continued upside seems improbable.
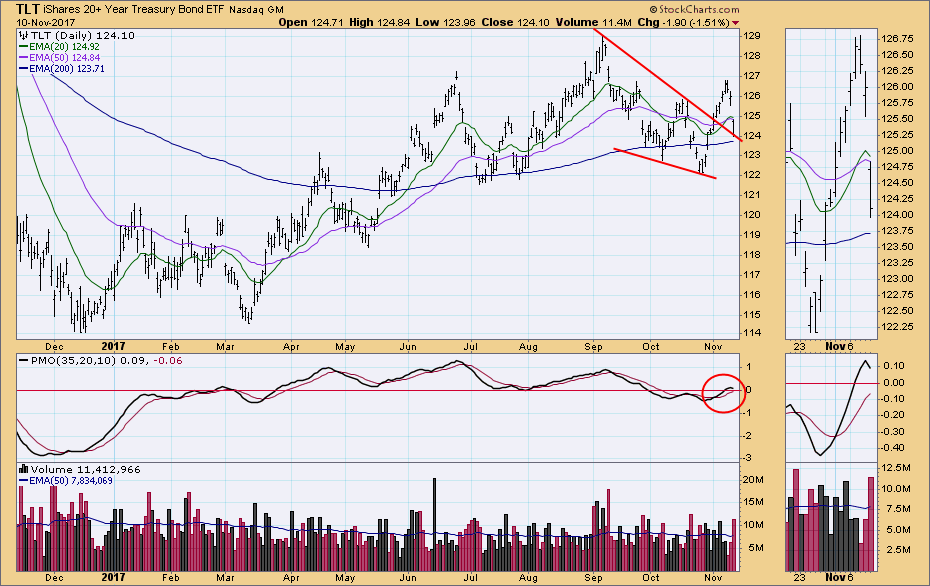
Weekly Chart: A week or two ago I speculated that a head and shoulders pattern was developing on the weekly chart. This week the weekly PMO turned down below the signal line and TLT closed near its low for the week. And the bearish head and shoulders pattern persists. This technical evidence aligns with the fundamental expectation that interest rates will be going up, which means bond prices will be going down.
**Don't miss any of the DecisionPoint commentaries! Go to the "Notify Me" box toward the end of this blog page to be notified as soon as they are published.**
Technical Analysis is a windsock, not a crystal ball.
Happy Charting!
- Carl
NOTE: The signal status reported herein is based upon mechanical trading model signals, specifically, the DecisionPoint Trend Model. They define the implied bias of the price index based upon moving average relationships, but they do not necessarily call for a specific action. They are information flags that should prompt chart review. Further, they do not call for continuous buying or selling during the life of the signal. For example, a BUY signal will probably (but not necessarily) return the best results if action is taken soon after the signal is generated. Additional opportunities for buying may be found as price zigzags higher, but the trader must look for optimum entry points. Conversely, exit points to preserve gains (or minimize losses) may be evident before the model mechanically closes the signal.
Helpful DecisionPoint Links:
DecisionPoint Shared ChartList and DecisionPoint Chart Gallery
Price Momentum Oscillator (PMO)
Swenlin Trading Oscillators (STO-B and STO-V)


