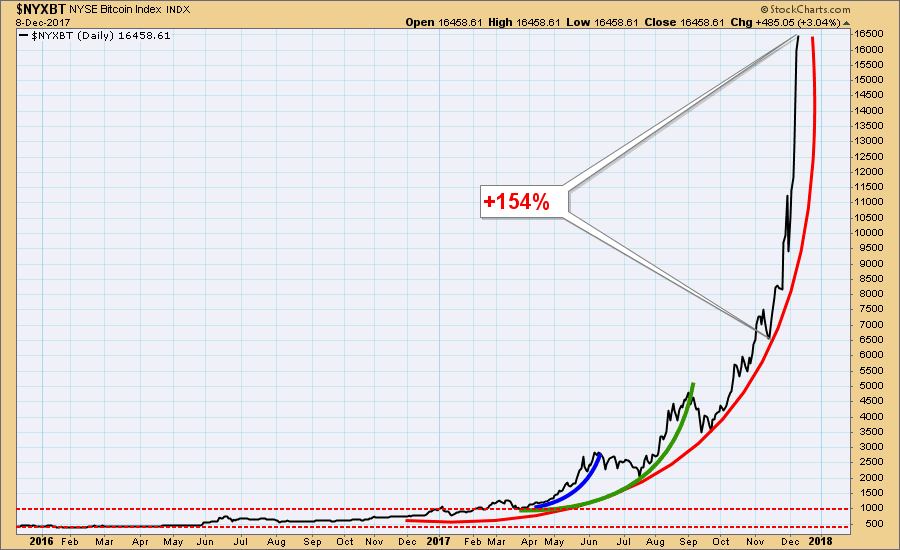
In the DP Weekly Wrap I normally lead with a chart of the market, but this week Bitcoin was so prominent in the news, I thought a chart of the Bitcoin Index would be more appropriate. What we have here is a classic parabolic advance (the red arc), with price moving from about $400 in 2016 to almost $16,000 yesterday. Also impressive is the recent advance of +154% in just under four weeks, but we can see that the advance has become about as vertical as it could possibly be. The message I want to convey is that this kind of chart pattern is extremely dangerous. Yes, price could go higher, but it is also at a point where the parabolic could collapse, and the potential downside is back down to the support of the basing pattern between 400 and 1000.
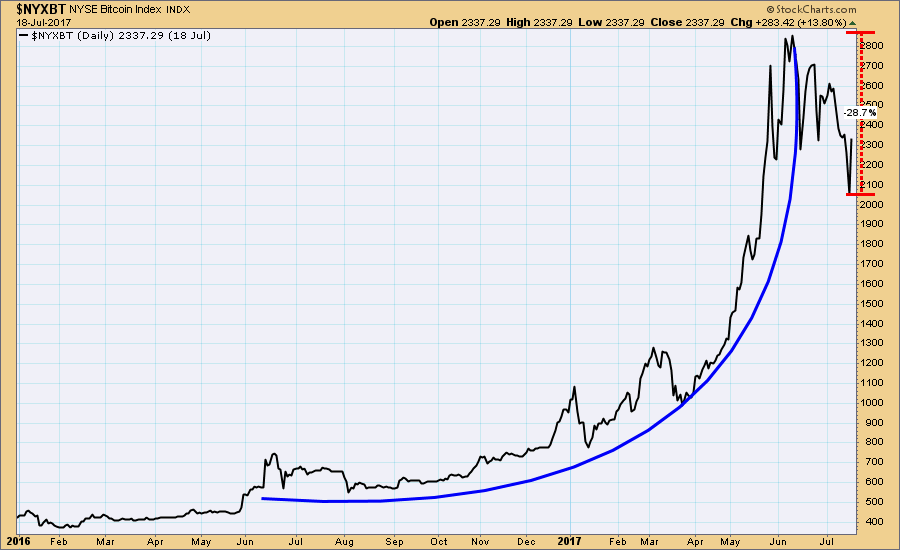
On the above chart you'll notice that there is also a blue arc and a green arc highlighting two parabolic advances that occurred earlier this year. The chart below is a magnification of the blue arc, and in this context it looks pretty extreme. In this case the parabolic didn't collapse, but there was a substantial correction. So, while there is danger of a total collapse from current levels, this is an example of how other outcomes are possible. Bitcoin futures begin trading Sunday.
The DecisionPoint Weekly Wrap presents an end-of-week assessment of the trend and condition of the stock market (S&P 500), the U.S. Dollar, Gold, Crude Oil, and Bonds.
STOCKS
IT Trend Model: BUY as of 11/15/2016
LT Trend Model: BUY as of 4/1/2016
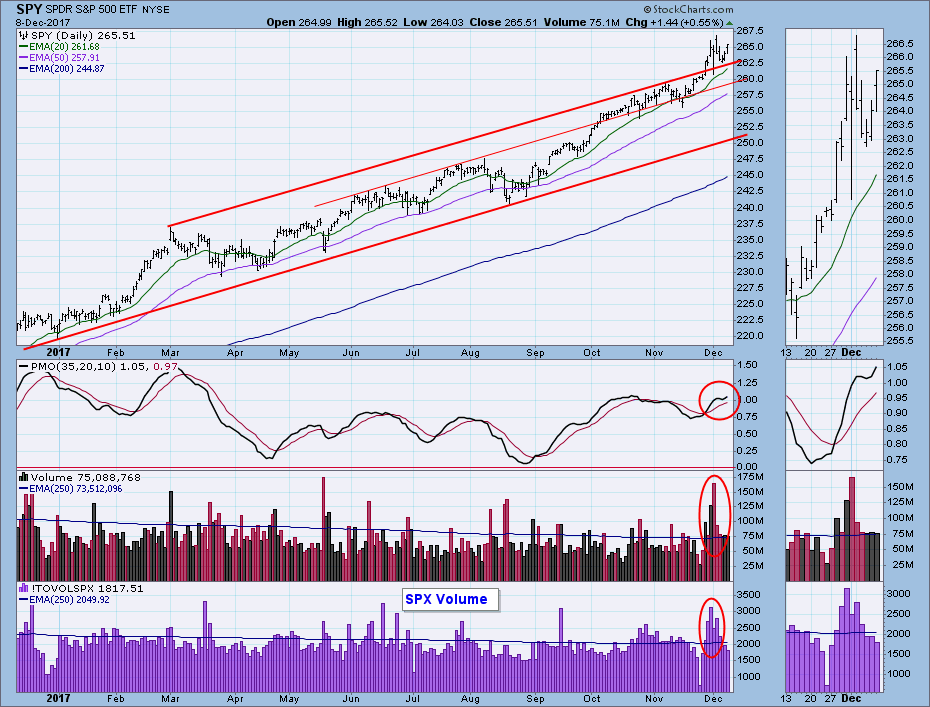
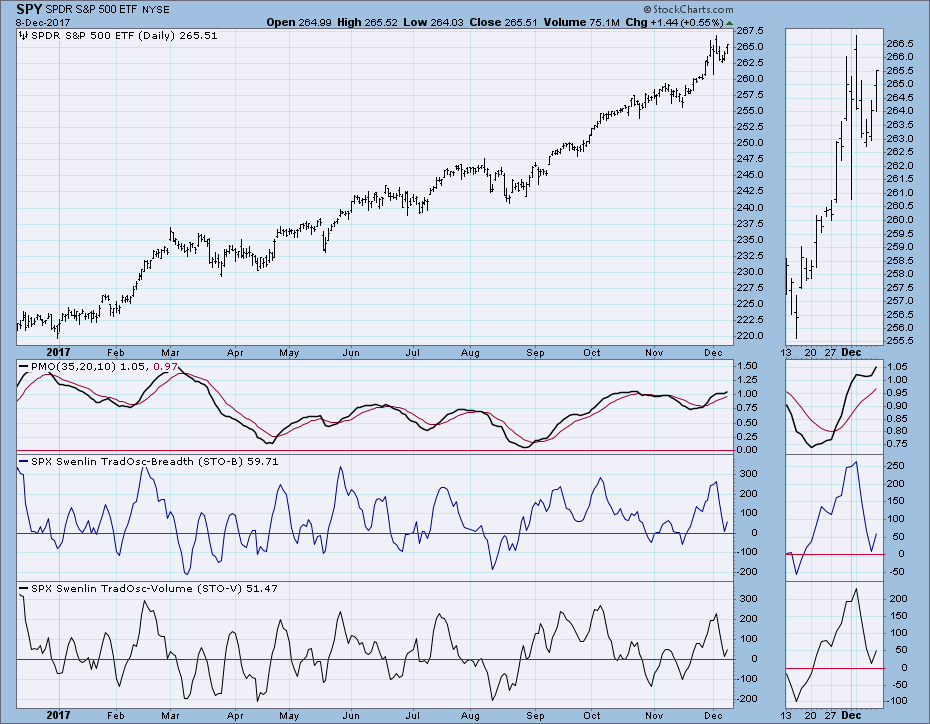
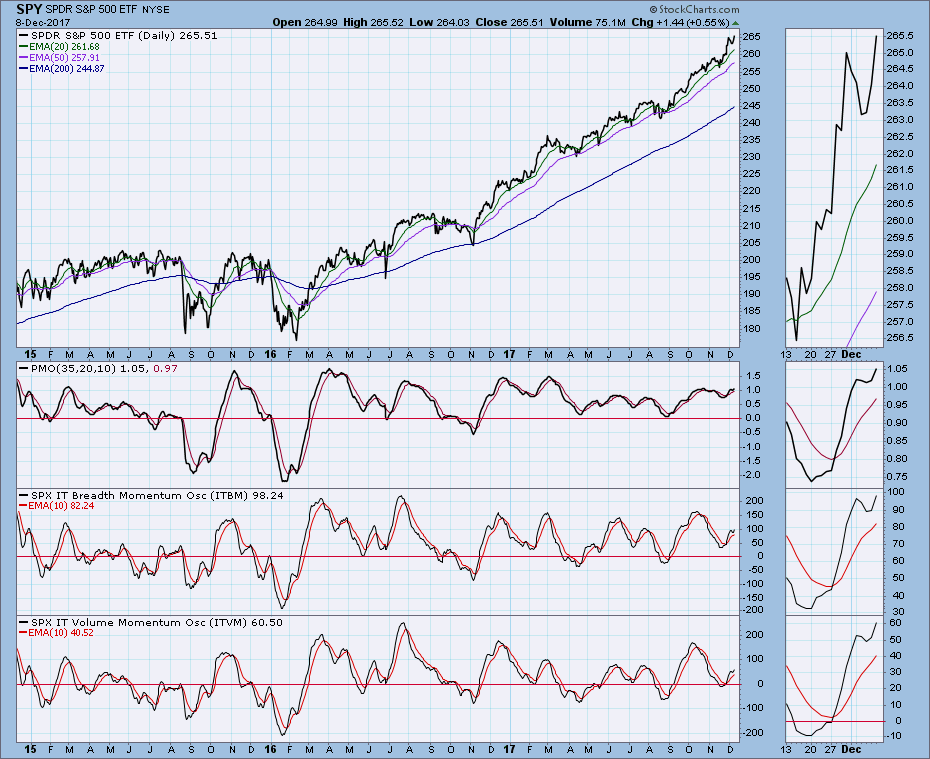
Daily Chart: The market hit a new record intraday high on Monday, then it did a churn the rest of the week. The daily PMO formed a shallow top early in the week, but it quickly turned up again. It would be useful if price would churn for another week or two, but I wouldn't count on it. It isn't easy to see on a bar chart, but Friday's close was a new, all-time closing high.
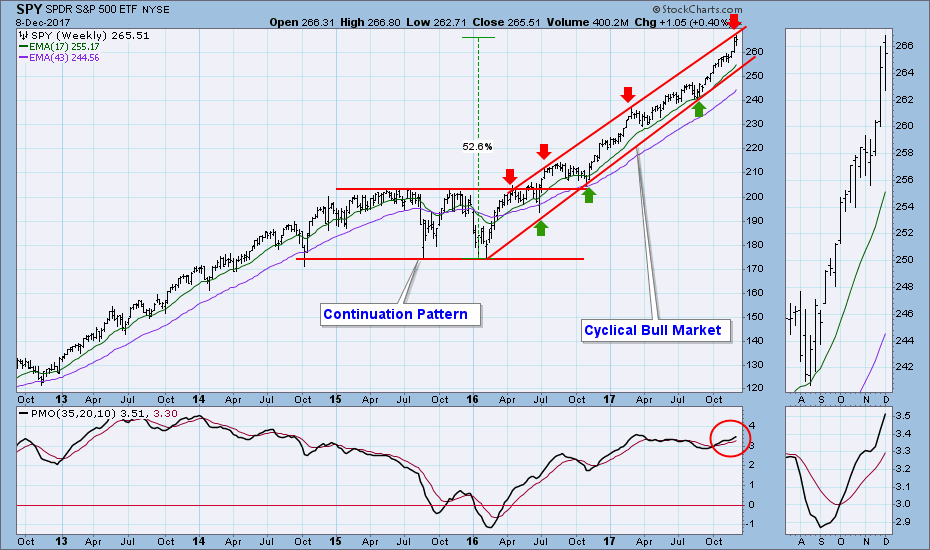
Weekly Chart: SPY has hit the top of the rising trend channel for the fourth time in two years. The line is not inviolate, but it does suggest that upward progress may encounter some headwinds for a while -- price could edge higher along the bottom of the line.
Short-Term Market Indicators: The overbought condition in this time frame cleared quickly this week, and there is now plenty of room internally to accommodate more rally.
Intermediate-Term Market Indicators: These indicators are rising again, and they are about half-way to overbought levels.
Conclusion: I commented last week that the market's angle of ascent was too steep to sustain, and this week there was a small amount of consolidation to relieve the situation somewhat. I know it is very unlikely that we will recognize the final top of the bull market on the day it happens, but at this point I don't really see any problems for the market on the charts. I still think we're good for the rest of the year.
DOLLAR (UUP)
IT Trend Model: SELL as of 11/30/2017
LT Trend Model: SELL as of 5/24/2017
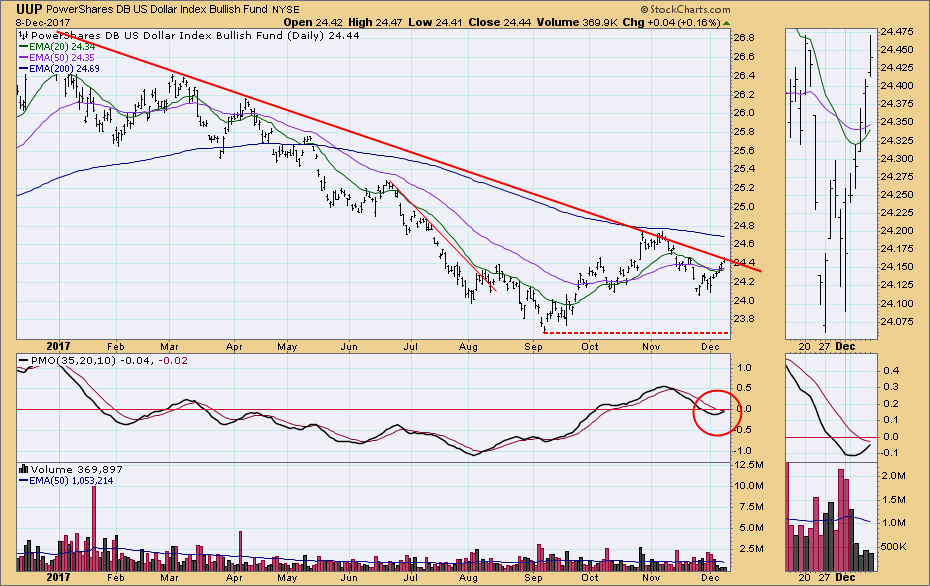
Daily Chart: The daily PMO has formed a nice smooth bottom and is approaching the signal line. Price is currently challenging the declining tops line, and a breakout seems likely.
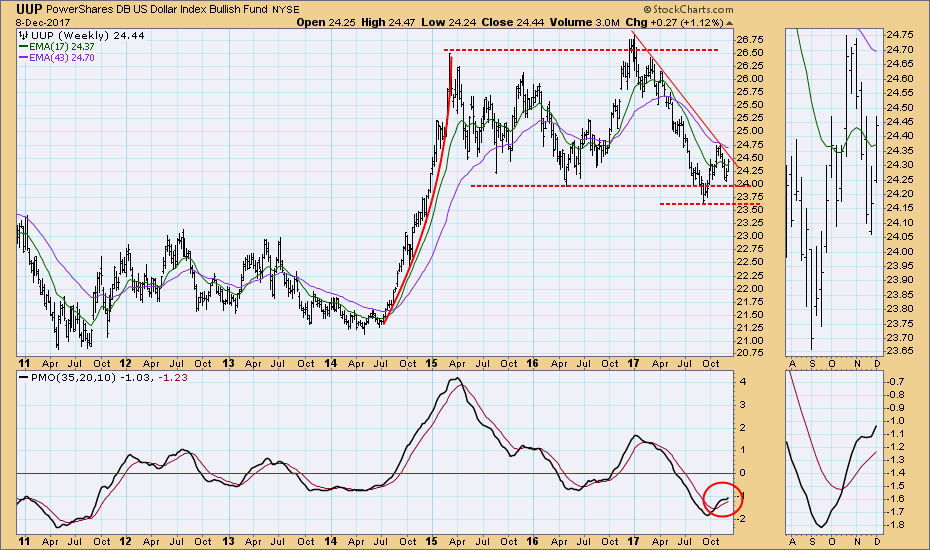
Weekly Chart: The weekly PMO had topped last month, but it turned up sharply this week. Price bottomed just above the first support line, and it looks poised to break through the declining tops line.
GOLD
IT Trend Model: NEUTRAL as of 10/20/2017
LT Trend Model: BUY as of 4/12/2017
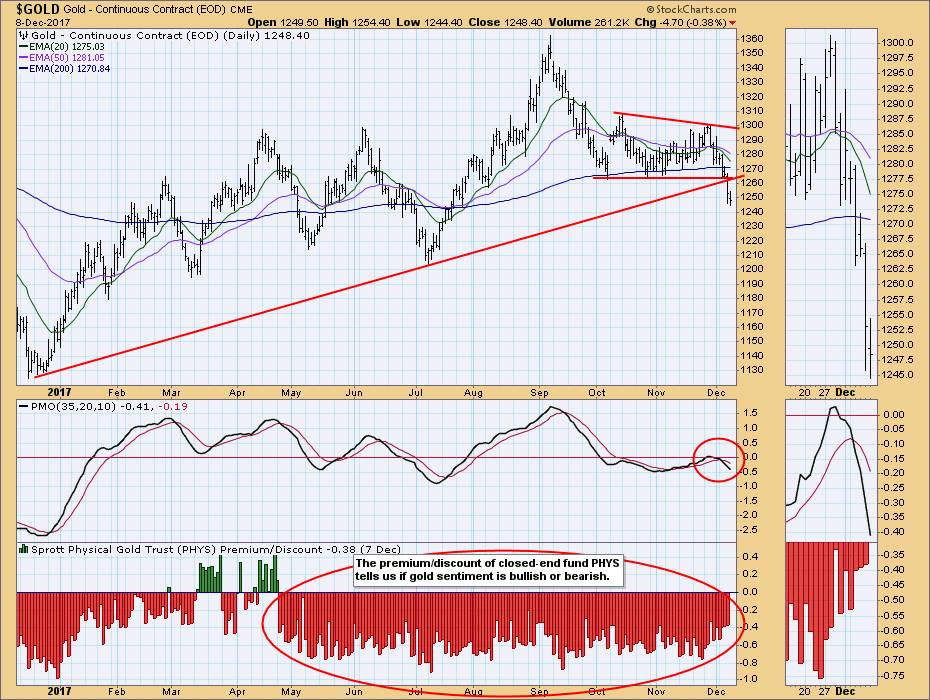
Daily Chart: Gold reached intersecting lines of support and sliced right through them. The daily PMO has topped and has crossed below the signal line. Even though the IT Trend Model is NEUTRAL, this chart is bearish.
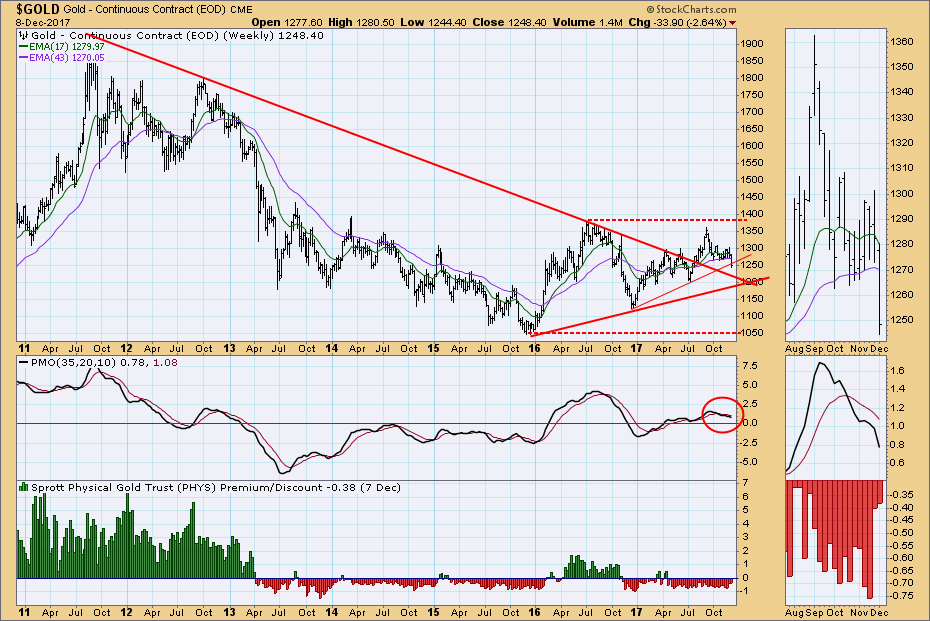
Weekly Chart: We can see that gold is approaching two very important lines of potential support. If the declining tops line drawn from the 2011 top fails, we'd have to consider that a new bear market was beginning.
CRUDE OIL (USO)
IT Trend Model: BUY as of 9/6/2017
LT Trend Model: BUY as of 11/2/2017
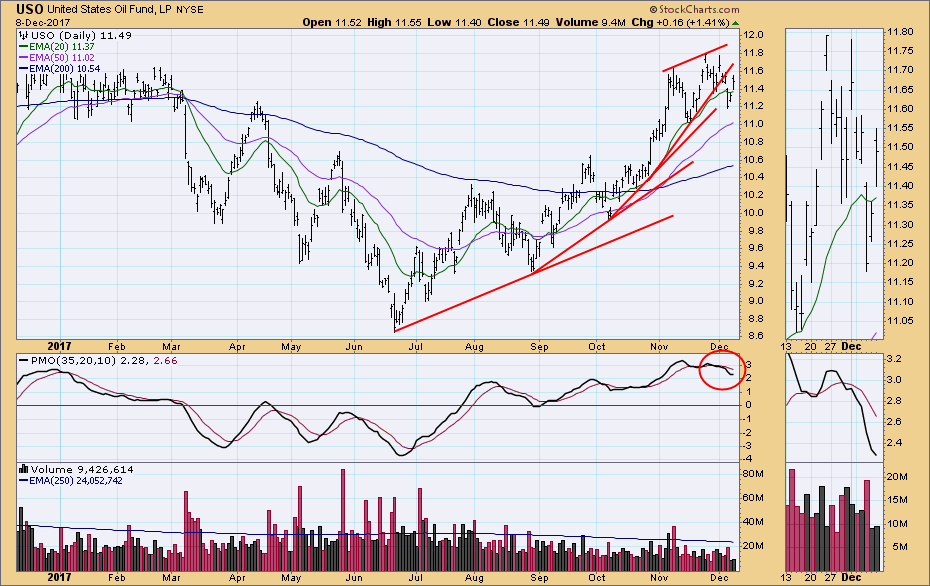
Daily Chart: This week the rising wedge resolved downward as expected, but already price is moving back up. I can't say for sure if the rally will continue, but this chart shows a good example of how a downward resolution of a rising wedge doesn't necessarily mean that a new down trend will begin.
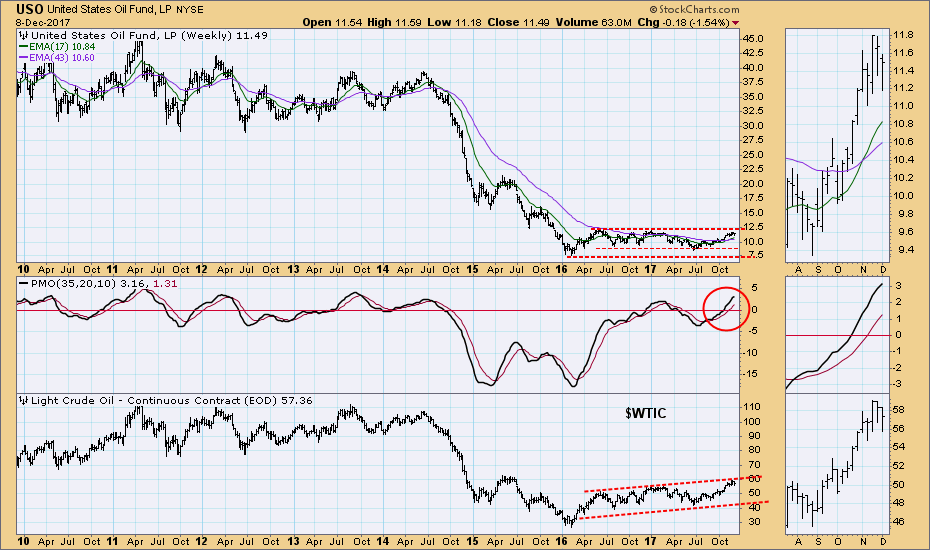
Weekly Chart: I think there is a good chance that USO's rally has run its course. It has reached the top of its trading channel, as has $WTIC. Also, the weekly PMO is at a level that has proven to be overbought for the last eight years.
BONDS (TLT)
IT Trend Model: BUY as of 11/8/2017
LT Trend Model: BUY as of 6/16/2017
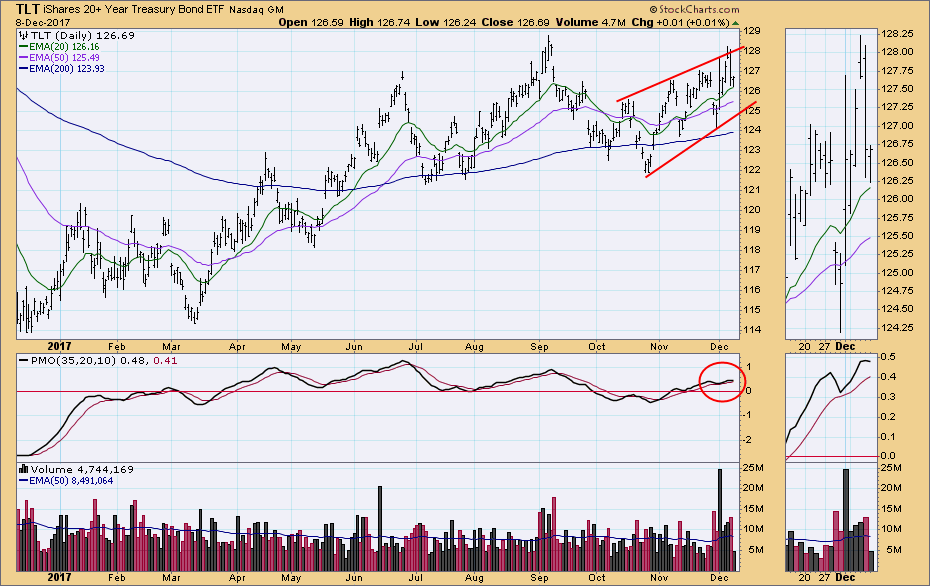
Daily Chart: Price is rising within a wedge formation, but the wedge isn't very tight, and we could argue that it is more of a channel than a wedge. That means there is less pressure on the pattern to resolve downward.
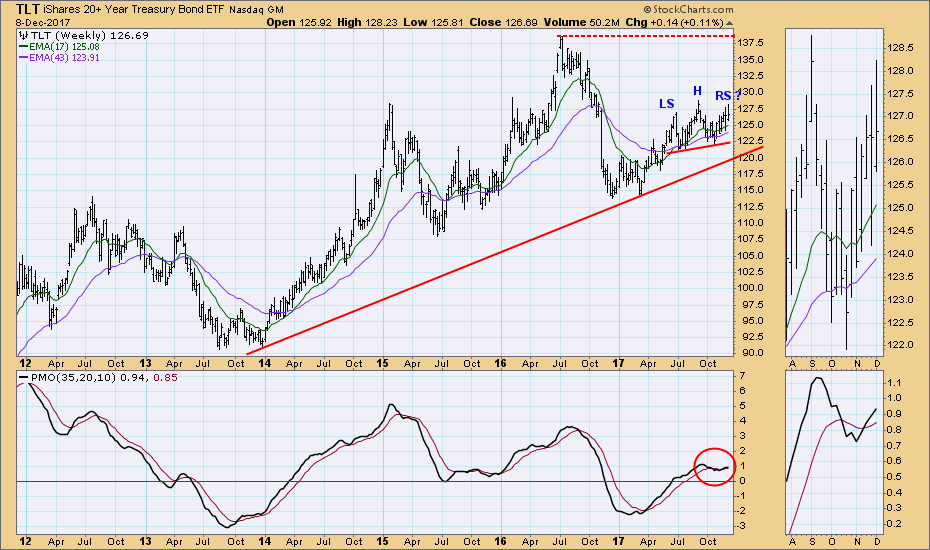
Weekly Chart: The weekly PMO is indecisive, and the head and shoulders pattern is still in progress.
**Don't miss any of the DecisionPoint commentaries! Go to the "Notify Me" box toward the end of this blog page to be notified as soon as they are published.**
Technical Analysis is a windsock, not a crystal ball.
Happy Charting!
- Carl
NOTE: The signal status reported herein is based upon mechanical trading model signals, specifically, the DecisionPoint Trend Model. They define the implied bias of the price index based upon moving average relationships, but they do not necessarily call for a specific action. They are information flags that should prompt chart review. Further, they do not call for continuous buying or selling during the life of the signal. For example, a BUY signal will probably (but not necessarily) return the best results if action is taken soon after the signal is generated. Additional opportunities for buying may be found as price zigzags higher, but the trader must look for optimum entry points. Conversely, exit points to preserve gains (or minimize losses) may be evident before the model mechanically closes the signal.
Helpful DecisionPoint Links:
DecisionPoint Shared ChartList and DecisionPoint Chart Gallery
Price Momentum Oscillator (PMO)
Swenlin Trading Oscillators (STO-B and STO-V)

