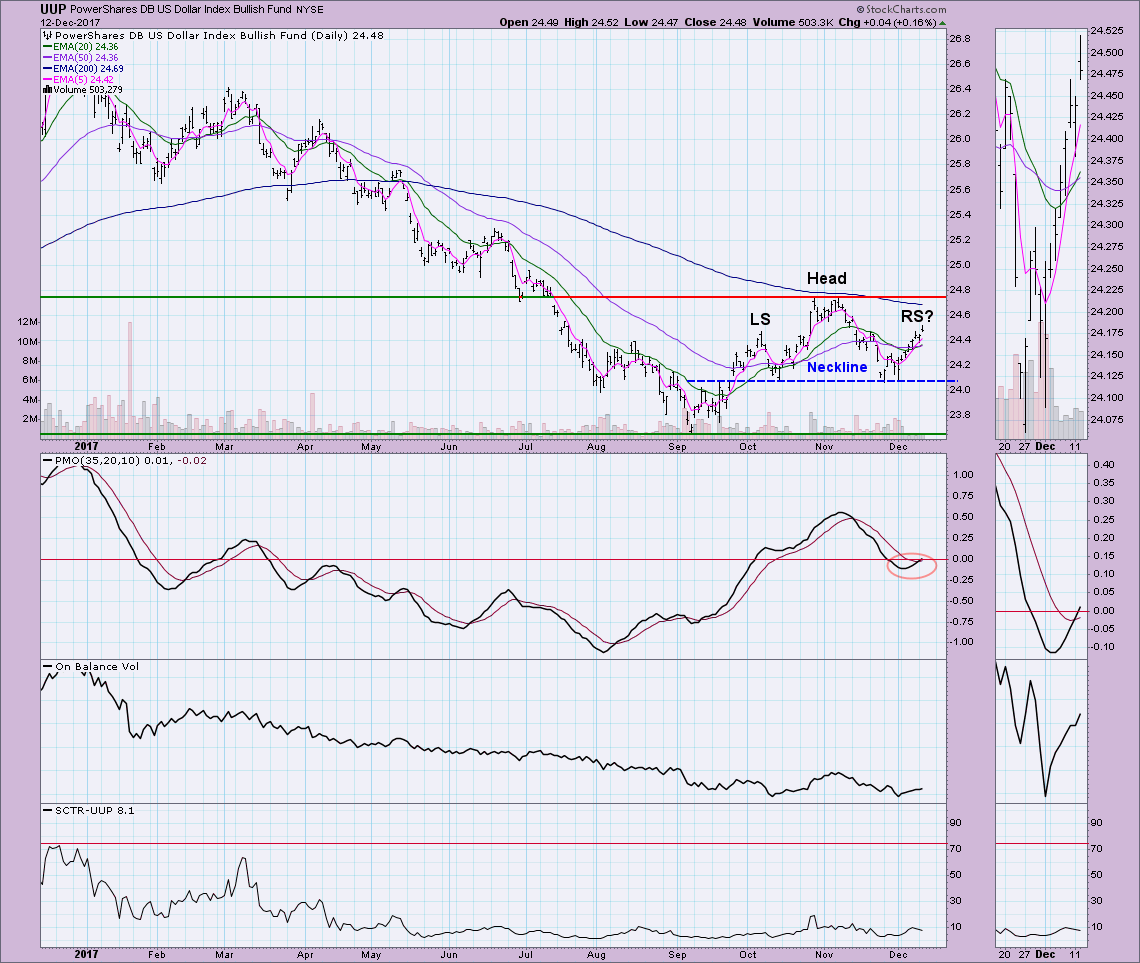
 We've seen some very interesting sector rotation this past year as the market continues to climb higher. Money doesn't seem to really be leaving the market, just rotating from one sector to the next. The Utilities sector was a good run through October and into November. However, it appears money has been rotating out (along with the technology sector which has been lagging) and moving toward Financials and Industrials. Just look at the Dow and SPX which both hit all-time highs today. The Dollar is showing improvement despite some bearish features on its chart. Yesterday saw a new PMO BUY signal on UUP and that is now joined by an Intermediate-Term Trend Model BUY signal.
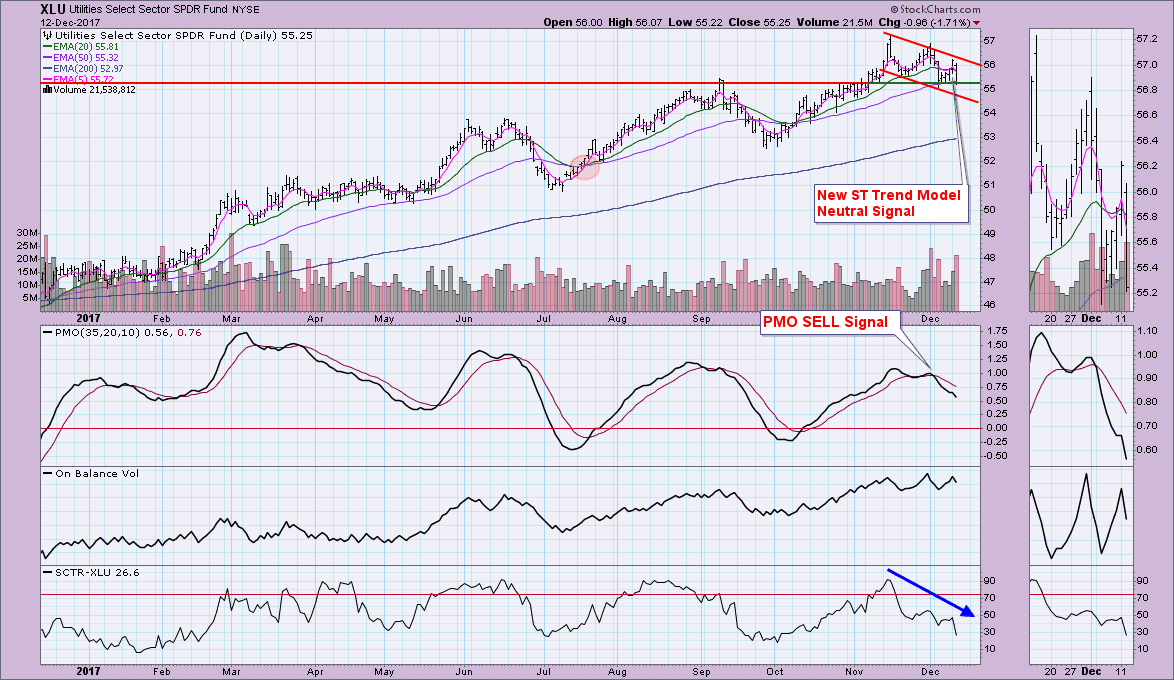
Let's review the Utilities SPDR (XLU) and its equal-weight counterpart (RYU). They do have different patterns to consider, but in both cases the picture is bearish and is getting worse. XLU has formed a declining trend channel. At this point, it is clinging to support at the September high. We were already warned there was a problem back in early December with the PMO generated a SELL signal. PMO tops and price tops are showing a bearish confirmation. The 5-EMA crossed below the 20-EMA which triggered a Short-Term Trend Model Neutral signal. Support really needs to hold here to avoid a continuation of this possible correction. Short term, this doesn't look good. Intermediate term is just "okay" right now. The 20-EMA is above the 50-EMA, but it has turned down and is considering a move toward a negative crossover with the 50-EMA which would generate an ITTM Neutral signal.
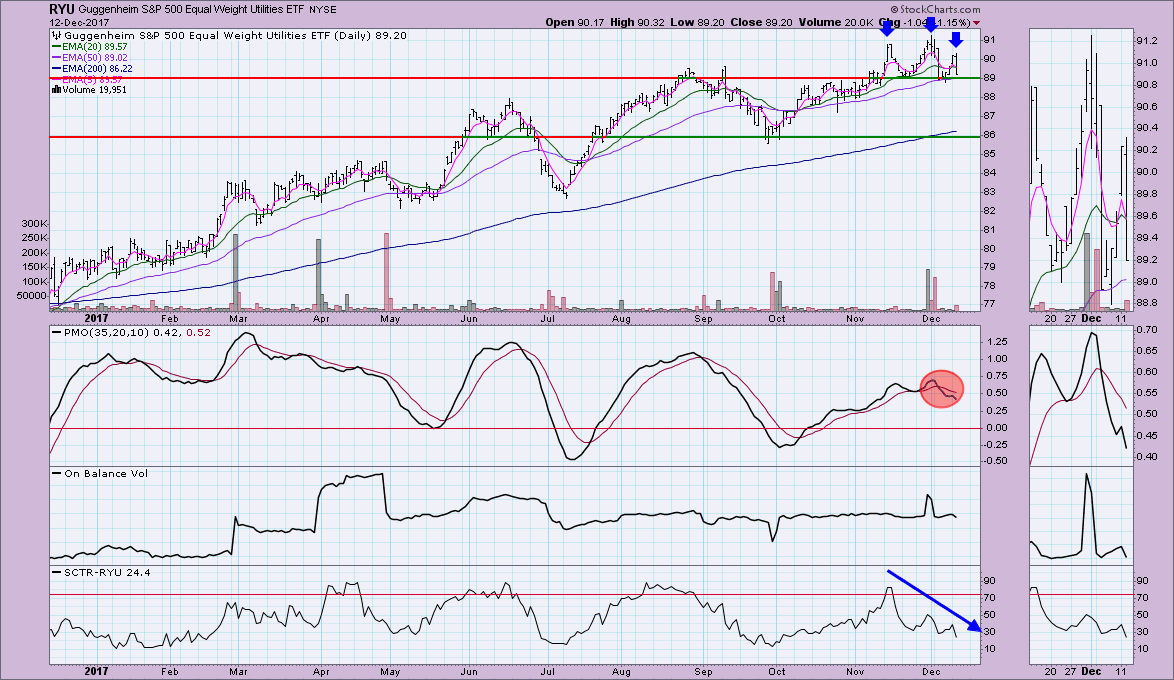
We don't see a declining trend channel on RYU, but the picture is still bleak. I see a short-term head and shoulders pattern developing. If support is lost at the 50-EMA, that would execute the pattern. The expected minimum downside target is near support at the September low. The 50-EMA is still well above the 200-EMA on both XLU and RYU, but the bearish indicators and patterns suggest we will see at least a short-term decline or correction.
I think my comments on the Dollar from yesterday's DP Alert article are still valid today except for the addition of a new IT Trend Model BUY signal which triggered when the 20-EMA crossed above the 50-EMA, so I'll reprint them:
"UUP is currently in a bear market configuration (50-EMA < 200-EMA) so the development of a bearish head and shoulders pattern should raise some eyebrows. However, I doubt this pattern will form or execute given the new PMO BUY signal and pending IT Trend Model BUY signal. More likely we will see a move toward overhead resistance around $24.75 followed by a breakout. So despite having annotated a bearish pattern, the indicators are telling me to ignore it."
Helpful DecisionPoint Links:
DecisionPoint Shared ChartList and DecisionPoint Chart Gallery
Price Momentum Oscillator (PMO)
Swenlin Trading Oscillators (STO-B and STO-V)
Technical Analysis is a windsock, not a crystal ball.
Happy Charting!
- Erin
**Don't miss DecisionPoint Commentary! Add your email below to be notified of new updates"**


