Positive events resulting from the recent tax cut legislation continued to lift the market this week, bonuses and pay raises being most prominent in the headlines. I'm sure that there is a substantial element of anticipation as to the positive effects of corporate taxes being cut by 40%, but I think it will take a while before we have an accurate assessment of the bottom line. At any rate, I think we're watching prices being adjusted upward in response to the new reality.
The DecisionPoint Weekly Wrap presents an end-of-week assessment of the trend and condition of the stock market (S&P 500), the U.S. Dollar, Gold, Crude Oil, and Bonds.
STOCKS
IT Trend Model: BUY as of 11/15/2016
LT Trend Model: BUY as of 4/1/2016
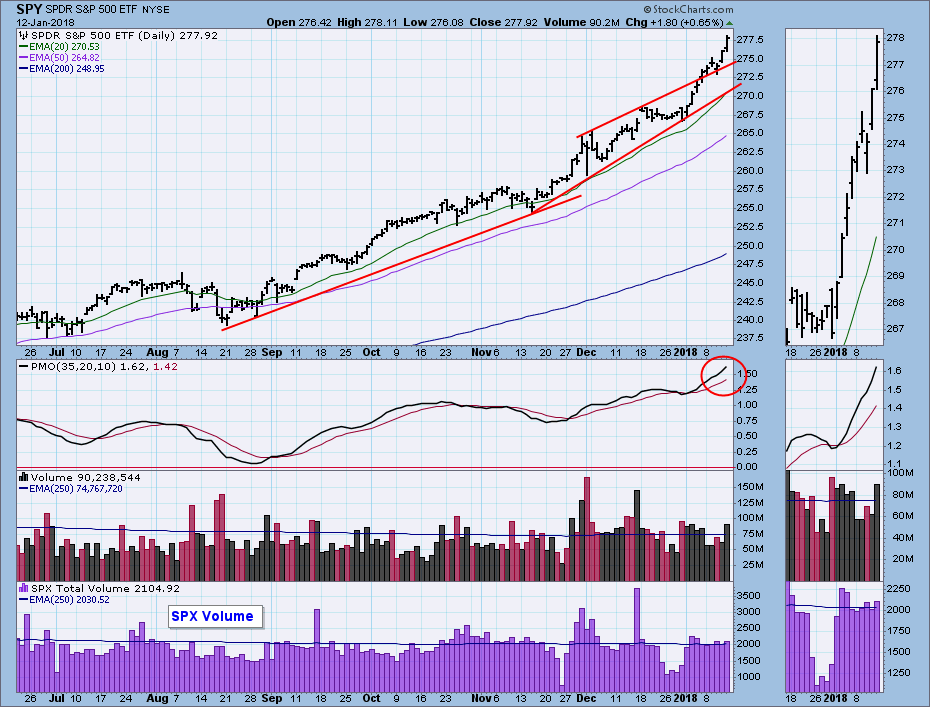
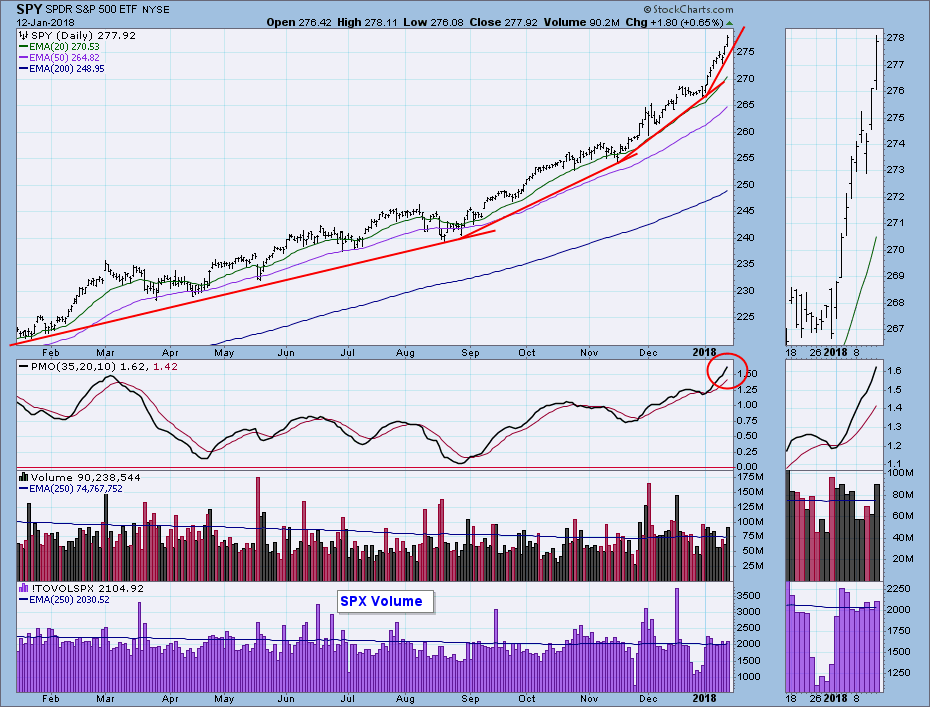
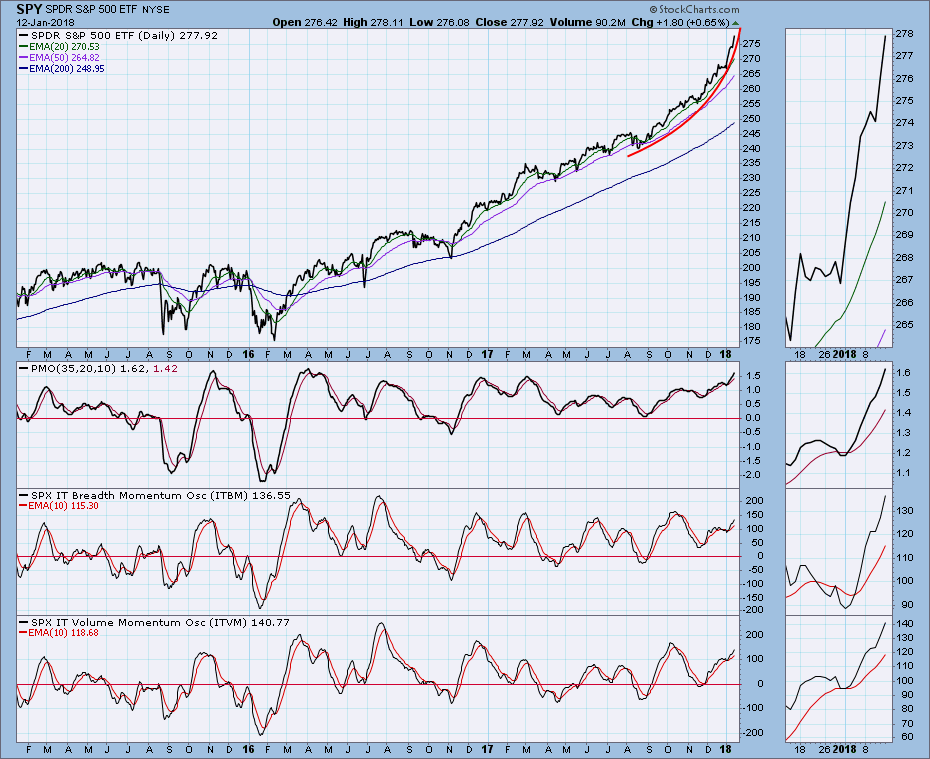
Daily Chart: We now have four ever-steepening rising trend lines, which indicates a parabolic price rise. The daily PMO is near the top of the normal range and overbought. Looking at this one-year chart, we can see that PMO tops have not precipitated any serious declines, and the next PMO top probably won't signal anything major to the downside, but experiencing something similar to what happened in March and April wouldn't be out of the question. SPX Volume has been strong, but not so strong as to suggest that we're seeing a blowoff.
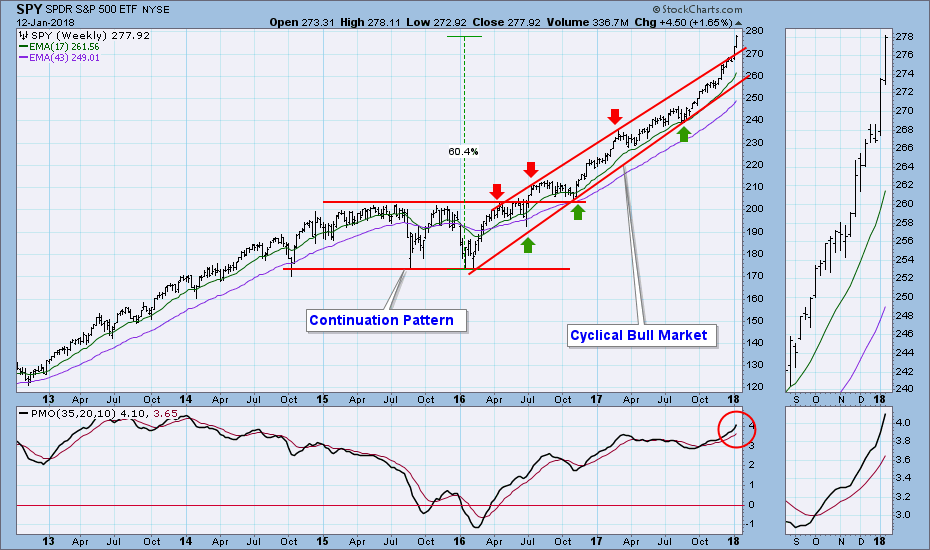
Weekly Chart: Price was supposed to be hindered by the top of the rising trend channel, and eventually move at least sideways to correct the excesses of the move up from the summer lows. Instead price has broken up through the resistance and is maintaining a nearly vertical trajectory. The weekly PMO is approaching the top of the five-year range.
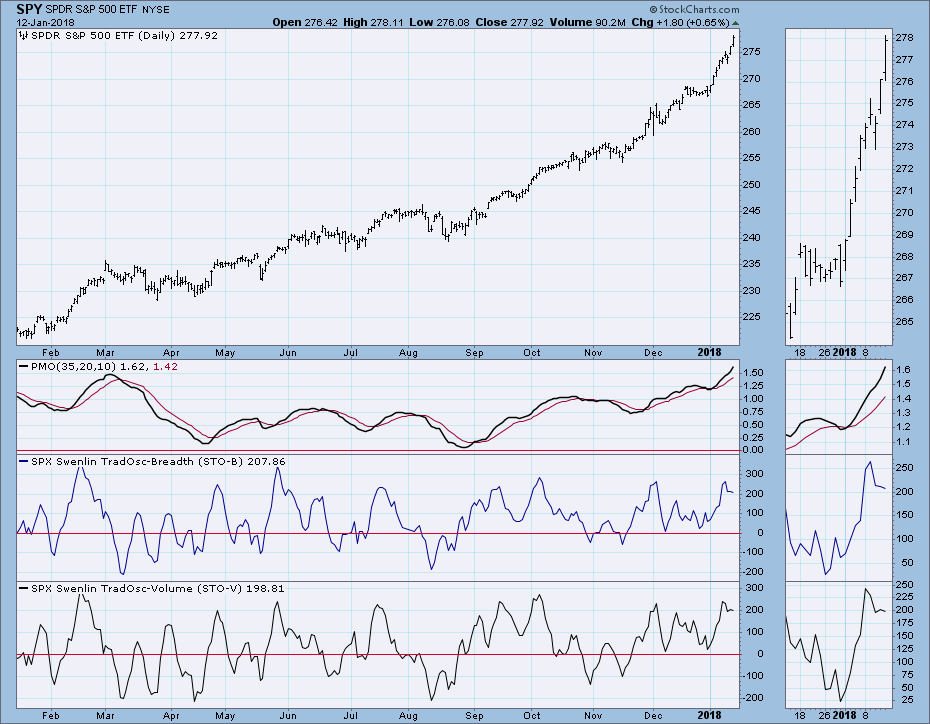
Short-Term Market Indicators: Overbought, but in the last year these have not been very useful in identifying price tops.
Intermediate-Term Market Indicators: Becoming overbought.
Conclusion: There are fundamental factors, not all positive, that are being digested by the market at this time. Most significant and positive is, of course, the corporate tax cut. On the negative side is the report (denied by the Chinese) that the Chinese may slow or stop purchase of U.S. debt. Related is the suggestion by some that the 36-year secular bull market in bonds has ended. At the moment, I think that the tax cut is the primary driver of price movement.
Unless they initiate off a low, I usually think of vertical price moves as being blowoffs. In the current situation I think we're seeing a sudden upward adjustment to accommodate the positive expectations from the tax cut. In other words, a "new normal" is being established. That doesn't mean that the market is not overvalued, but the downward adjustment for that issue awaits us somewhere in the future.
Bottom line, vertical price moves make me nervous, because parabolic advances most often collapse. The market is overbought by most measures, so be careful.
DOLLAR (UUP)
IT Trend Model: SELL as of 12/21/2017
LT Trend Model: SELL as of 5/24/2017
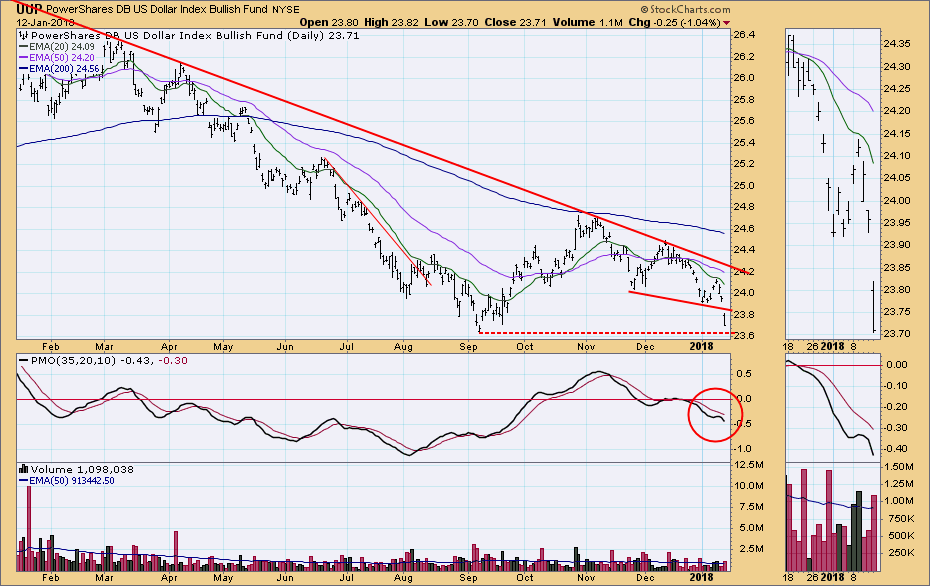
Daily Chart: The falling wedge formation we were watching was expected to resolve upward, but UUP topped well below the top of the wedge, signalling that a bearish resolution was more likely. That is what happened on Friday, causing the daily PMO to top below the signal line and the zero line. This is very negative, and the test of the next support line will probably fail.
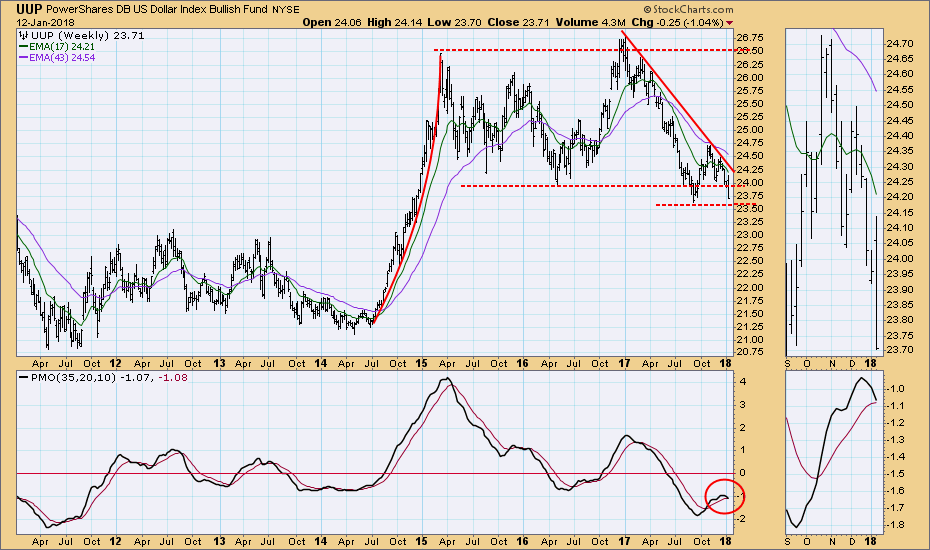
Weekly Chart: UUP will soon be testing the 2017 low. The weekly PMO has topped and will probably drop below the signal line next week.
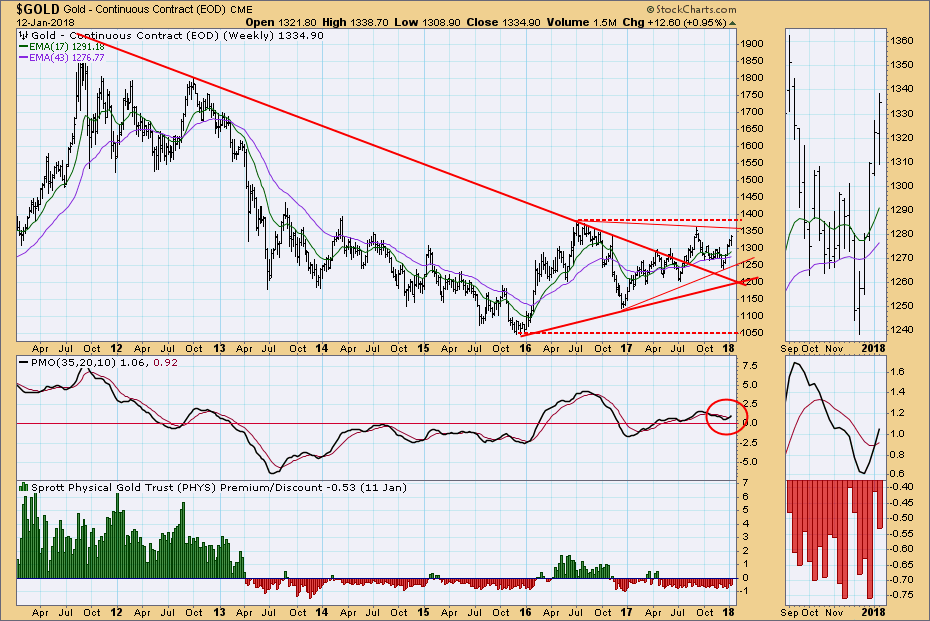
GOLD
IT Trend Model: BUY as of 1/2/2018
LT Trend Model: BUY as of 4/12/2017
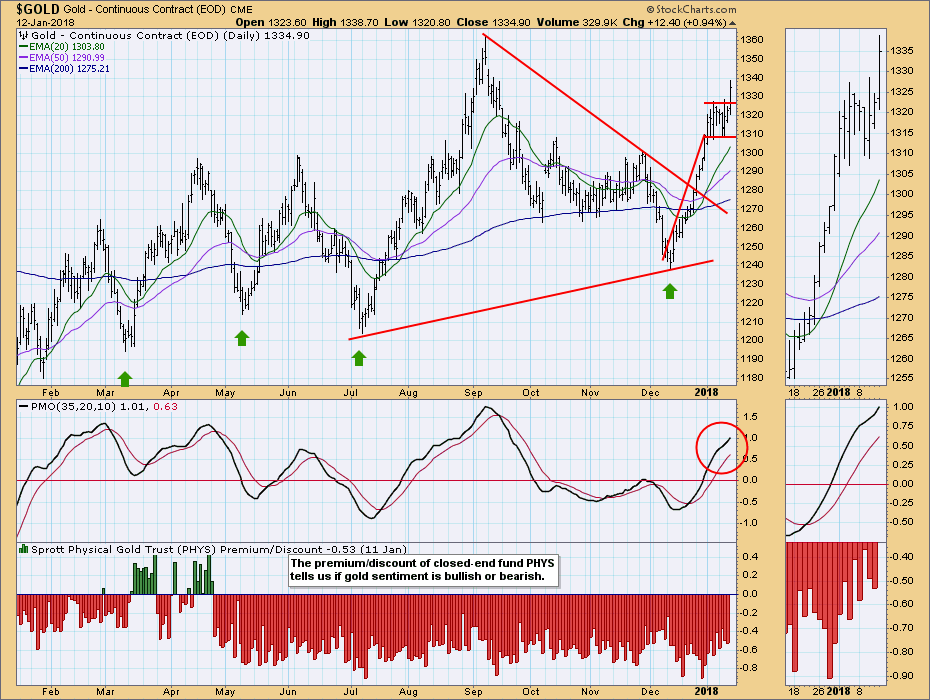
Daily Chart: Gold broke out of a flag formation on Friday, which projects a 70 point move from the top of the flag -- to about 1395.
Weekly Chart: The weekly PMO is above the signal line and rising. Overhead resistance will come into play at about 1350 and 1380. A break above 1380 will exceed the 2016 top, and that action will establish a long-term rising trend off the bear market low in 2015.
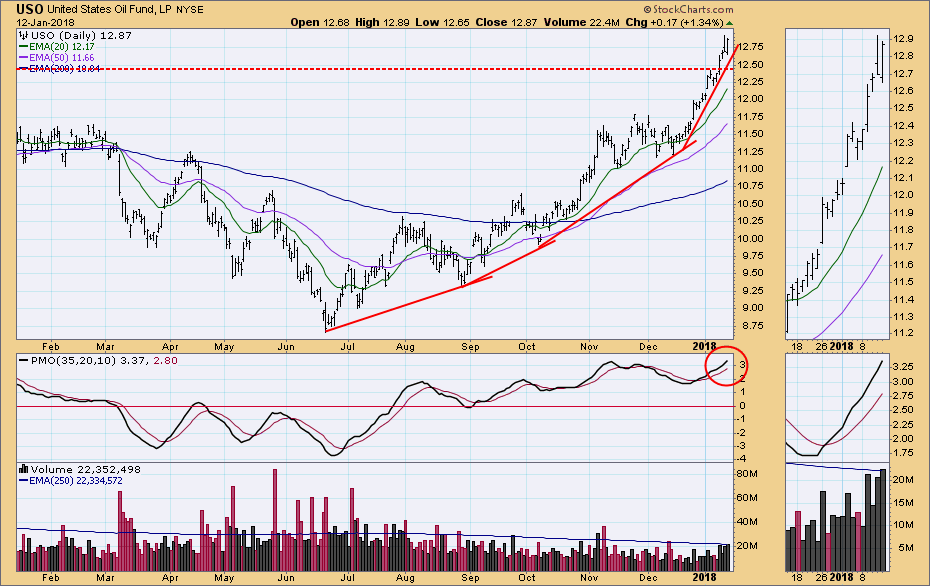
CRUDE OIL (USO)
IT Trend Model: BUY as of 9/6/2017
LT Trend Model: BUY as of 11/2/2017
Daily Chart: USO has made a decisive breakout through the top of the 2-year trading range at about 12.50. Since the breakout is "decisive" (3% or more), it is unlikely that USO will fall back into the range when the support is tested on a pullback.
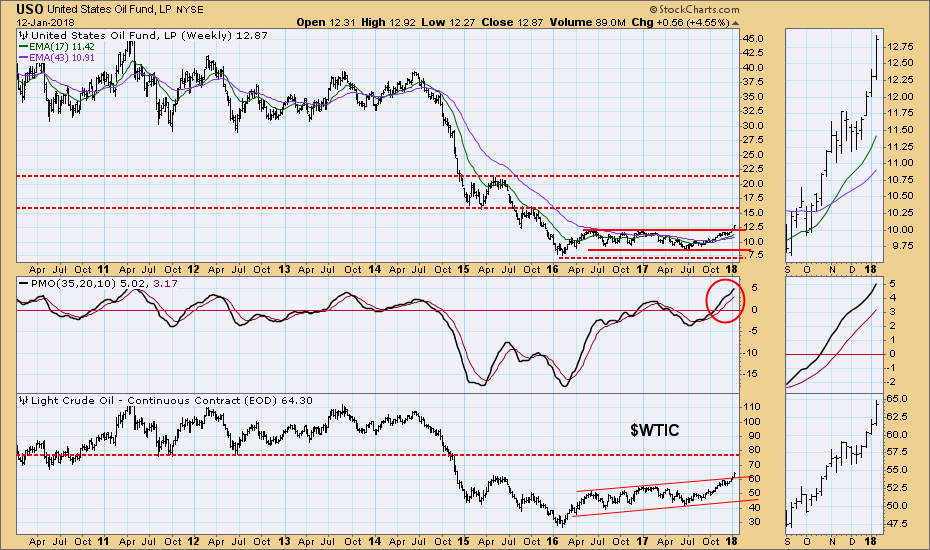
Weekly Chart: Here we can see longer-term resistance at around 15.80 for USO, and around 78.00 for $WTIC.
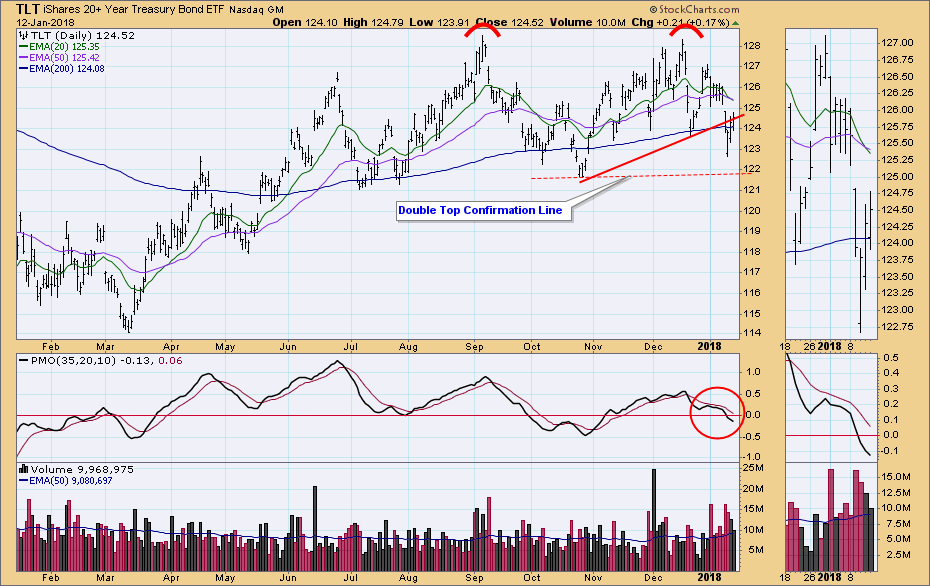
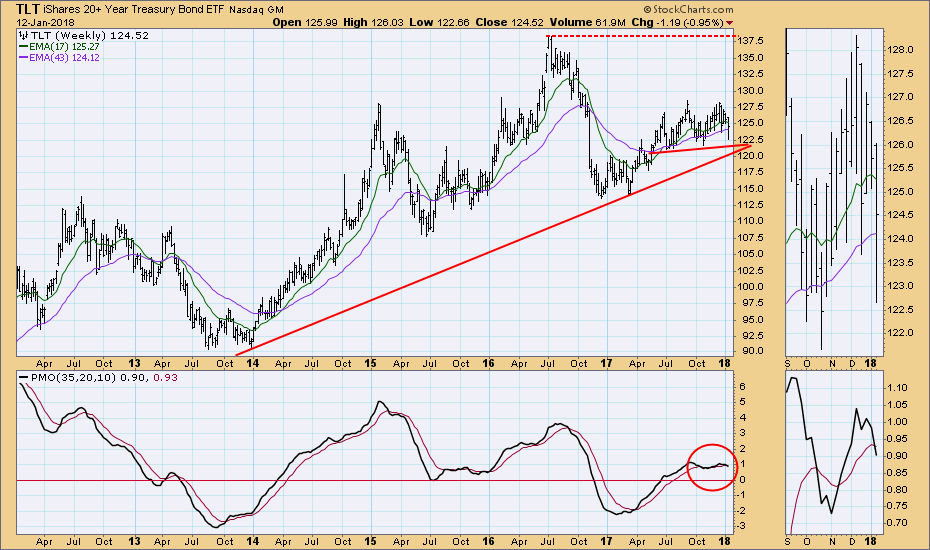
BONDS (TLT)
IT Trend Model: NEUTRAL as of 1/11/2018
LT Trend Model: BUY as of 6/16/2017
Daily Chart: The double top configuration is still viable as TLT broke through a rising trend line and the 20EMA crossed down through the 50EMA, generating an IT Trend Model NEUTRAL signal.
Weekly Chart: Technicals haven't deteriorated beyond hope in this time frame because the EMAs are still positive, but the PMO is negative.
**Don't miss any of the DecisionPoint commentaries! Go to the "Notify Me" box toward the end of this blog page to be notified as soon as they are published.**
Technical Analysis is a windsock, not a crystal ball.
Happy Charting!
- Carl
NOTE: The signal status reported herein is based upon mechanical trading model signals, specifically, the DecisionPoint Trend Model. They define the implied bias of the price index based upon moving average relationships, but they do not necessarily call for a specific action. They are information flags that should prompt chart review. Further, they do not call for continuous buying or selling during the life of the signal. For example, a BUY signal will probably (but not necessarily) return the best results if action is taken soon after the signal is generated. Additional opportunities for buying may be found as price zigzags higher, but the trader must look for optimum entry points. Conversely, exit points to preserve gains (or minimize losses) may be evident before the model mechanically closes the signal.
Helpful DecisionPoint Links:
DecisionPoint Shared ChartList and DecisionPoint Chart Gallery
Price Momentum Oscillator (PMO)
Swenlin Trading Oscillators (STO-B and STO-V)

