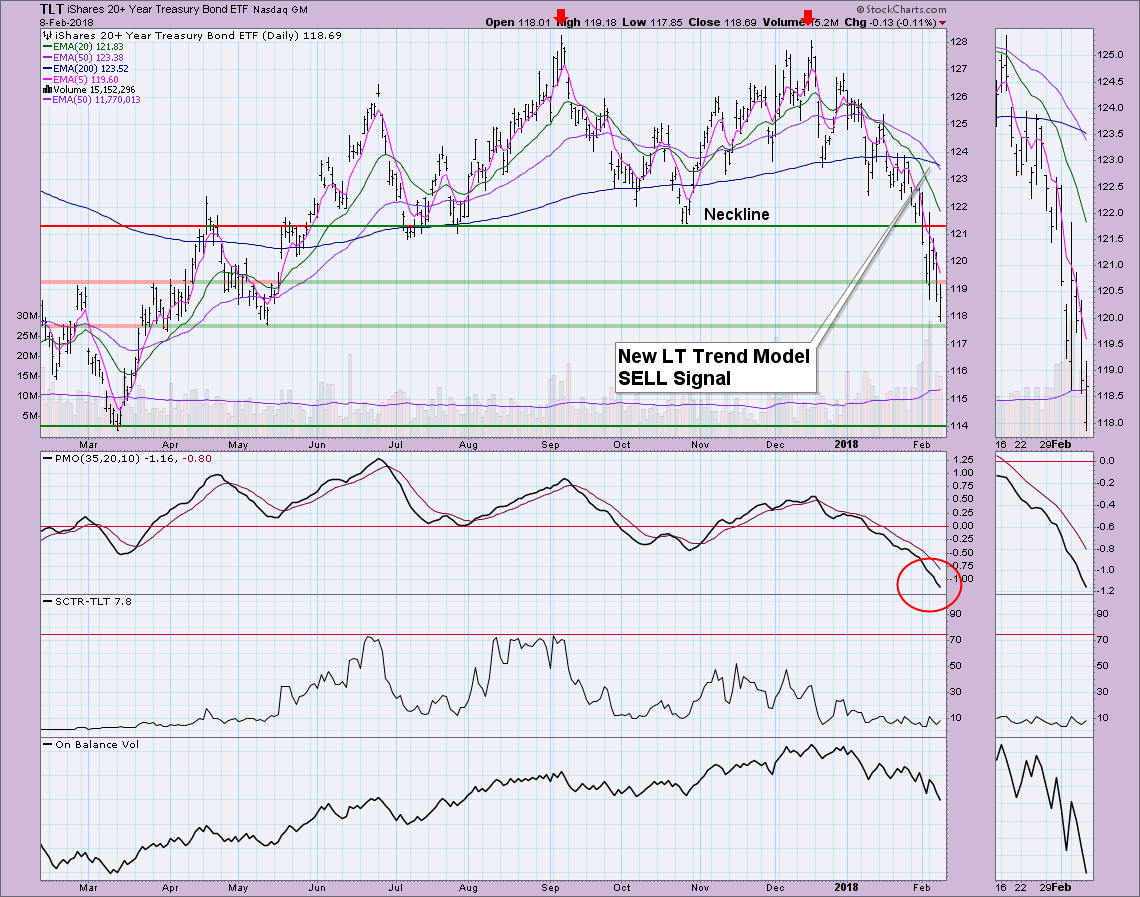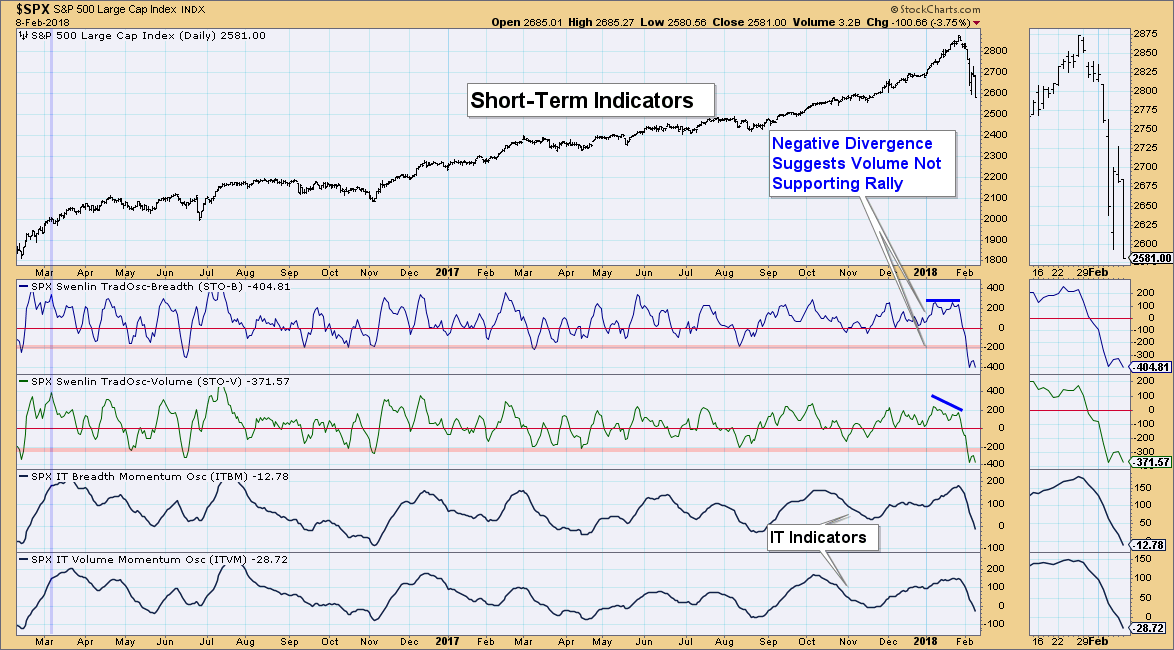
Two charts you should look at now. I mentioned yesterday that TLT was going to see a Long-Term Trend Model SELL signal today and it did. Additionally, ST indicators which had turned up have turned back down and have reached down into very oversold extremes.
While the PMO may appear very oversold, it's not. If you take the daily chart out about 5 or 6 years, you'll see the normal range is between +2.5 to -2.5. The PMO can drop further and it doesn't appear interested in a bottom. I'm looking for the completion of the double-top pattern which would bring price down to $114.
Short-term indicators have turned back down in very oversold territory. One thing Carl always told me is that oversold conditions under bearish circumstances aren't always a determining factor in a price bottom. Similarly, overbought conditions in a bull market configuration aren't something to get overly concerned about. I do think, however, that we are at a very stretched out level and it is time for a rally pop. That might mean a big rally at the open followed by retracement back to the previous close. Note that IT indicators are still declining and haven't decelerated at all. I am still looking for a double-bottom to form off of this decline but of course we do need to see a solid bottom and the current foundation is less than secure.
Helpful DecisionPoint Links:
DecisionPoint Shared ChartList and DecisionPoint Chart Gallery
Price Momentum Oscillator (PMO)
Swenlin Trading Oscillators (STO-B and STO-V)
Technical Analysis is a windsock, not a crystal ball.
Happy Charting!
- Erin
**Don't miss DecisionPoint Commentary! Add your email below to be notified of new updates"**


