The market has closed on the final day of February. This means that DecisionPoint monthly indicators have "gone final" which is the perfect time to review those signals and take a long-term view of the markets and the DecisionPoint "Big Four"- $USD, $GOLD, $WTIC & $USB. For a live review, tune in to MarketWatchers LIVE tomorrow 12:00p - 1:30p EST.
First take a look at the DecisionPoint Scoreboards below. The configuration is decidedly bullish and not what you'd expect to see at the beginning of a bear market.
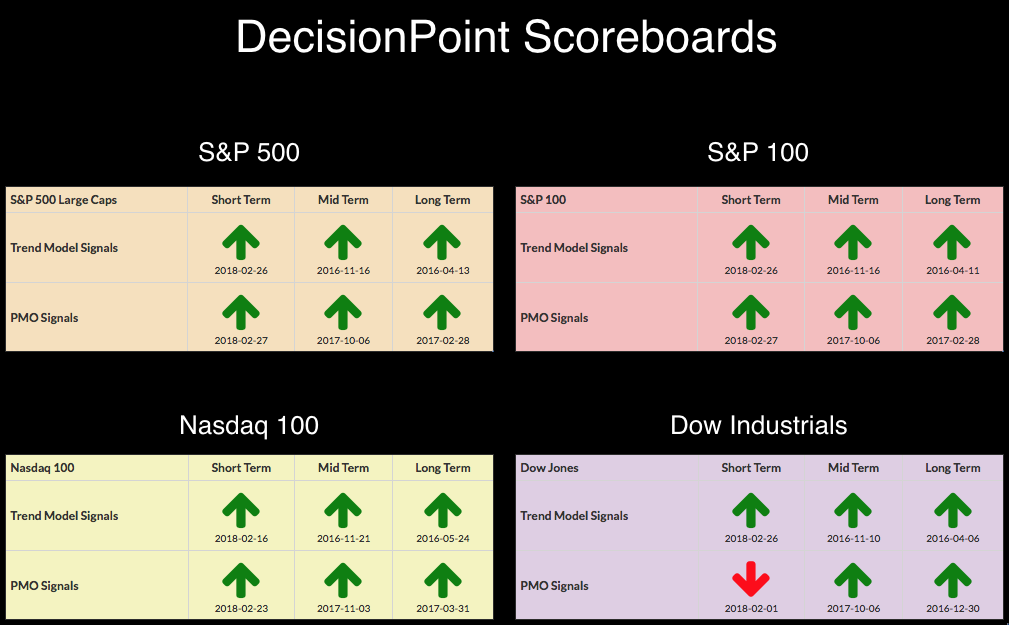
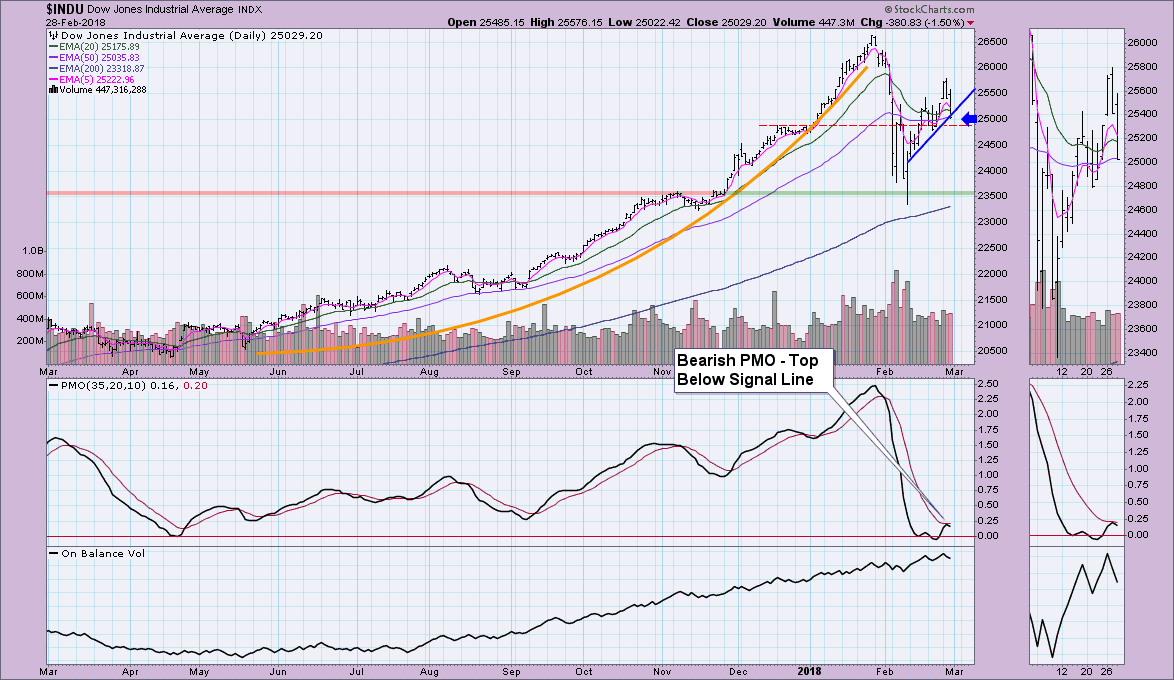
The Dow is holding out. I thought for sure we would see the new ST PMO BUY signal, but instead its PMO turned down below the signal line. This is bearish, but the margin is so thin, a decent price rise will send it over the signal line.
Since we're on the Dow, let's look at the long-term monthly chart. Unfortunately after a correction this month, the PMO has begun to decelerate. So we go from last month, setting an all-time high, to this month with a correction. The consequent breakdown of the parabolic rally brought price back to the 10-month EMA. Carl pointed out distinct rising wedge formations on the longer-term charts. These are bearish formations. If it executes the pattern, we will see a breakdown which means a trip to at least the bottom of the wedge for a test around 22000.
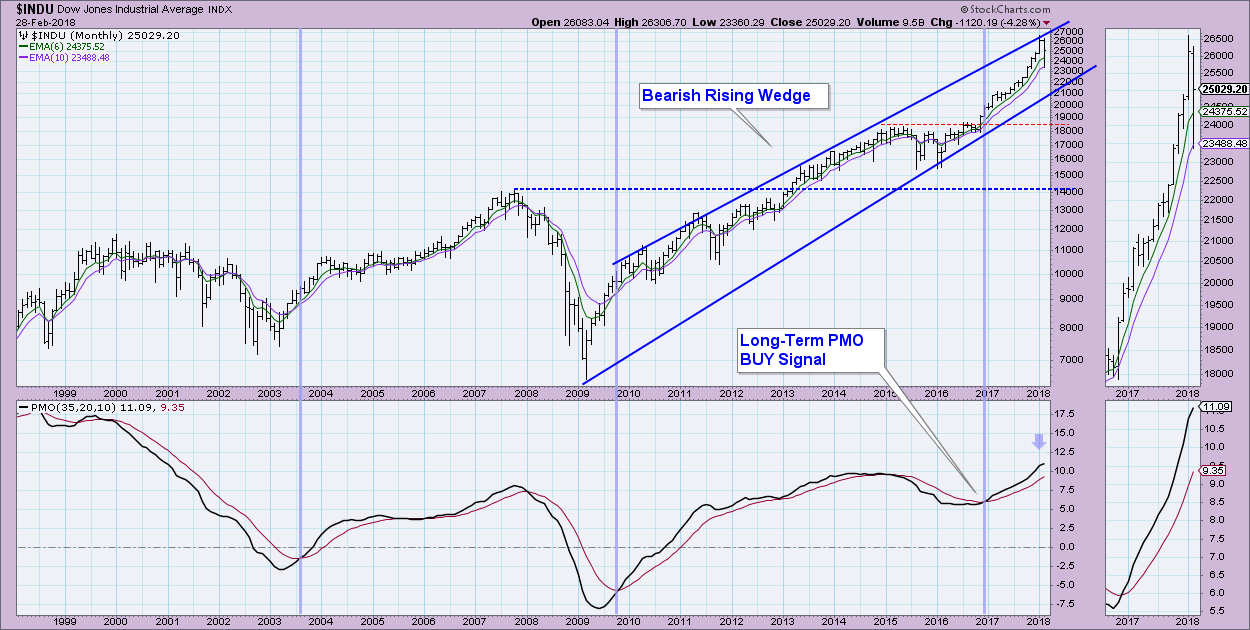
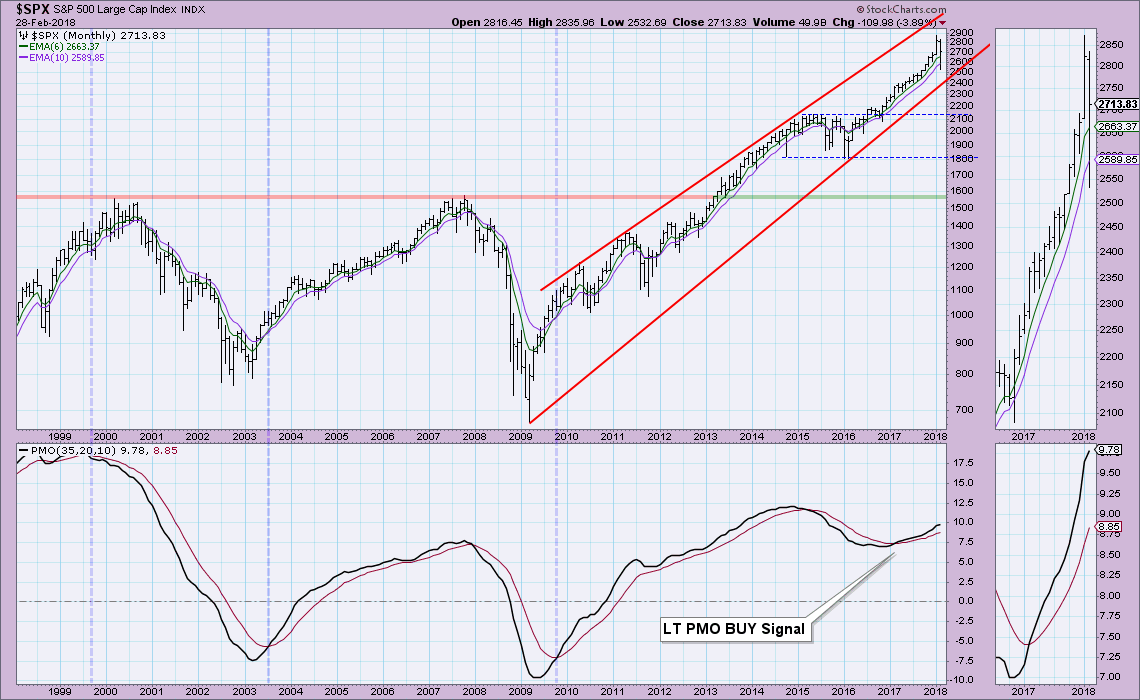
We're seeing deceleration on the monthly PMOs for all of the indexes, albeit very little. One thing I can say for the Dow is that if the PMO were to top off here, at least that top would be above the previous top. It isn't looking quite so good for the other three indexes where this deceleration is coming below the last PMO top. A test of this bearish rising wedge would mean a drop below 2500.
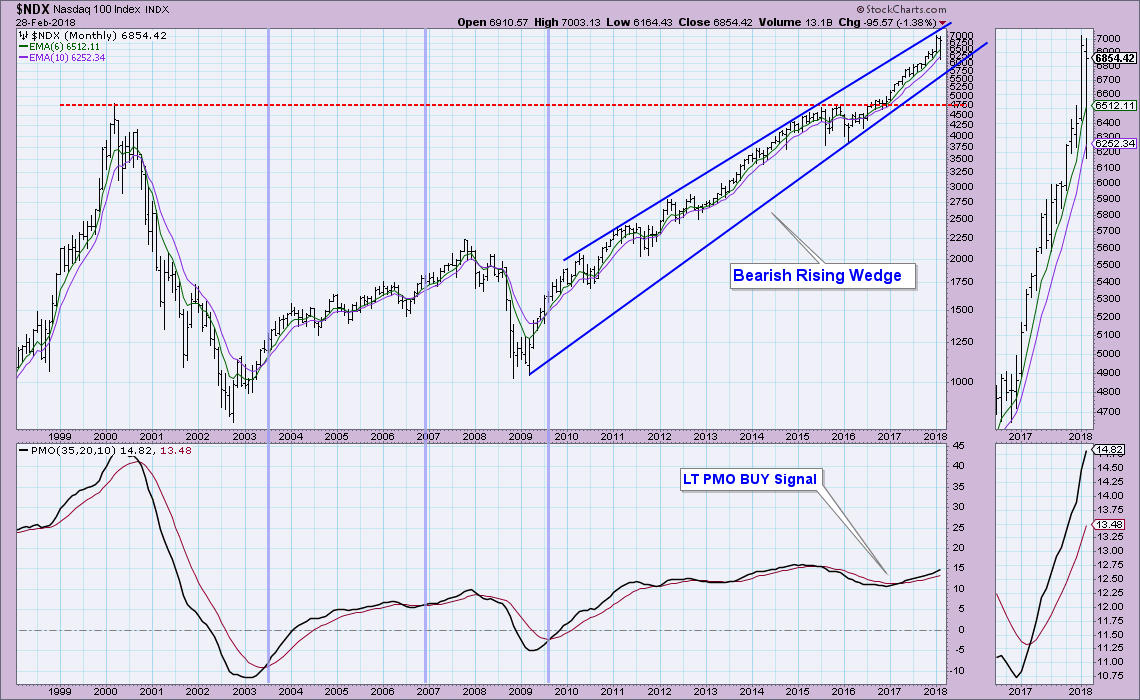
The rising wedge test on the NDX would bring price down to 6000.
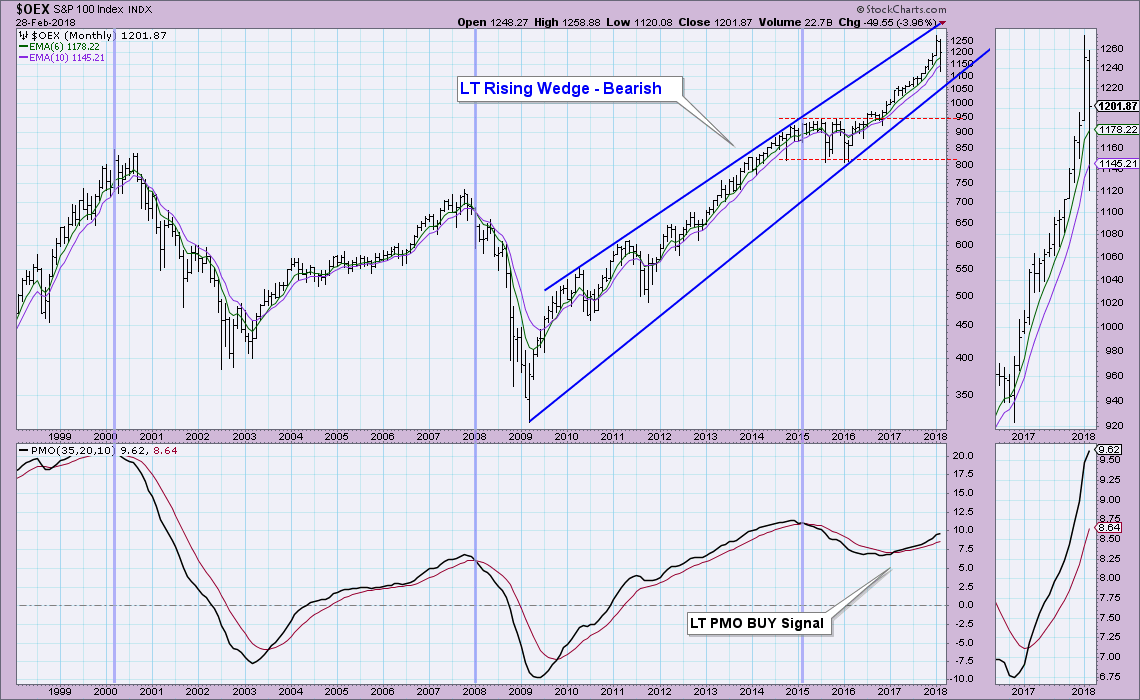
Overall, there are bearish characteristics on the monthly charts that I won't ignore. However, the PMOs are just not bearish enough for me to start worrying about deep corrections just yet.. You'll see we usually get notice on the deep corrections/bear markets based on PMO tops and SELL signals. I would just like to make you aware of some of the bearish chart features that tell us this correction may not have been enough.
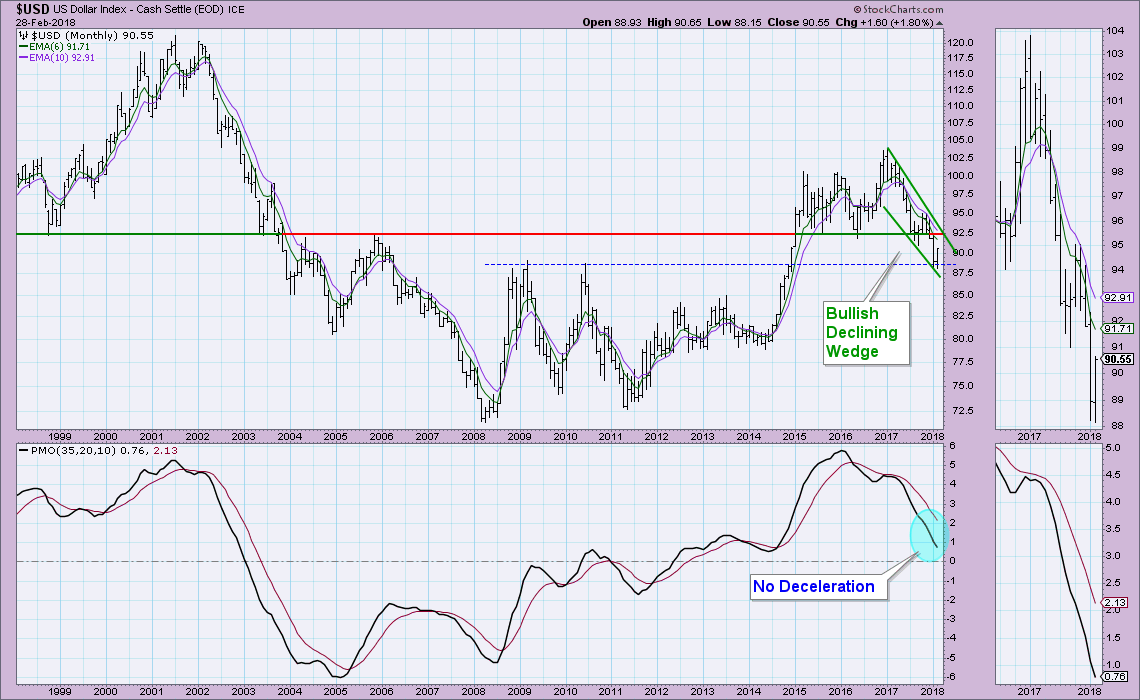
DOLLAR
The Dollar might finally be waking up for a big rally. After failing to hold support at 92.50, price may have found support along the 2009-10 price tops. The declining wedge is encouraging, but the PMO isn't confirming a strong Dollar. If this support area breaks, the next support is around 85.
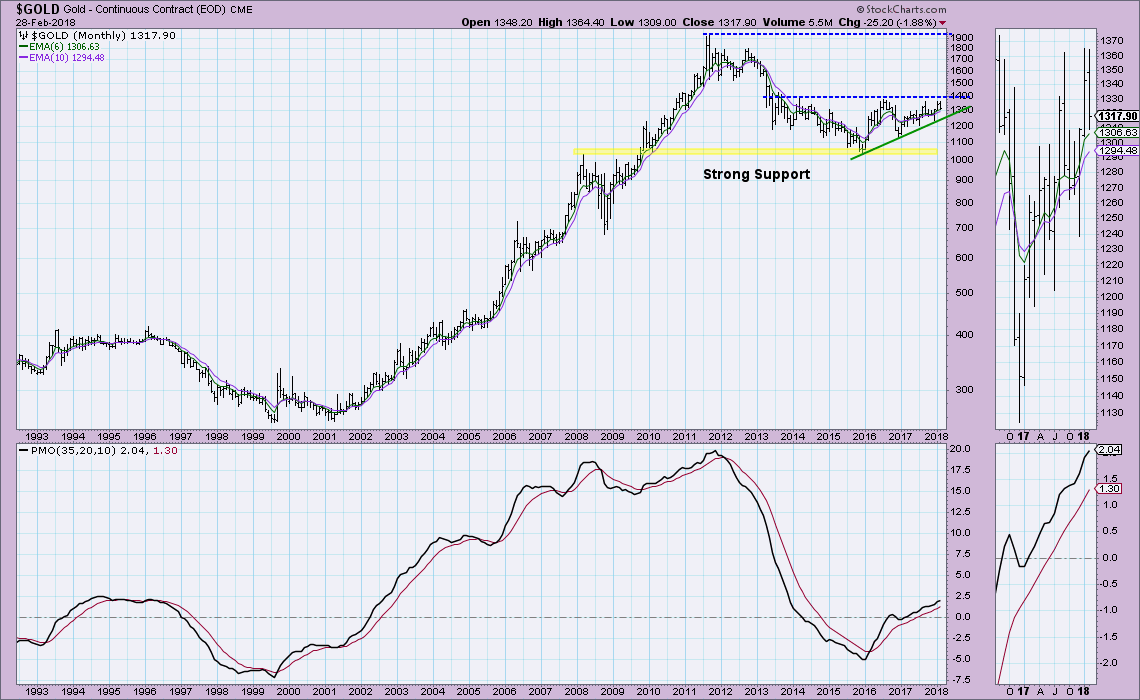
GOLD
After studying this chart for some time, I decided to simplify the annotations down to the important ones. The green rising bottoms trendline is intact and price is making its way back to overhead resistance at about 1365. This is forming an ascending triangle which is bullish and suggests a break above resistance. If this pattern is to execute, it needs to do it soon as the pattern is about to be nullified if price forces itself much further into the apex. Given the rising PMO (albeit less than enthusiastically rising), an upside breakout in the next month, maybe two, would validate the pattern. If the Dollar makes its move higher, that will add downside pressure that could prevent a breakout altogether.
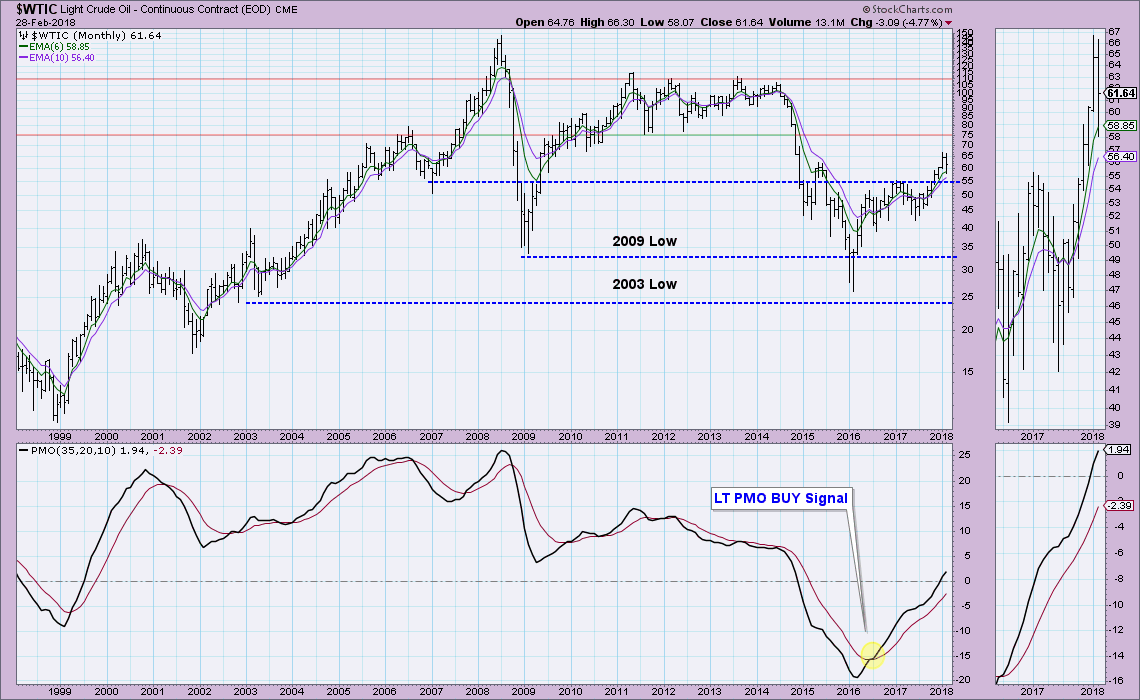
CRUDE OIL ($WTIC)
I like what I'm seeing here. A strong PMO that has now hurdled the zero line and a breakout above $55. There is clear upside potential at $75/barrel. However, based on intermarket analysis we know that a strong Dollar will put downward pressure on commodity prices. The $55/barrel support area needs to hold.
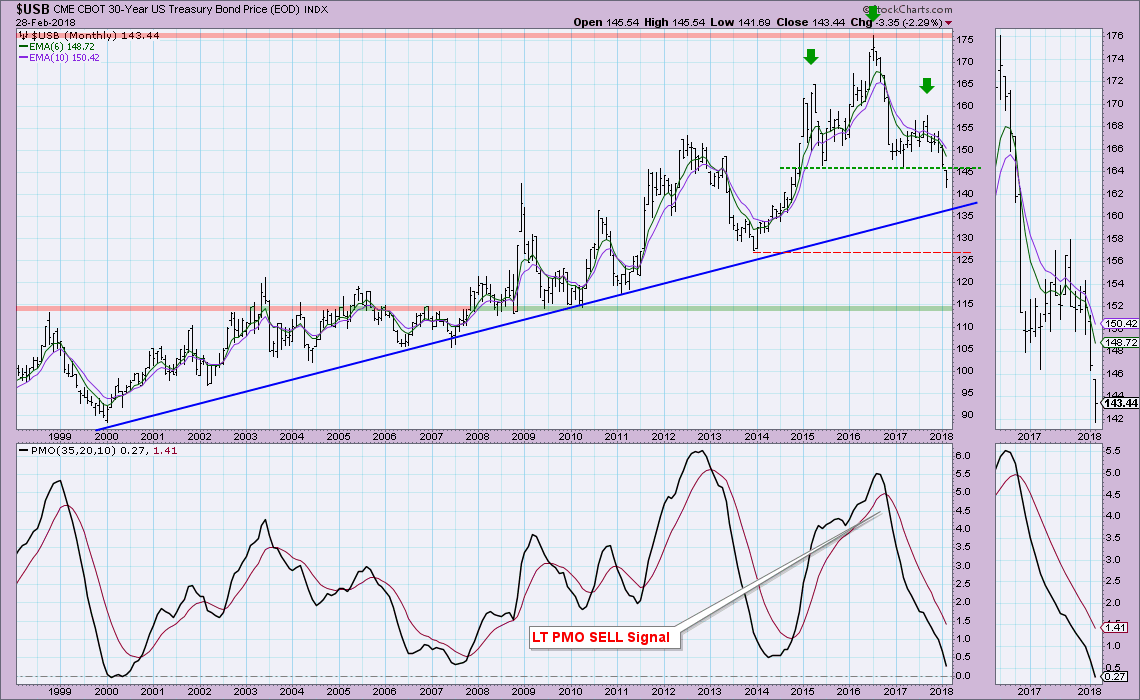
BONDS
Not good. In fact this is very close to ugly. The prominent bearish features are the long-term head and shoulders pattern coming after a long-term rising trend. Price has just broken below the neckline. While it isn't a 'decisive' (> 3%) breakdown, it is a clear execution of the chart pattern. Is there any hope? Well, the PMO is in oversold territory and there is rising bottoms support that has held for years. I'd allow for a drop below that trendline to about $135 (2012 low). If we see Bonds break below $135, put on your crash helmet. The minimum downside target for this head and shoulders pattern is $115 which lines up nicely with the 2009-10 lows and 1998/2001 tops, among others. If you'd like to take a more optimistic outlook, a drop below $135 could have price find support at the 2013 low.
Technical Analysis is a windsock, not a crystal ball.
Happy Charting!
Erin
Helpful DecisionPoint Links:
DecisionPoint Shared ChartList and DecisionPoint Chart Gallery
Price Momentum Oscillator (PMO)
Swenlin Trading Oscillators (STO-B and STO-V)
**Don't miss DecisionPoint Commentary! Add your email below to be notified of new updates"**


