
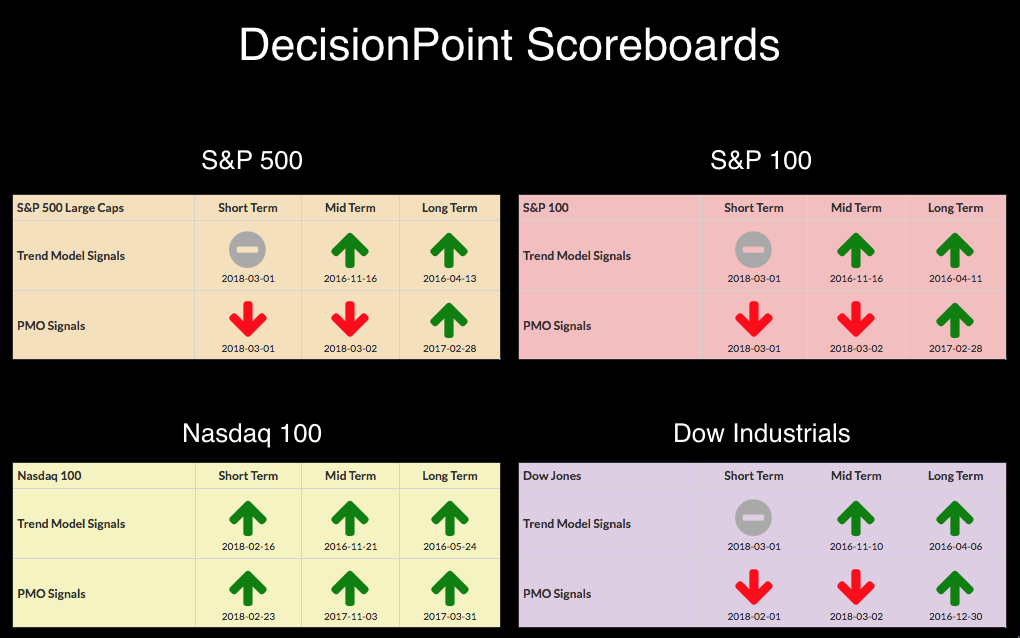
It's days like today that I find it frustrating to write (probably why this is posted late). It's not really writers' block, but the many mixed messages or lack of messages I'm getting on the charts right now. I could probably make a bullish and bearish case quite easily on most of these charts, but rather than that, I'll give you what the dispassionate indicators are saying. The DP Scoreboards are mixed as well, but clearly leaning neutral to bearish for all but the NDX.
The purpose of the DecisionPoint Alert Daily Update is to quickly review the day's action, internal condition, and Trend Model status of the broad market (S&P 500), the nine SPDR Sectors, the U.S. Dollar, Gold, Crude Oil, and Bonds. To ensure that using this daily reference will be quick and painless, we are as brief as possible, and sometimes we let a chart speak for itself.
STOCKS
IT Trend Model: BUY as of 11/15/2016
LT Trend Model: BUY as of 4/1/2016
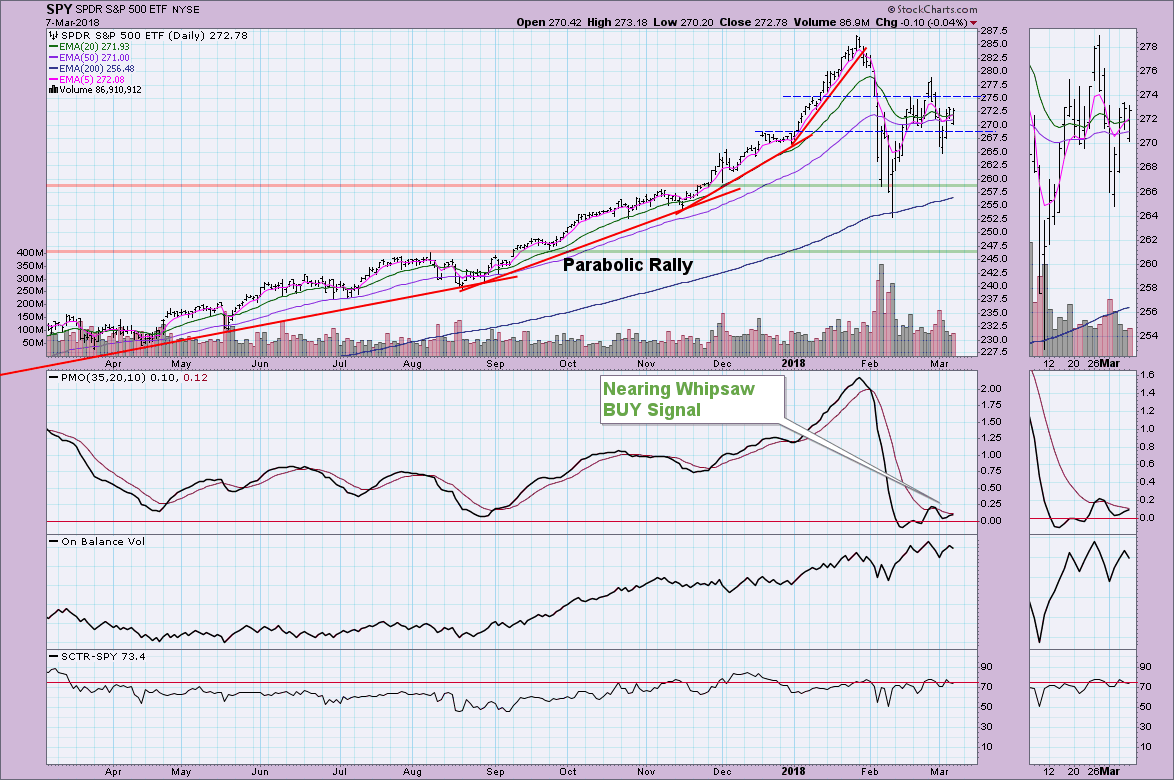
What I'm trying to decide when I look at this chart is whether the current consolidation zone is enough for a springboard to the next bull market rally.
I do note declining tops and bottoms on the OBV which is bearish. We just got a ST Trend Model BUY signal on the SPY, though not on the SPX. PMO bottoms are rising, but it is twitchy and flat which isn't particularly helpful.
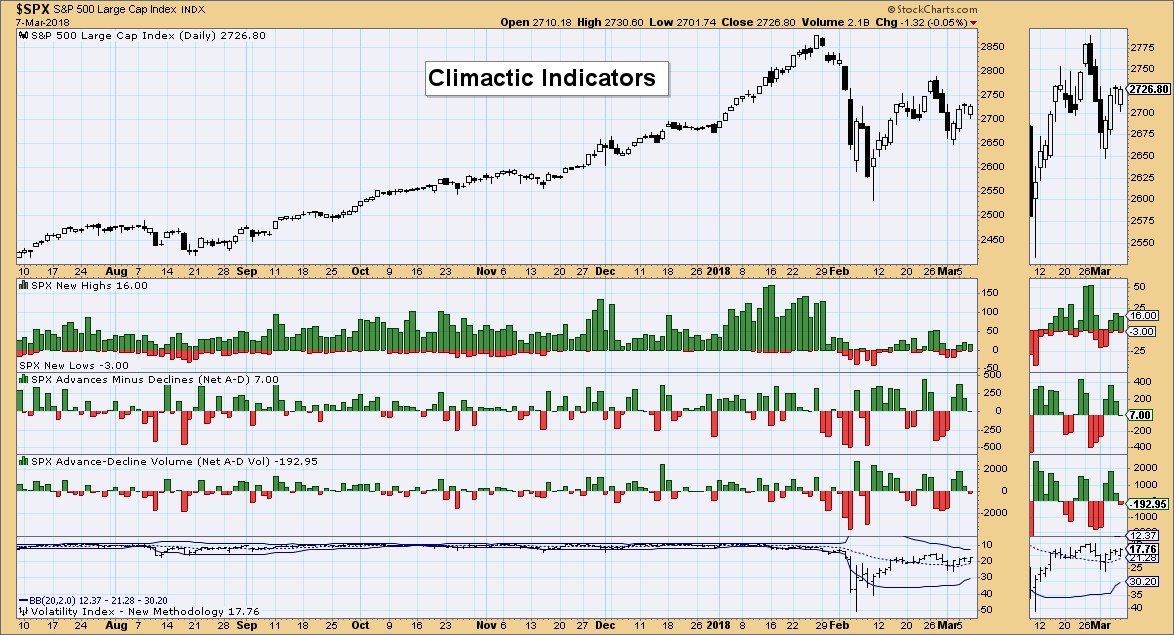
Climactic Indicators:
I was hoping to see something helpful on the climactic indicators but my hopes were dashed when I saw the far from climactic breadth readings and VIX stationing itself on its moving average. This chart is excellent when we get climactic readings like Bollinger Band punctures or large A-D readings.
Short-Term Indicators:
These indicators are rising and are now above zero which I like. This suggests an upside breakout.
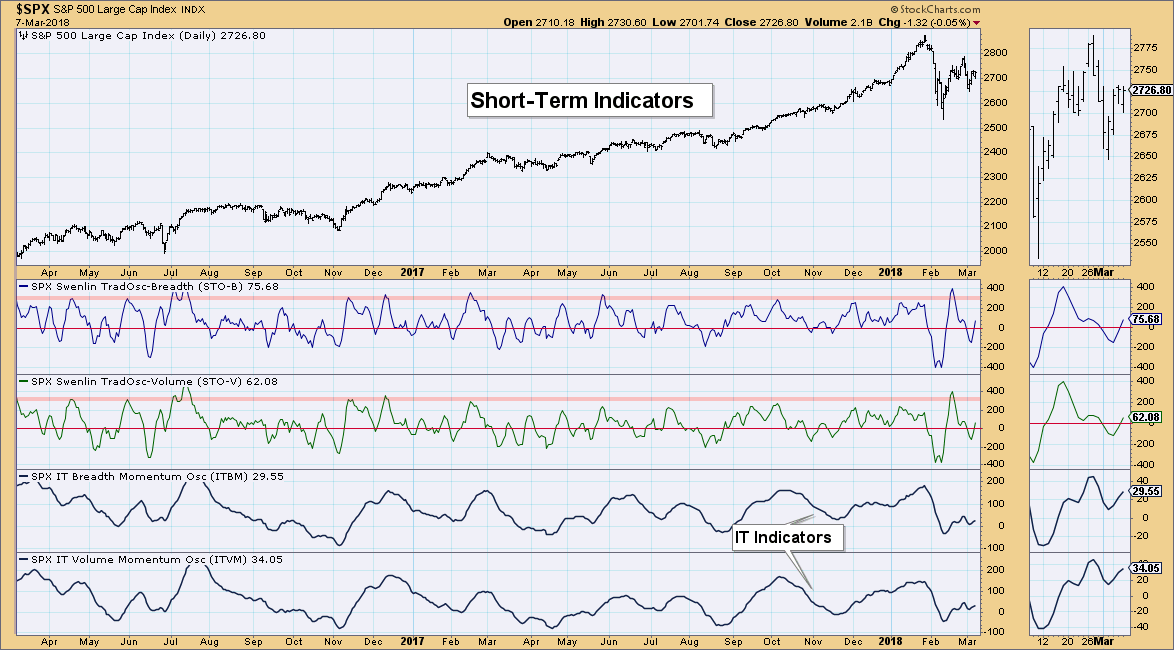
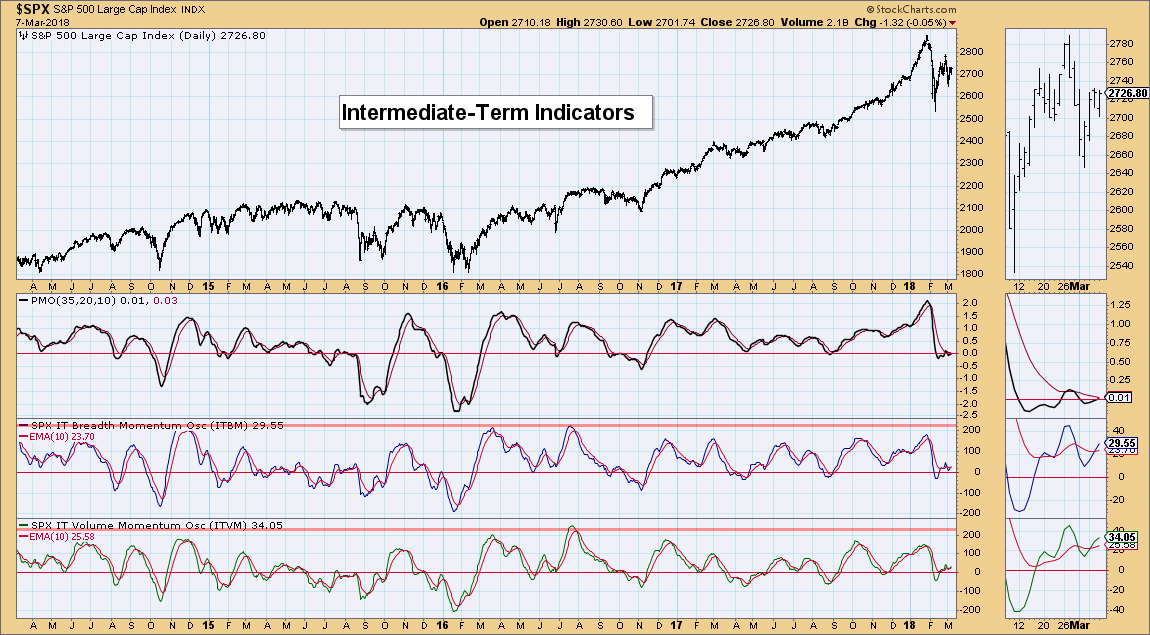
Intermediate-Term Indicators:
I generally look at upside crossovers of the ITBM/ITVM above their signal lines as very bullish. With the indecision and flat readings, I'm more neutral about this chart. If I see readings pop above their previous highs, I'll get bullish. For now, I'll sit in neutral.
Conclusion: Overall I'd say we're looking at mostly neutral charts. While short-term and intermediate-term indicators are currently rising, the IT indicators and PMO seem reluctant to do so. I wish I could offer more here.
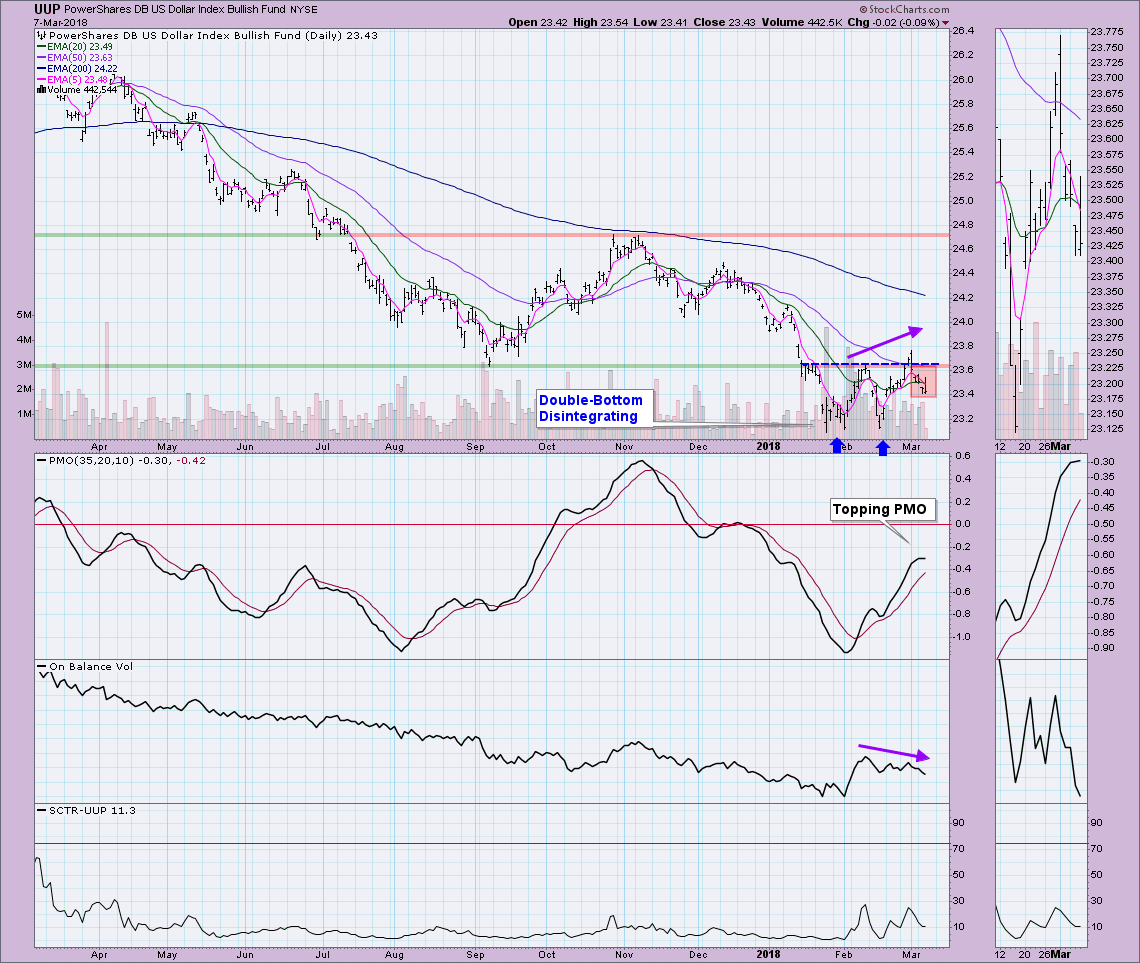
DOLLAR
IT Trend Model: SELL as of 12/21/2017
LT Trend Model: SELL as of 05/24/2017
Well, I guess I may need to give up on looking for a bullish breakout on the Dollar. It appears it will need to go down and test lows again. There was a negative divergence between price and the OBV that suggested this double-bottom could fail. The PMO is topping which doesn't inspire confidence. It appears another test of the 2018 lows are in order. After that, I'll be looking for a triple-bottom since this double-bottom has basically disintegrated.
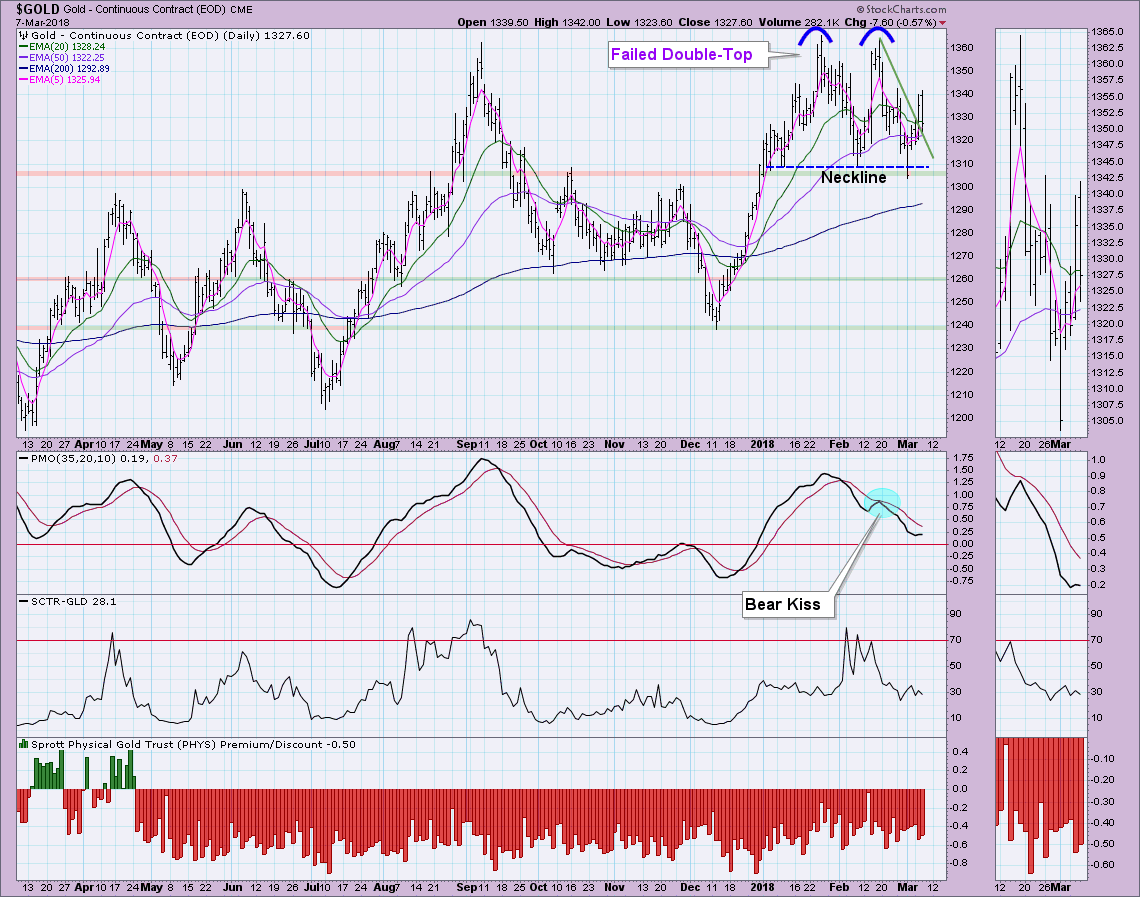
GOLD
IT Trend Model: BUY as of 1/2/2018
LT Trend Model: BUY as of 4/12/2017
With the double-bottom failing on the Dollar, it isn't surprising to see a failed double-top on Gold. They've had a near perfect reverse correlation for some time. The PMO wants to turn up but today's drop stunted it. This possible PMO bottom doesn't get me overly excited. We can see how the previous PMO bottom turned out to be a head fake as price failed once it reached the 1360 level.
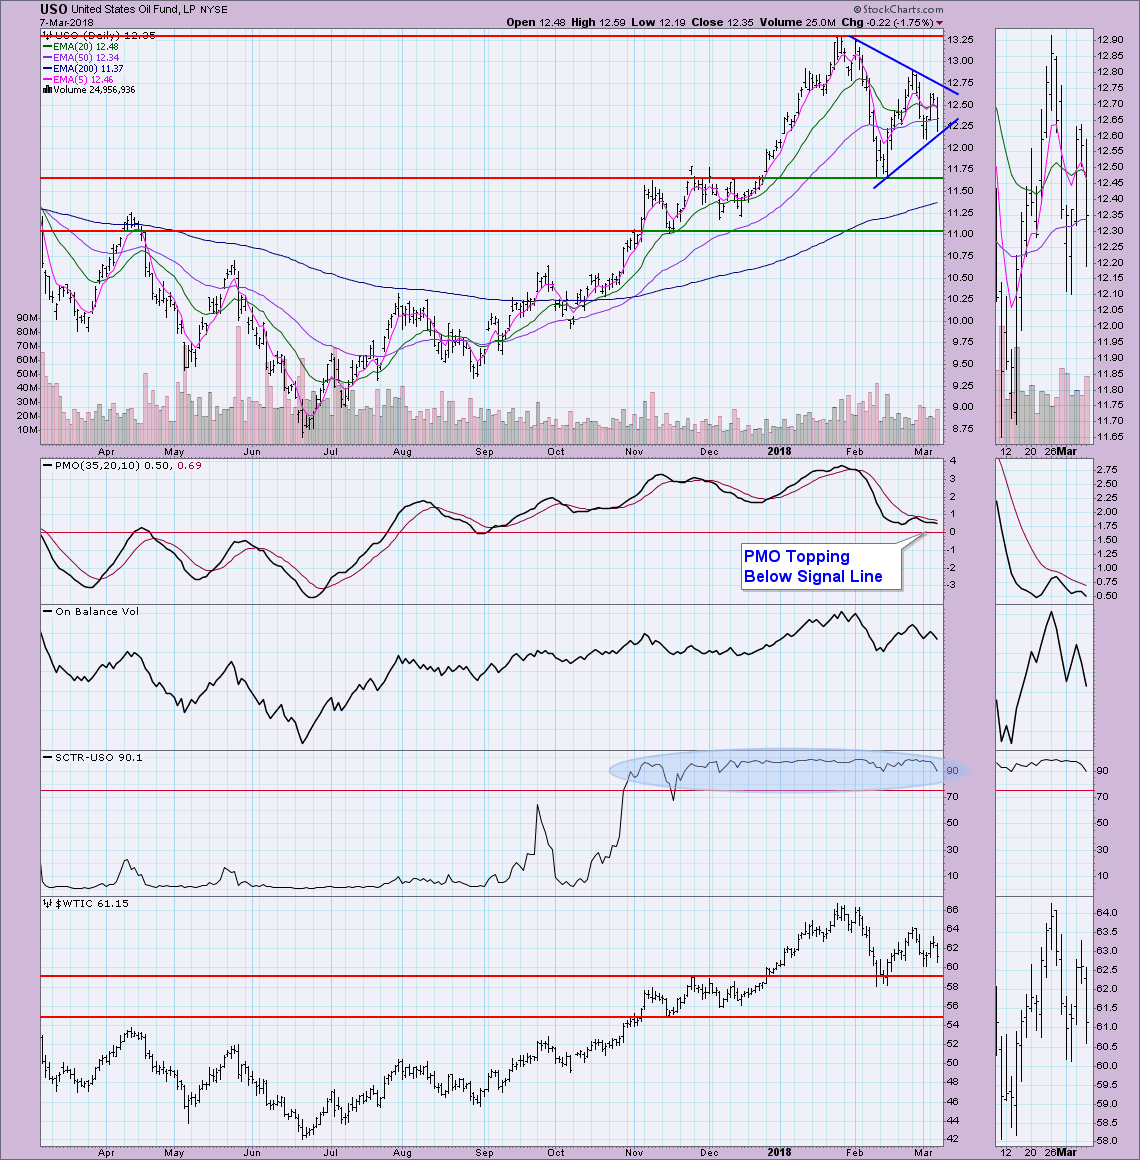
CRUDE OIL (USO)
IT Trend Model: BUY as of 9/7/2017
LT Trend Model: BUY as of 11/2/2017
I see a large symmetrical triangle. This is a continuation pattern and suggests and upside breakout for Oil. While I like the SCTR, I'm less impressed with the PMO which continues to fail to cross above its signal line. The OBV is trending lower. So while the pattern suggests an upside breakout, the indicators aren't as enthusiastic. Likely there will be more volatility and ultimately sideways movement.
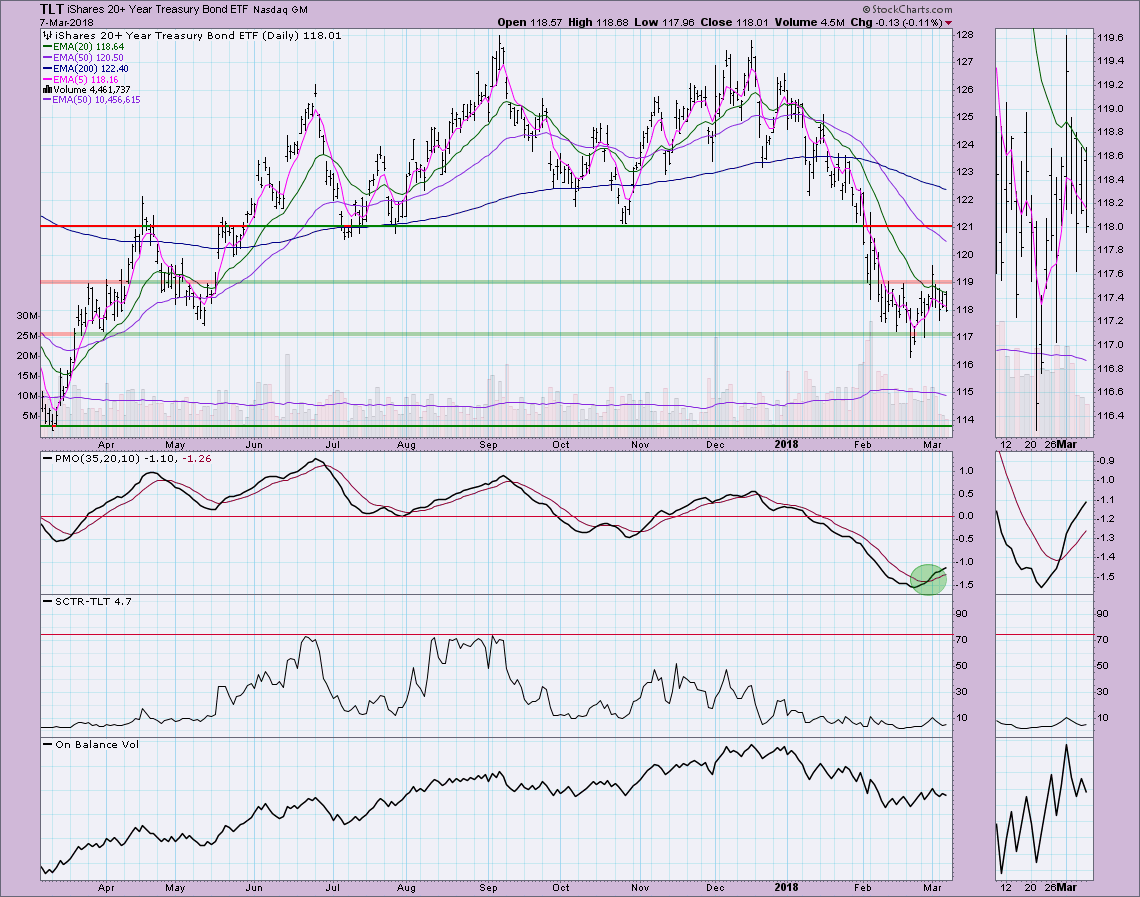
BONDS (TLT)
IT Trend Model: Neutral as of 1/11/2018
LT Trend Model: SELL as of 2/8/2018
There's a bullish V bottom on TLT and a PMO BUY signal to go along with it. The OBV is trending higher which is encouraging. I could see price testing $121 based on the favorable PMO and OBV. Trend Models still suggest caution as TLT has a VERY bearish EMA configuration.
Technical Analysis is a windsock, not a crystal ball.
Happy Charting!
Erin
Helpful DecisionPoint Links:
DecisionPoint Shared ChartList and DecisionPoint Chart Gallery
Price Momentum Oscillator (PMO)
Swenlin Trading Oscillators (STO-B and STO-V)
**Don't miss DecisionPoint Commentary! Add your email below to be notified of new updates"**


