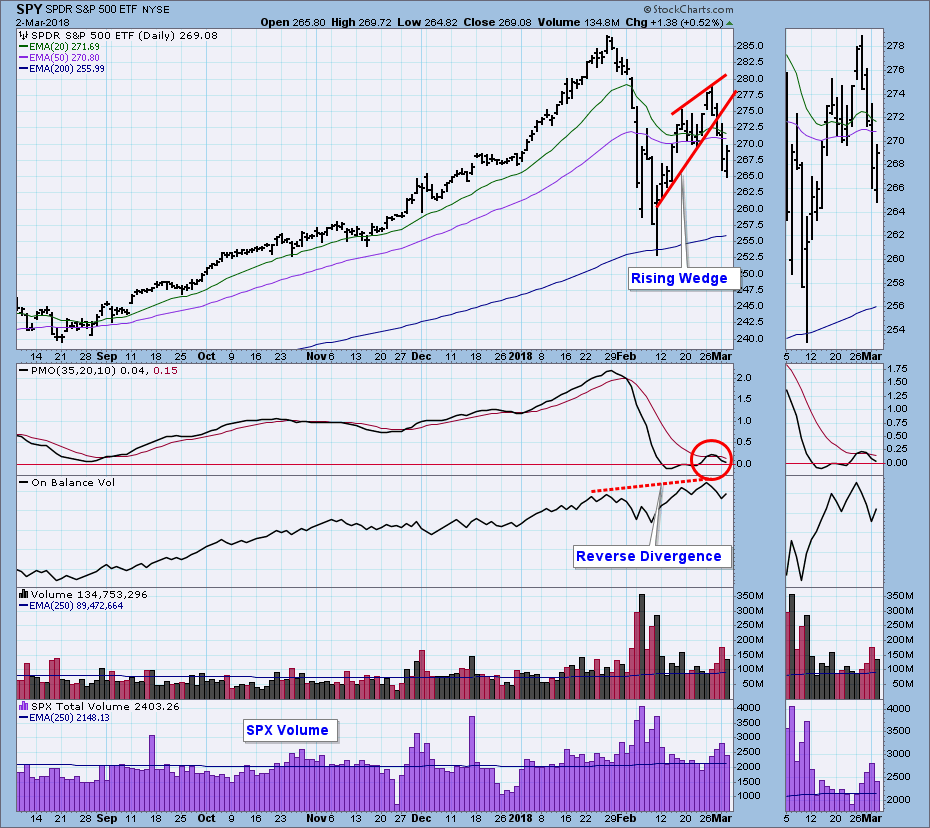
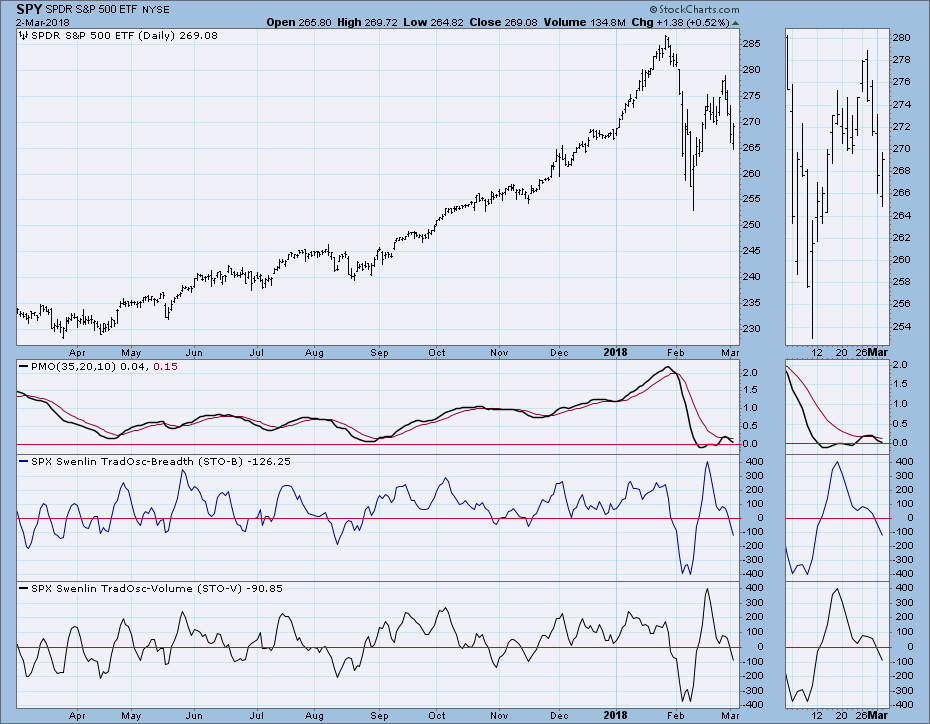
At last Friday's close we were faced with SPY pushing at the top of a bullish flag formation (not annotated). On Monday there was a strong breakout that proved to be a fakeout. On Tuesday price topped and fell back to the top of the flag, and at this point a new formation, a bearish rising wedge, emerged. It is bearish because the rising trend lines on rising wedges are usually too steep to maintain, and the wedge usually resolves downward. The breakdown took place on Wednesday, and the decline continued into Thursday. Friday's intraday reversal hints at a continued bounce next week.
The DecisionPoint Weekly Wrap presents an end-of-week assessment of the trend and condition of the stock market (S&P 500), the U.S. Dollar, Gold, Crude Oil, and Bonds.
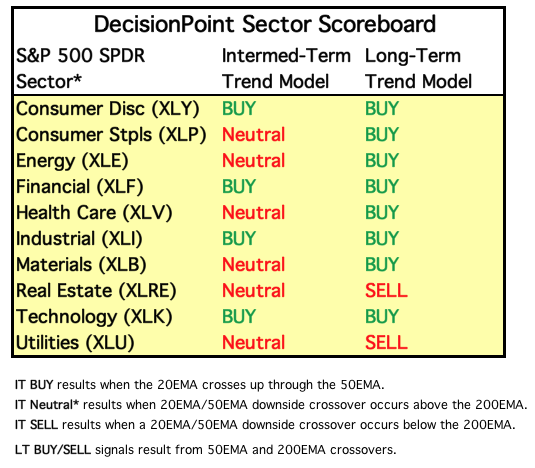
SECTORS
I have added this new section so that we can see a little deeper into the market's condition. Each S&P 500 Index component stock is assigned to one, and only one, of 10 major sectors. This is a snapshot of the Intermediate-Term and Long-Term Trend Model signal status for those sectors, and as you can see, the intermediate-term signals are 60% Neutral. A Neutral signal is a 'soft' SELL signal because the model moves from a BUY to cash or fully hedged, but not short. So, we're seeing weakness in the IT time frame, but Long-Term signals are still 80% bullish.
STOCKS
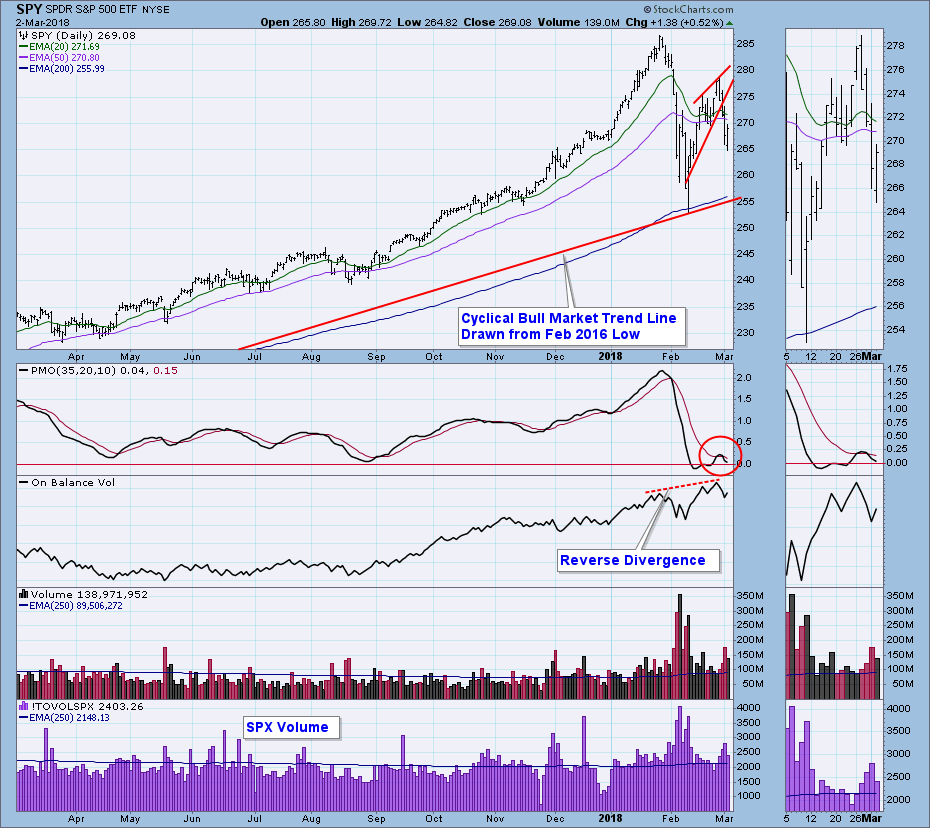
IT Trend Model: BUY as of 11/15/2016
LT Trend Model: BUY as of 4/1/2016
Daily Chart: I should explain why I fudged the bottom of the rising wedge. I should have drawn it from the February low, but I thought that the three-day cluster of lows immediately after the down spike gave a more realistic angle of ascent. The most recent daily PMO top wasn't quite below the signal line, but it was close enough to give the same negative implication.
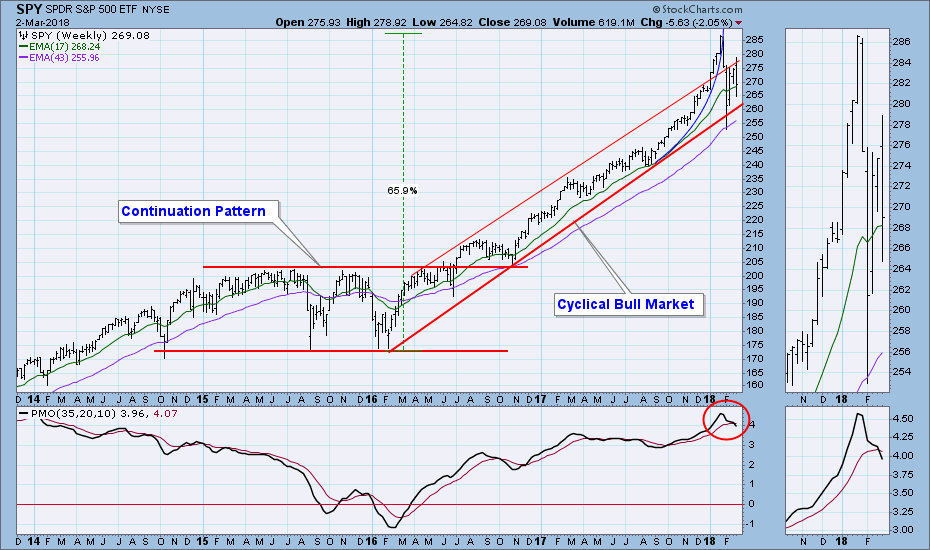
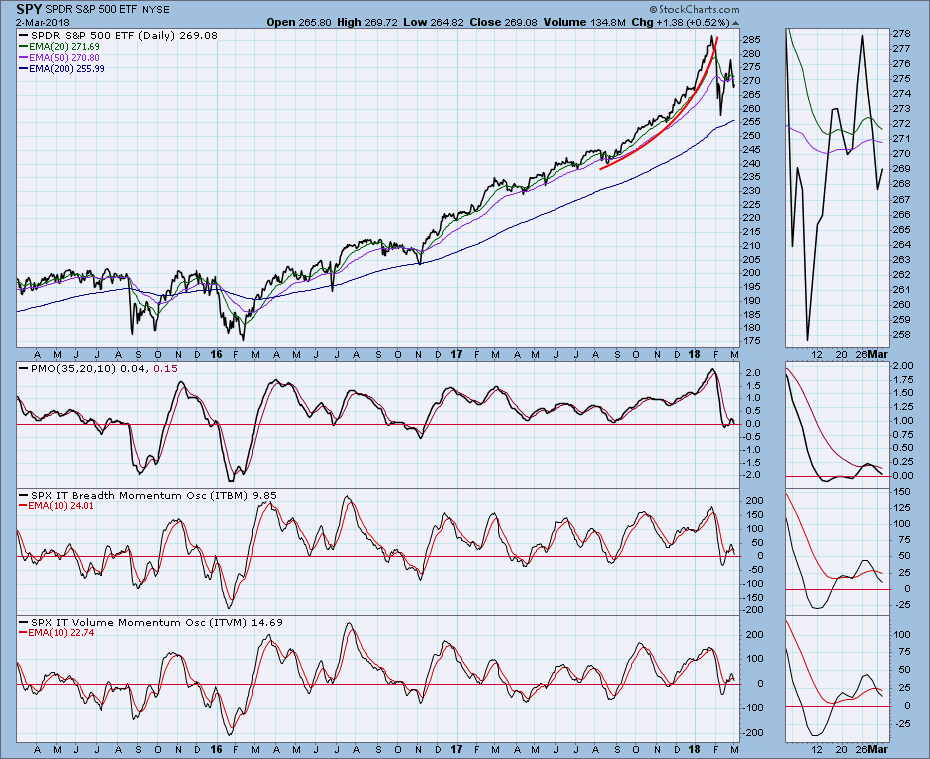
Weekly Chart: There was a strong rally from the 2016 low, and it was capped by a parabolic climax. At the very least the problems of the last five weeks represent the market's efforts to digest that rally that went too far too fast. The weekly PMO has topped and crossed down through its signal line, implying more weakness ahead.
Short-Term Market Indicators: A normal oversold reading on the STO-B and STO-V is about 300 to 400. Considering the February lows, it is possible that we will see similar readings before the current price decline is over.
Intermediate-Term Market Indicators: A normal oversold reading for the ITBM and ITVM is about -200. Considering the current bearish market action, it would seem that we'll be seeing lower readings soon.
Conclusion: While I continue to believe that we are in a bear market, it will take more time before we have enough evidence to be sure. Nevertheless, there can be no question that the character of the market has changed for the worse since last year. A good example of this was the solid looking breakout from the flag formation we had on Monday that failed on Tuesday. This doesn't prove that the bull is dead, but for sure, he's a lot weaker.
Three weeks ago at the February low I expected either a "V" bottom or a retest of the low to occur four to six weeks out. The "V" is no longer an option, but I think the retest is a likely scenario. it could happen next week.
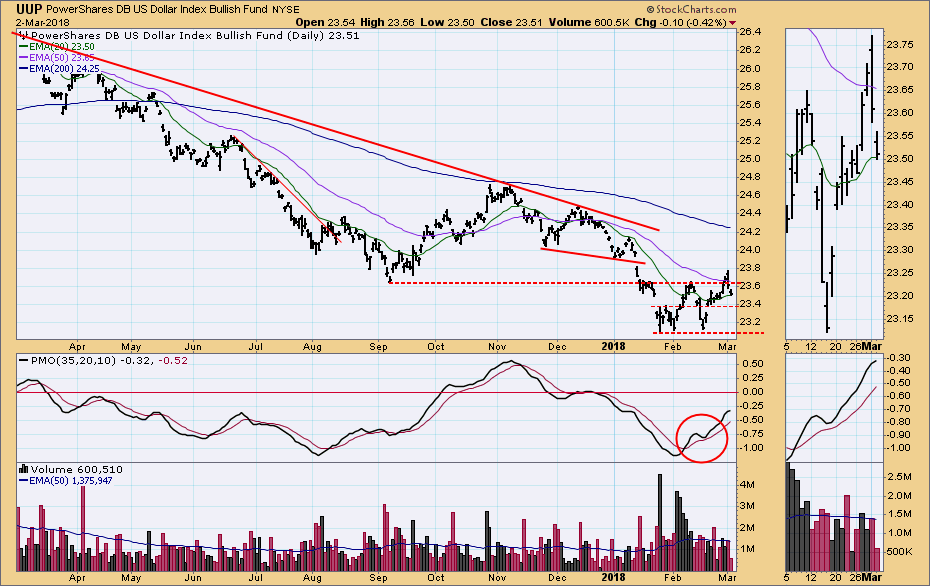
DOLLAR (UUP)
IT Trend Model: SELL as of 12/21/2017
LT Trend Model: SELL as of 5/24/2017
Daily Chart: Still bearish. This week UUP briefly rallied above overhead resistance, but the rally failed.
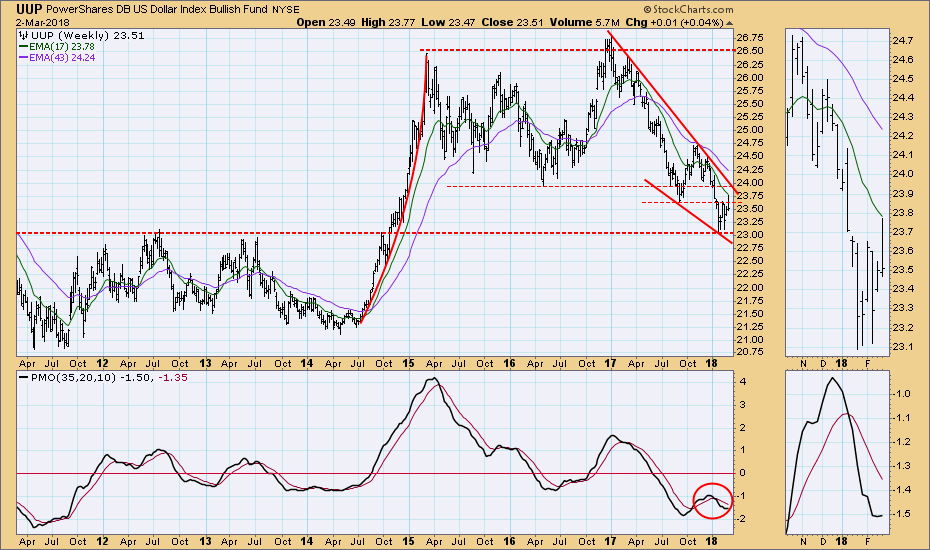
Weekly Chart: We can see that the rally to the top of the falling wedge has failed. Although the weekly PMO has bottomed, I am not encouraged by the price action.
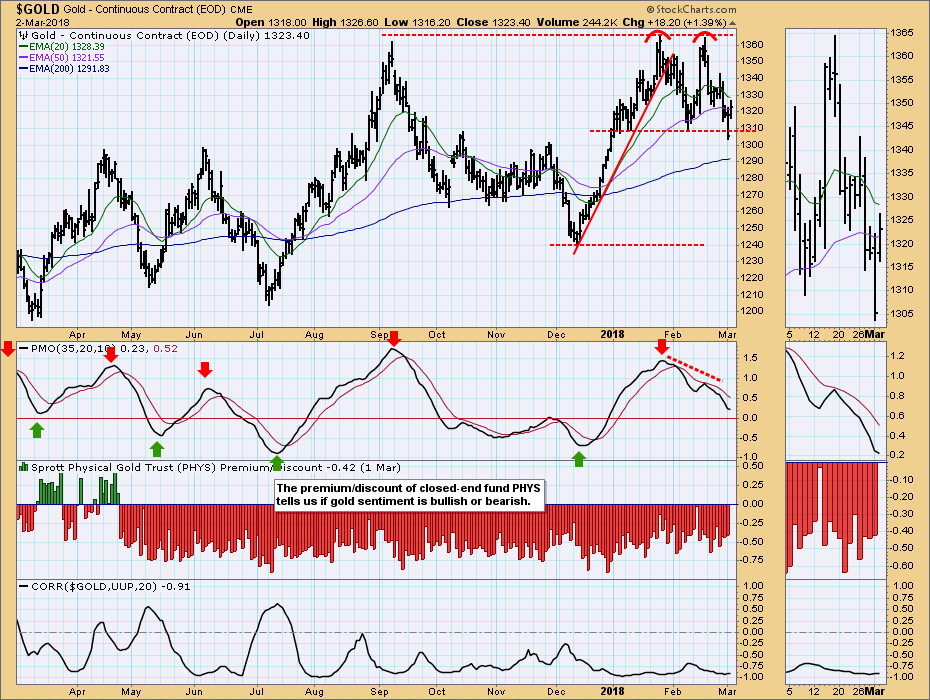
GOLD
IT Trend Model: BUY as of 1/2/2018
LT Trend Model: BUY as of 4/12/2017
Daily Chart: After breaking down from the double top confirmation line on Thursday, gold bounced back above it on Friday. A daily PMO bottom would be encouraging.
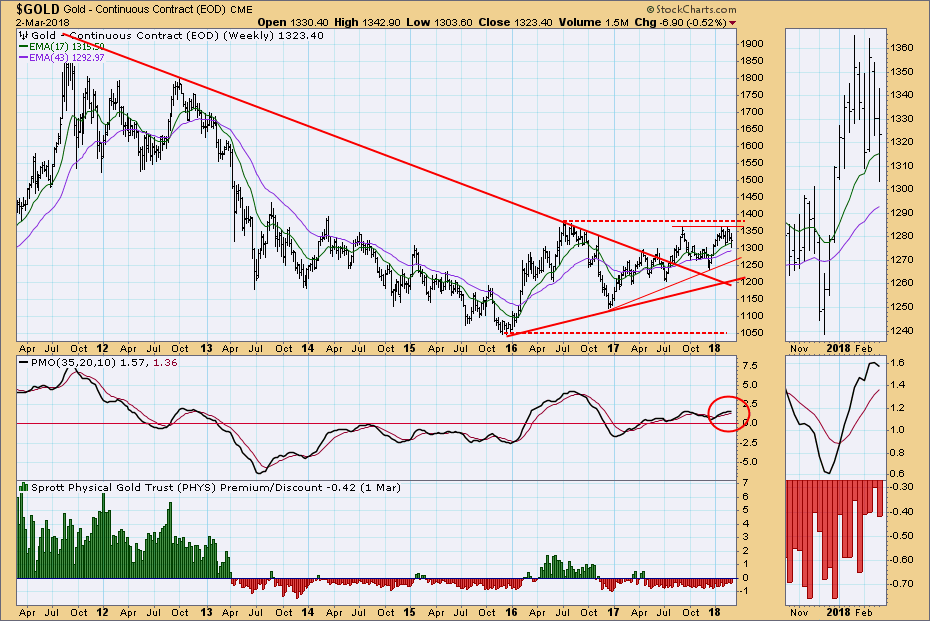
Weekly Chart: The weekly PMO has topped, but it has been fairly neutral since April. The chart is still bullish, but not energetically so.
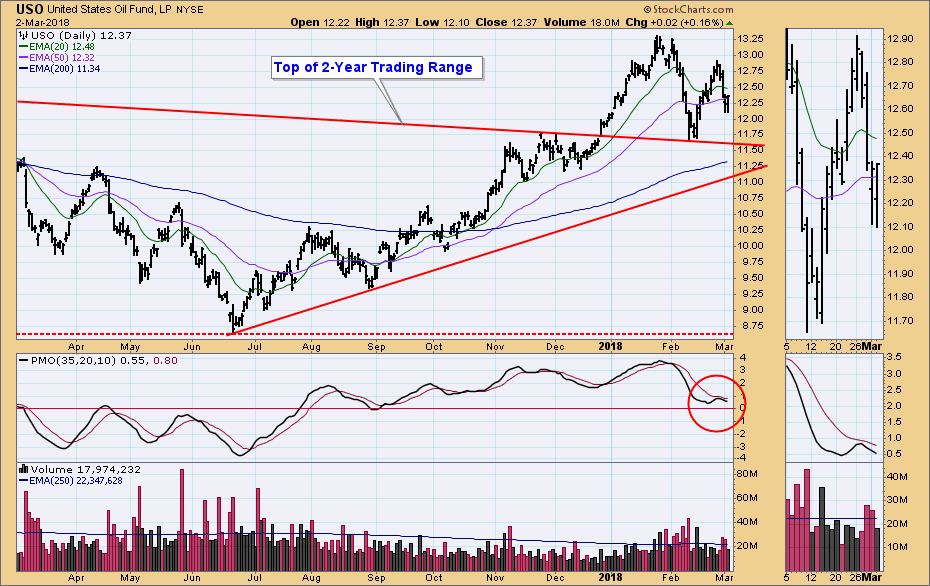
CRUDE OIL (USO)
IT Trend Model: BUY as of 9/6/2017
LT Trend Model: BUY as of 11/2/2017
Daily Chart: In December USO broke above a declining tops line and rallied. It subsequently pulled back to that line and bounced. Unfortunately, the bounce fizzled, and price seems to be headed down again. The PMO has topped below its signal line, which is bearish.
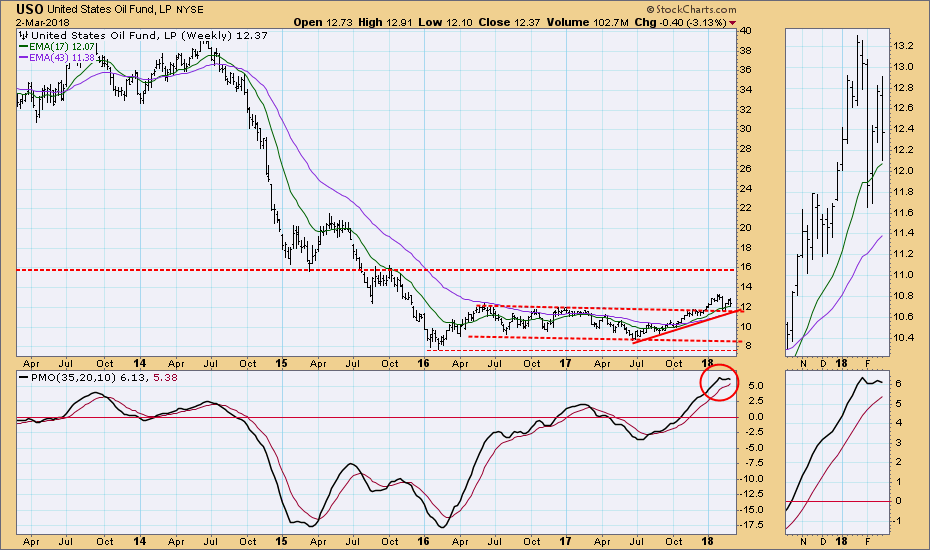
Weekly Chart: The biggest problem in this time frame is that the weekly PMO is topping in very overbought territory. On a positive note, the rising trend line drawn from the June low is still intact.
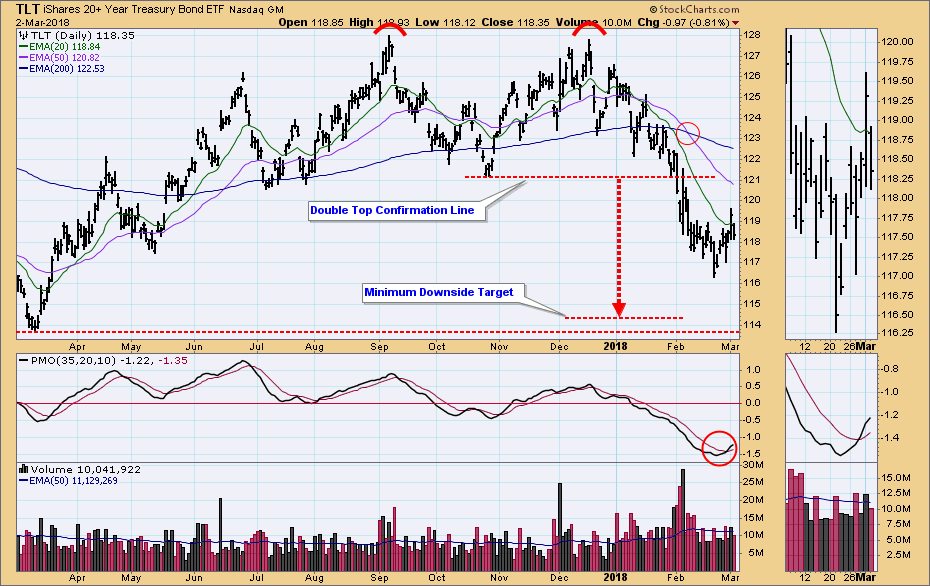
BONDS (TLT)
IT Trend Model: NEUTRAL as of 1/11/2018
LT Trend Model: SELL as of 2/8/2018
Daily Chart: TLT has formed a price bottom, which is confirmed by the PMO.
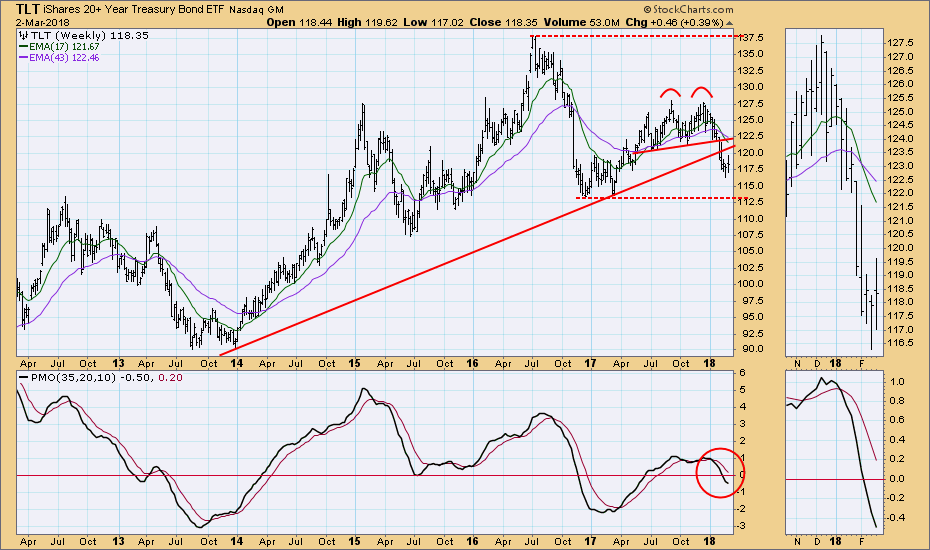
Weekly Chart: Still bearish. Having broken down through a long-term trend line, it appears that TLT is engaged in a technical snapback toward the point of breakdown.
**Don't miss any of the DecisionPoint commentaries! Go to the "Notify Me" box toward the end of this blog page to be notified as soon as they are published.**
Technical Analysis is a windsock, not a crystal ball.
Happy Charting!
- Carl
NOTE: The signal status reported herein is based upon mechanical trading model signals, specifically, the DecisionPoint Trend Model. They define the implied bias of the price index based upon moving average relationships, but they do not necessarily call for a specific action. They are information flags that should prompt chart review. Further, they do not call for continuous buying or selling during the life of the signal. For example, a BUY signal will probably (but not necessarily) return the best results if action is taken soon after the signal is generated. Additional opportunities for buying may be found as price zigzags higher, but the trader must look for optimum entry points. Conversely, exit points to preserve gains (or minimize losses) may be evident before the model mechanically closes the signal.
Helpful DecisionPoint Links:
DecisionPoint Shared ChartList and DecisionPoint Chart Gallery
Price Momentum Oscillator (PMO)
Swenlin Trading Oscillators (STO-B and STO-V)


