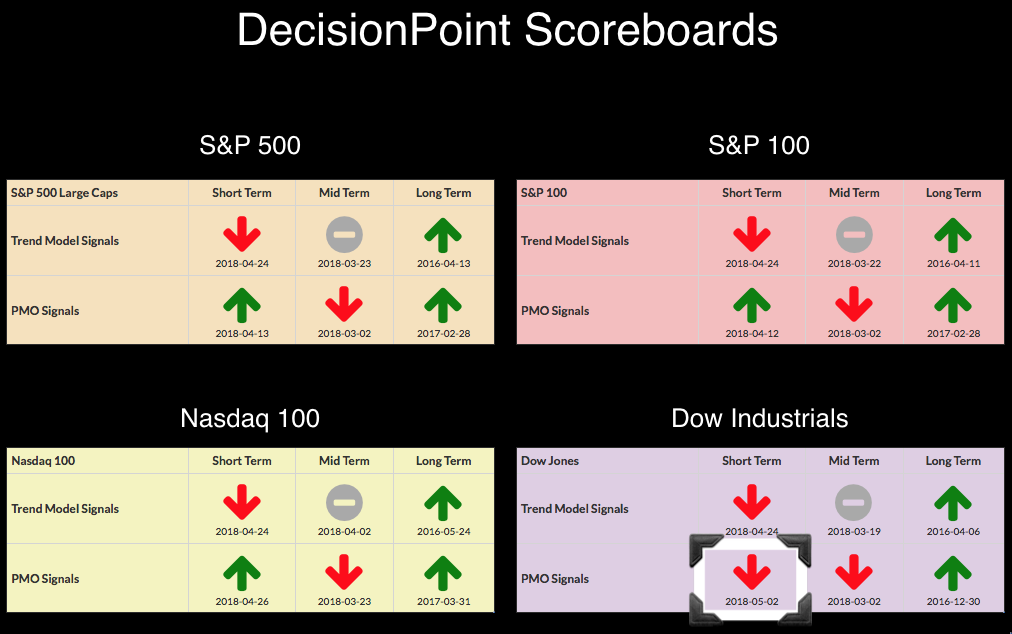
 As noted in the signal table below, the Dow logged a new Price Momentum Oscillator (PMO) SELL signal. I've included the chart below with commentary. The other important news is two new negative divergences showing on the DP indicator charts for the short term and intermediate term! And, no surprise to most, Gold logged a new Intermediate-Term Trend Model (ITTM) Neutral signal. With the huge breakout in the Dollar and a near perfect negative correlation between Gold and the Dollar, this decline in Gold was telegraphed awhile ago.
The DecisionPoint Alert presents today's assessment of the trend and condition of the stock market (S&P 500), the U.S. Dollar, Gold, Crude Oil, and Bonds.
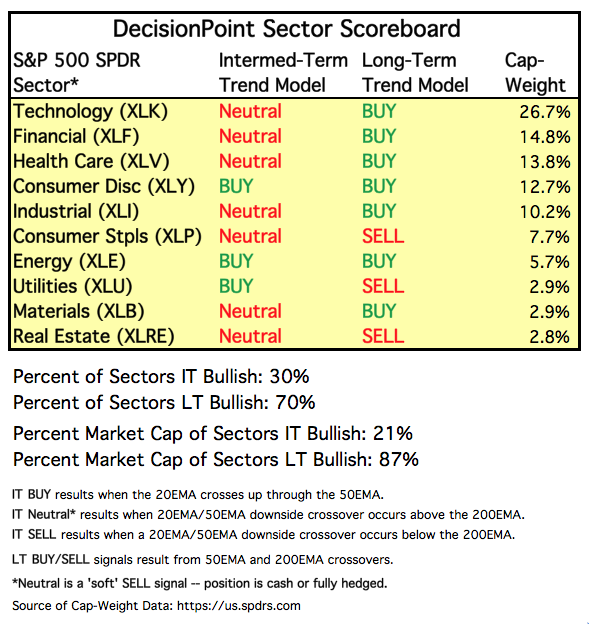
SECTORS
Each S&P 500 Index component stock is assigned to one, and only one, of 10 major sectors. This is a snapshot of the Intermediate-Term and Long-Term Trend Model signal status for those sectors.
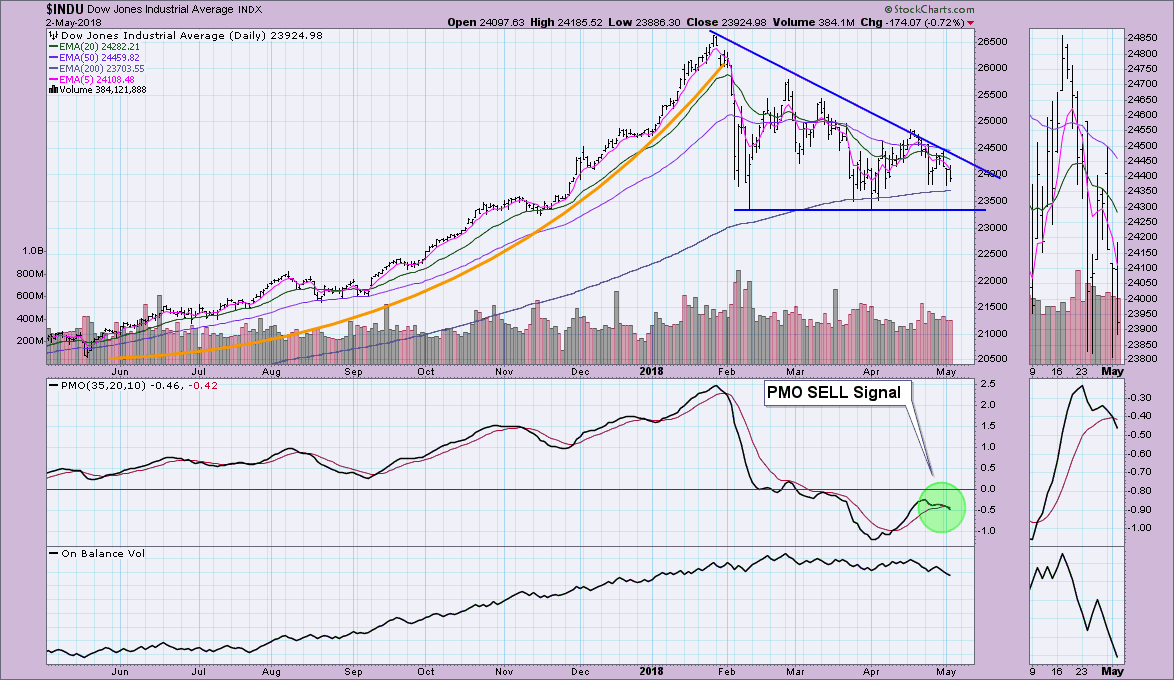
The new PMO SELL signal on the Dow triggered when the PMO dipped below its signal line. I expect to see the same signal appear on the other three Scoreboards soon. The descending triangle on the Dow suggests we will see a breakdown when price tests support. The 200-EMA is holding up as support for now, but if that is broken I suspect we're in bear market mode.
STOCKS
IT Trend Model: NEUTRAL as of 3/23/2018
LT Trend Model: BUY as of 4/1/2016
SPY Daily Chart:
As far as the SPY, I don't see the same descending triangle. It looks more like a symmetrical triangle; and while that is a continuation pattern which might suggest the rally will continue with an upside breakout above the declining tops line, I don't think we'll see an upside breakout yet. Why? Note that the PMO is preparing for a negative crossover SELL signal. Read on for more answers to "why".
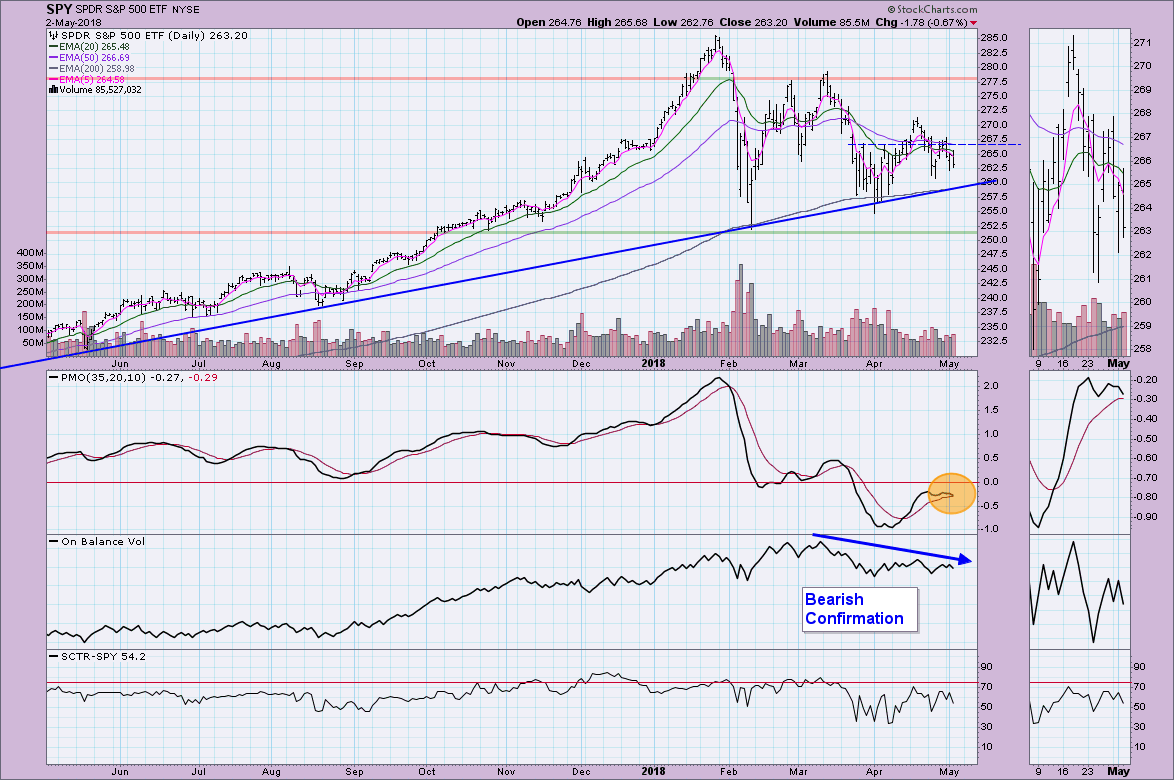
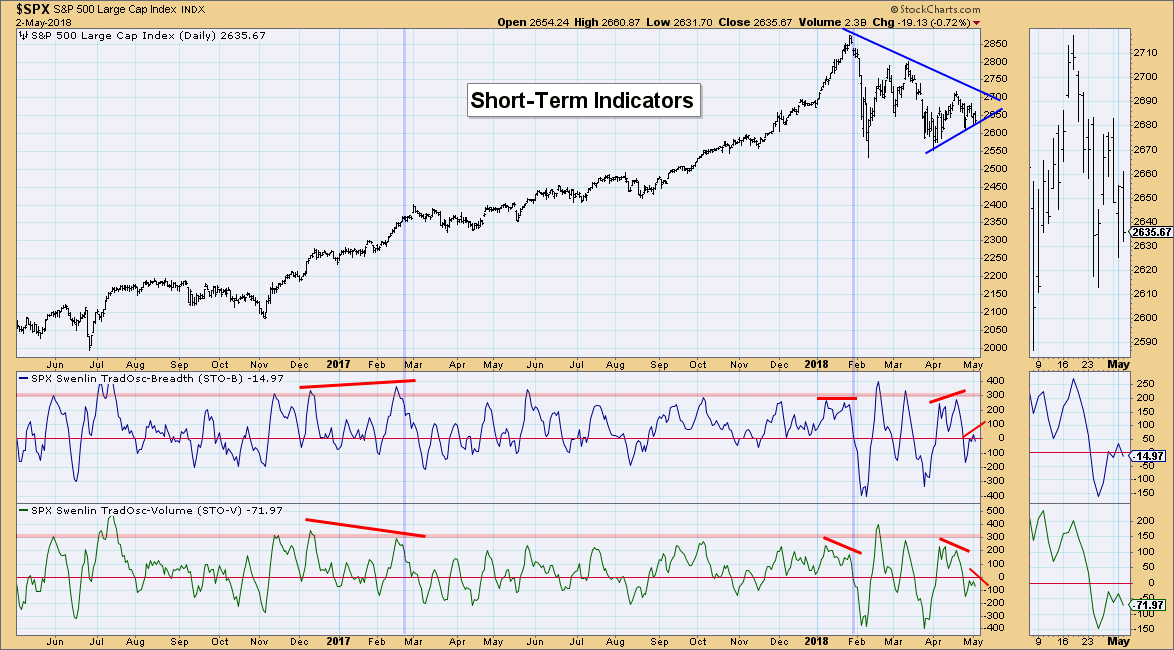
Short-Term Market Indicators: I've pointed out a several times this year where we have had negative divergences between the STO-B and the STO-V. When you see the volume indicator not make higher tops with the breadth indicator, it tells us that volume is not supporting price action. I've not seen these divergences in previous years and certainly not three times in less than 5 months! They seem to be quite prescient, so I'd pay attention.
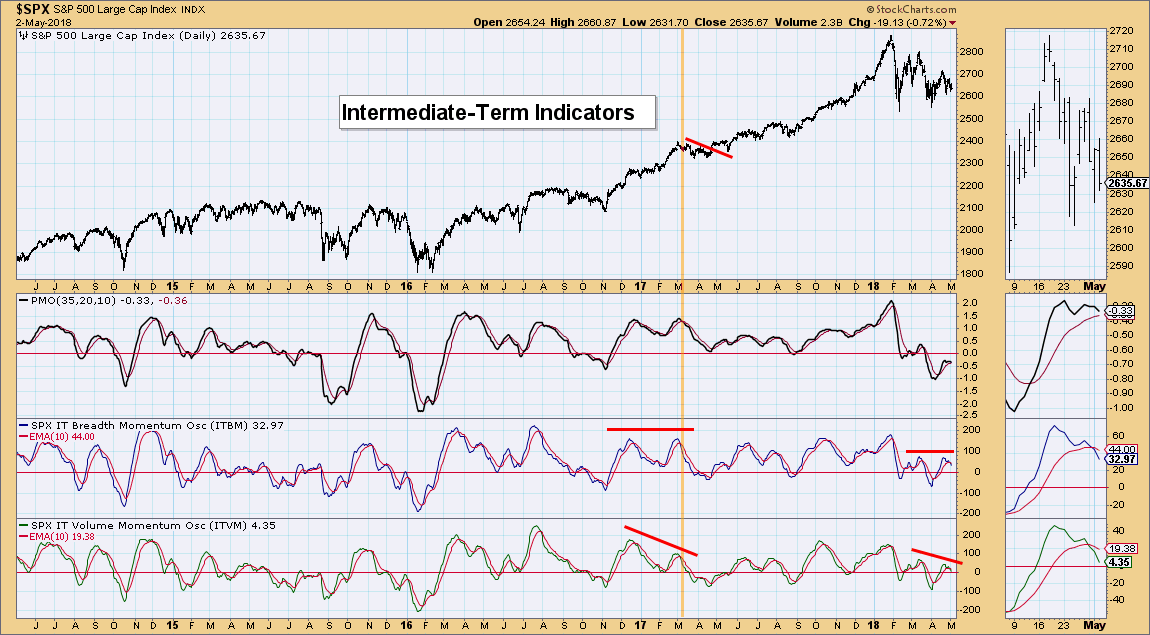
Intermediate-Term Market Indicators: The STOs are not the only indicators showing a negative divergence. The volume indicator, ITVM, is showing a negative divergence with the breadth indicator, ITBM. This indicates that volume in the intermediate term is not leading price or that volume isn't supporting rallies.
Conclusion: With negative divergences showing in both the short and intermediate terms, I have to say we should expect more downside. Tom McClellan was a guest on MarketWatchers LIVE today (replays are available on the StockCharts YouTube channel) and he continues to believe we are in for more downside until late August. His data was very compelling and nearly pulled me completely over to the "bear market" side. For now, I'm still straddling the line but am definitely leaning more bearish.
DOLLAR (UUP)
IT Trend Model: BUY as of 4/24/2018
LT Trend Model: SELL as of 5/24/2017
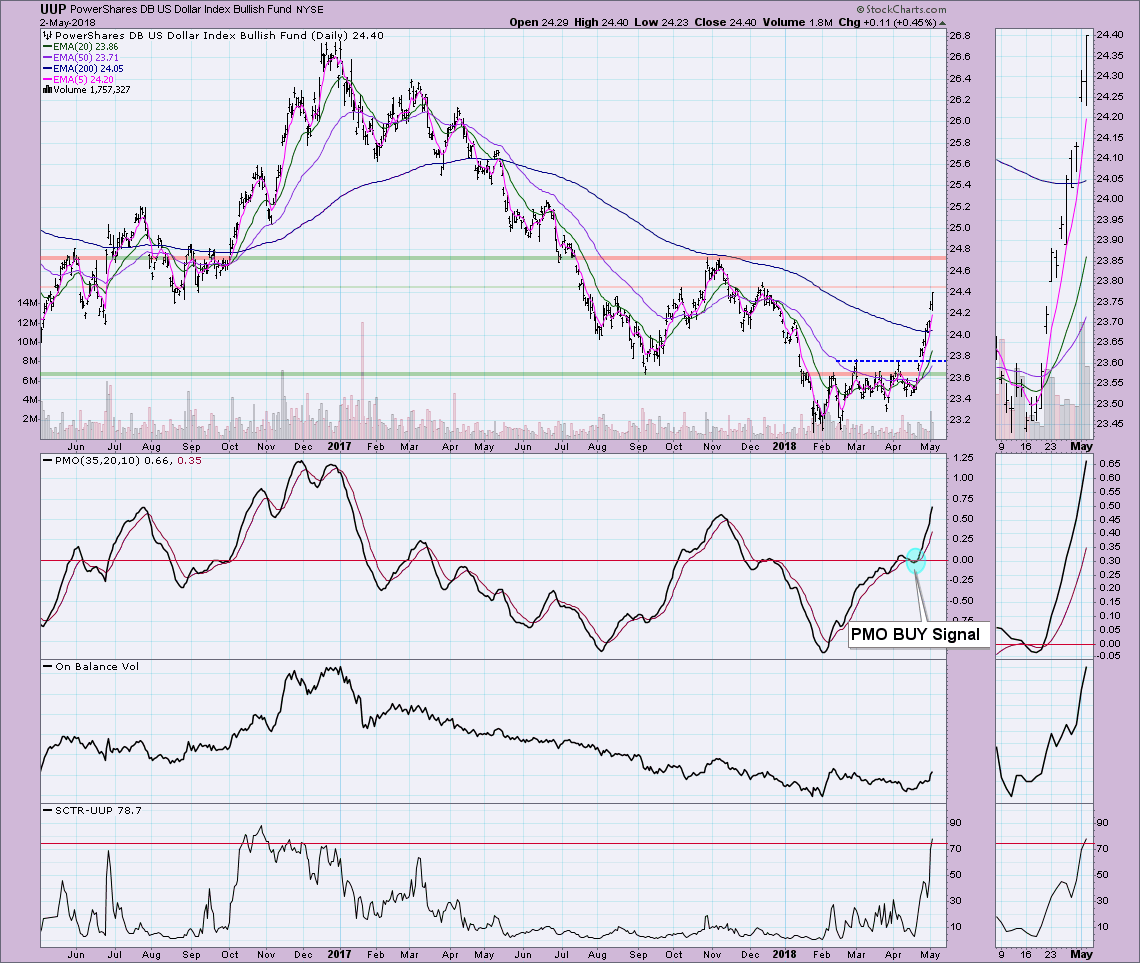
UUP Daily Chart:
The Dollar is finally soaring and appears headed toward a test of November high at $24.75. The PMO on a one-year chart appears very overbought, but as you can when you stretch it out to two years, it isn't as overbought as it might appear. I think there is plenty of room for it to move higher before getting to overbought extremes. I suspect we will see a pullback on UUP, but since breaking out, it hasn't looked back. I'm still bullish the Dollar.
GOLD
IT Trend Model: Neutral as of 5/2/2018
LT Trend Model: BUY as of 4/12/2017
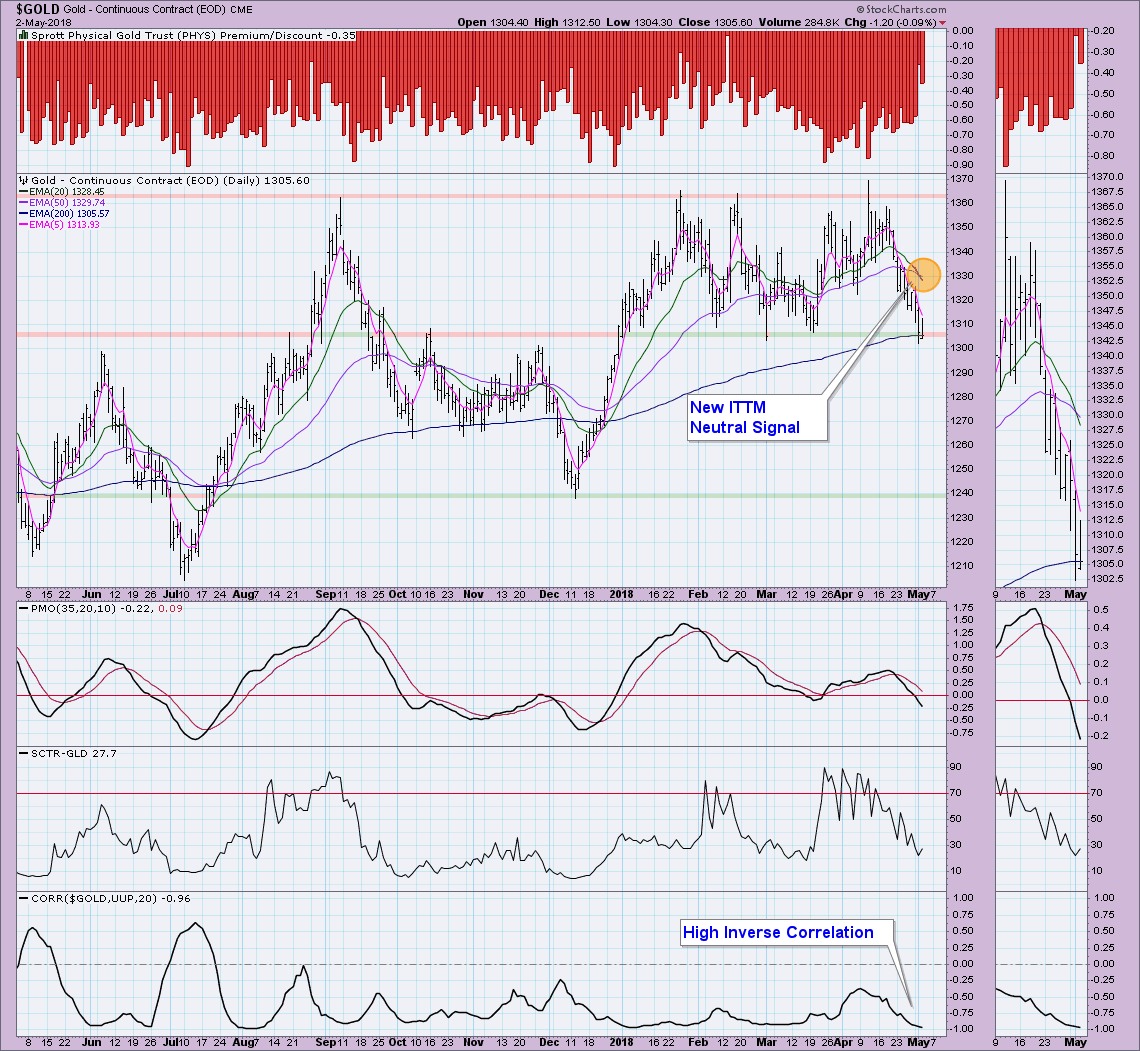
GOLD Daily Chart:
As headlined, Gold generated a new ITTM Neutral signal today when the 20-EMA crossed below the 50-EMA. It was a "Neutral" signal and not a "SELL" signal because the 50-EMA was above the 200-EMA. If the 50-EMA is greater than the 200-EMA, that suggests a bullish bias. So far Gold is holding support along the 2018 lows and the 200-EMA. I don't think that will hold. Note that the correlation between the Dollar and Gold is at -0.96. This is a near perfect negative correlation which suggest if the Dollar is going to rally, then Gold is going to tank. I don't see anything bullish here, so look for support to be broken very soon.
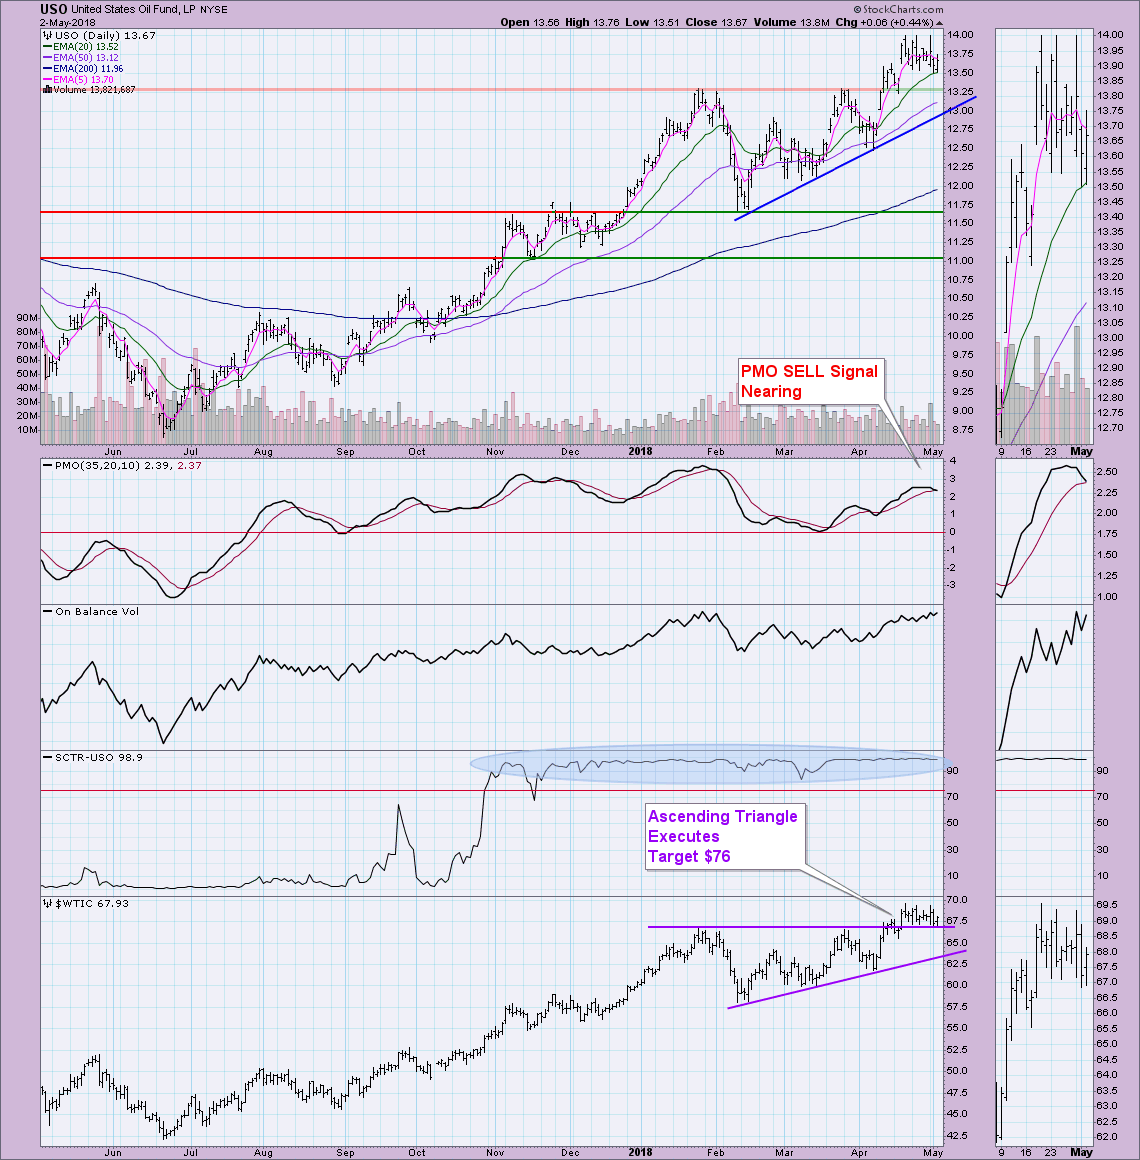
CRUDE OIL (USO)
IT Trend Model: BUY as of 9/6/2017
LT Trend Model: BUY as of 11/2/2017
USO Daily Chart:
USO and $WTIC have been taking a pause within a strong rising trend. I suspect we are seeing some consolidation. Support for $WTIC is holding, but I do see a PMO SELL signal lining up. I believe that is a function of this pause. There is VERY strong support at $13.25 for USO. That area lines up not only with two major tops, but also with the rising bottoms trendline. I suspect that will be tested, but I also suspect it will pass the test.
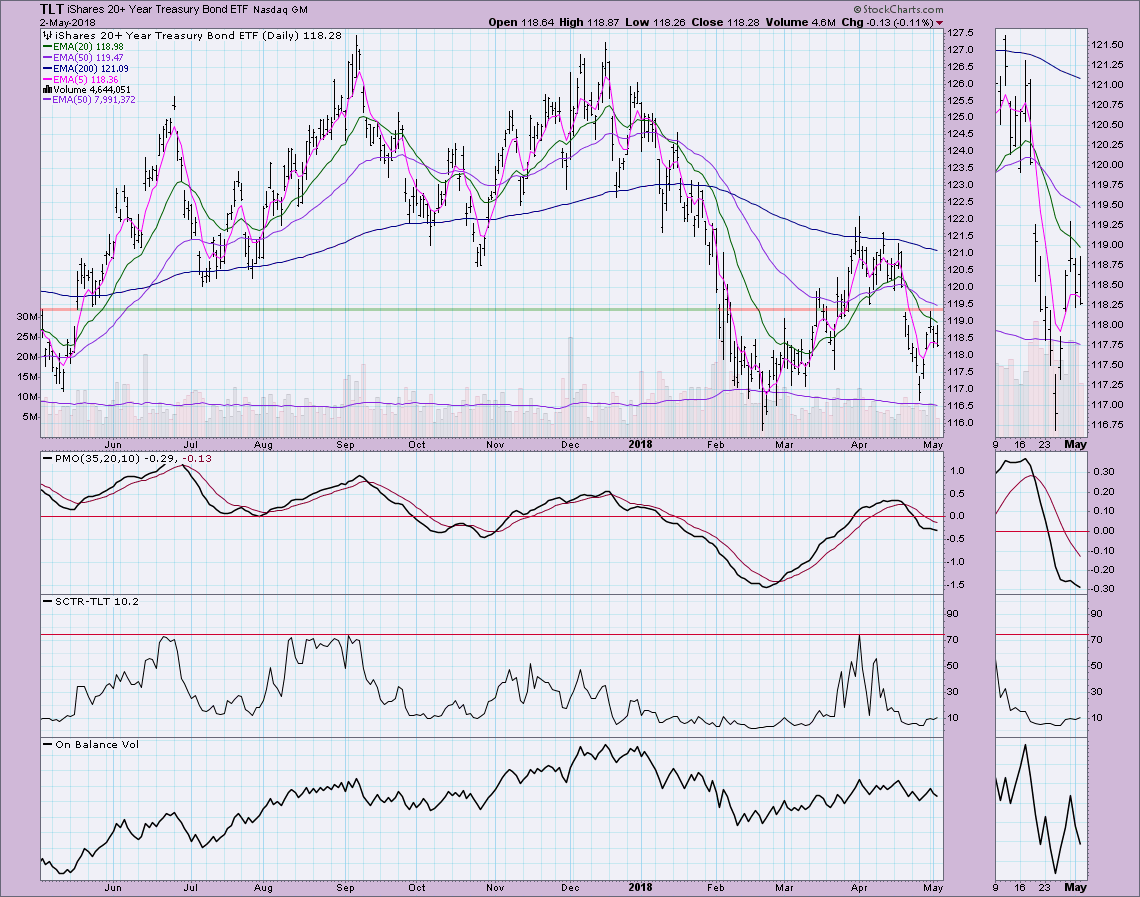
BONDS (TLT)
IT Trend Model: SELL as of 4/20/2018
LT Trend Model: SELL as of 2/8/2018
TLT Daily Chart:
Hmmmm, something stinks in here...oh wait, it's the TLT daily chart! It wasn't surprising to see overhead resistance hold at the gap. I don't see anything positive here. Expect more downside.
Technical Analysis is a windsock, not a crystal ball.
Happy Charting!
- Erin
**Don't miss any of the DecisionPoint commentaries! Go to the "Notify Me" box toward the end of this blog page to be notified as soon as they are published.**
NOTE: The signal status reported herein is based upon mechanical trading model signals, specifically, the DecisionPoint Trend Model. They define the implied bias of the price index based upon moving average relationships, but they do not necessarily call for a specific action. They are information flags that should prompt chart review. Further, they do not call for continuous buying or selling during the life of the signal. For example, a BUY signal will probably (but not necessarily) return the best results if action is taken soon after the signal is generated. Additional opportunities for buying may be found as price zigzags higher, but the trader must look for optimum entry points. Conversely, exit points to preserve gains (or minimize losses) may be evident before the model mechanically closes the signal.
Helpful DecisionPoint Links:
DecisionPoint Shared ChartList and DecisionPoint Chart Gallery
Price Momentum Oscillator (PMO)
Swenlin Trading Oscillators (STO-B and STO-V)


