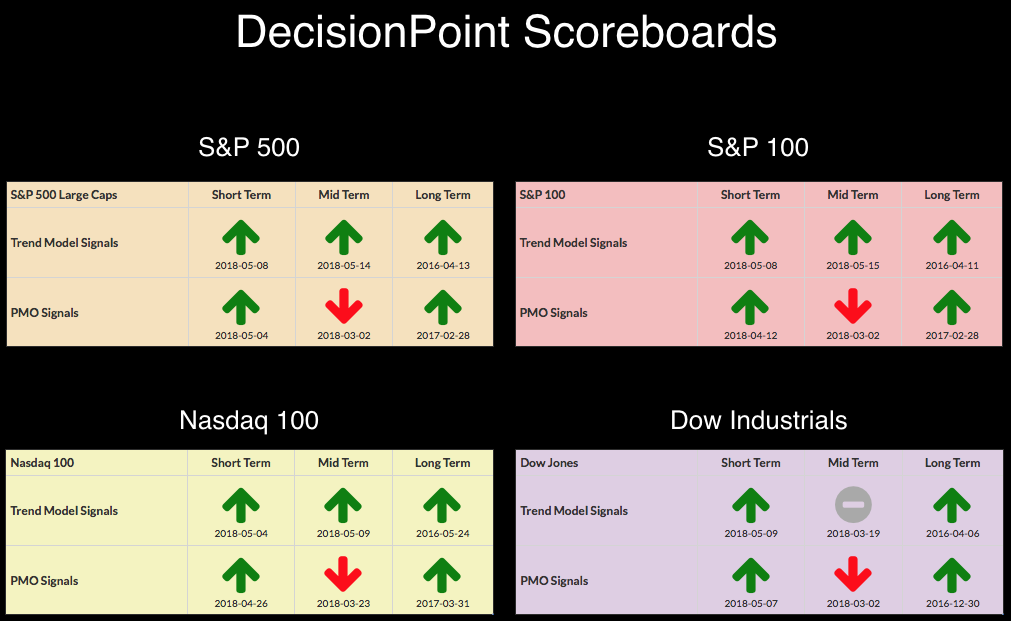
 There still may be some growing pains to endure, but seeing Intermediate-Term Trend Model BUY signals beginning to populate the DP Scoreboards for the first time since March. The Dow should be joining the ITTM BUY signal party very soon. I was surprised it didn't trigger today, but apparently the +0.25% rally wasn't quite enough.
The DecisionPoint Weekly Wrap presents an end-of-week assessment of the trend and condition of the stock market (S&P 500), the U.S. Dollar, Gold, Crude Oil, and Bonds.
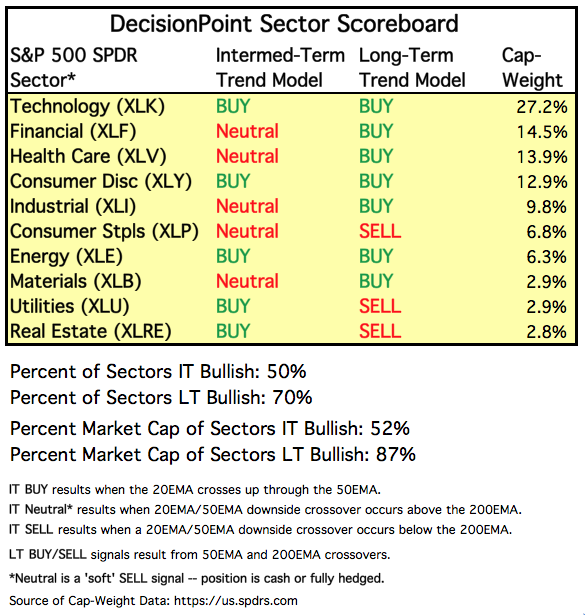
SECTORS
Each S&P 500 Index component stock is assigned to one, and only one, of 10 major sectors. This is a snapshot of the Intermediate-Term and Long-Term Trend Model signal status for those sectors.
STOCKS
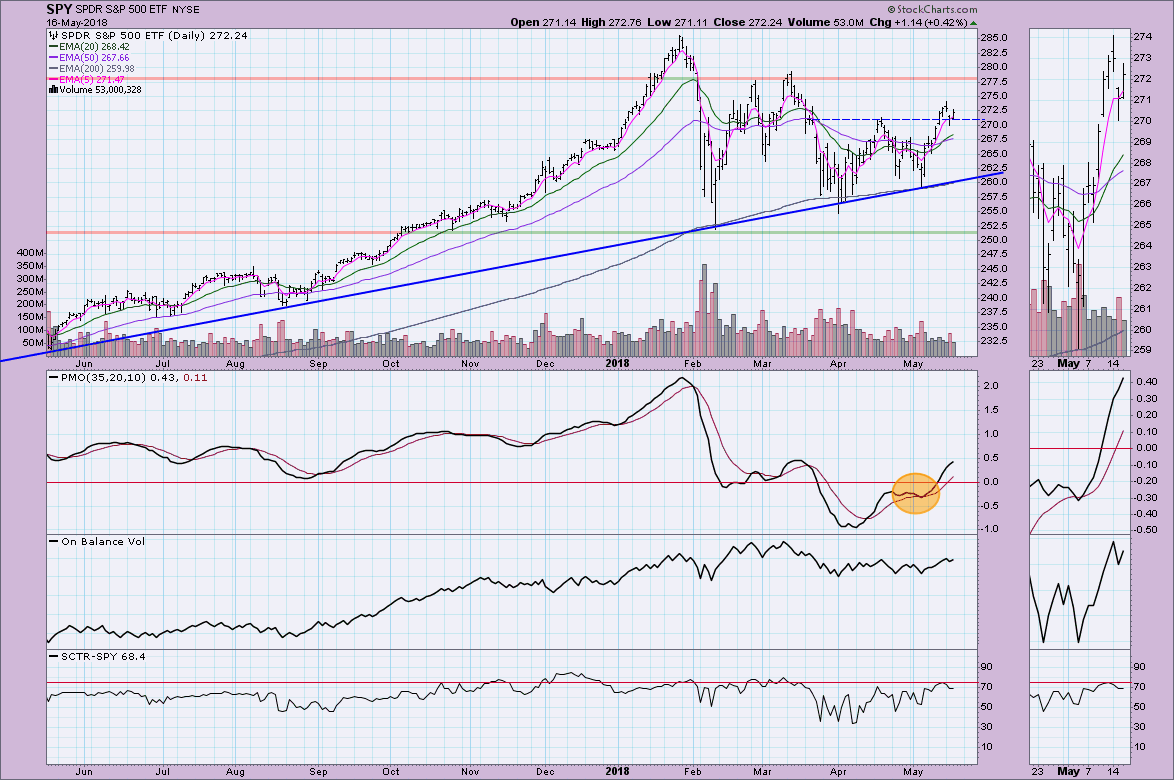
IT Trend Model: NEUTRAL as of 3/23/2018
LT Trend Model: BUY as of 4/1/2016
SPY Daily Chart: I'm very encouraged by the new ITTM Buy signal and I do note that the PMO is back into positive territory. We are seeing some deceleration in the PMO, but that is a normal reaction to the recent pause. Price is holding onto support at the April top and OBV is rising nicely without much pullback on the declines.
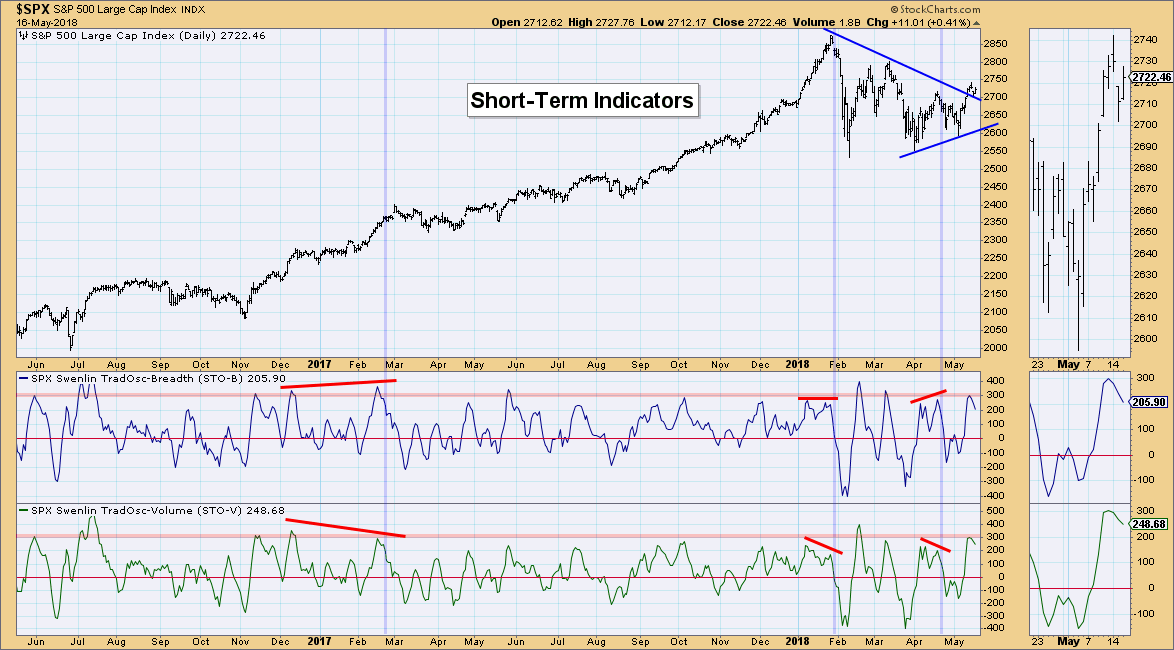
Short-Term Market Indicators: These indicators are what I rest my title on. These indicators need to unwind and the best way for that to happen is a decline. In 2017 I'd be looking for consolidation, but we are in correction mode and last time we were in parabolic rally mode. I'd like to see price maintain above the declining tops trendline as it falls.
Intermediate-Term Market Indicators: These indicators are suggesting a bull market rally conclusion to this last bottom. Both ITBM and ITVM have crossed above declining tops and continue higher. They are in neutral territory, so there is plenty of upside potential.
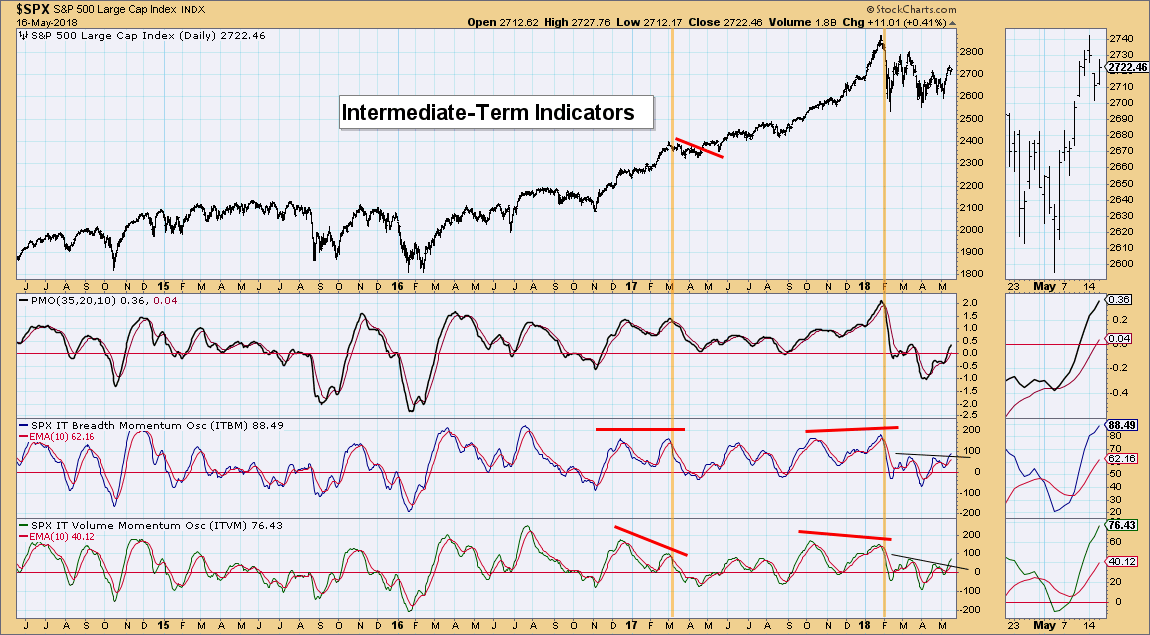
Conclusion: I continue to hesitate regarding calling the end of the correction or possible bear market mainly because short-term indicators suggest a bit more weakness and I want to see how low it will go before I set up shop in the bull market camp again.
DOLLAR (UUP)
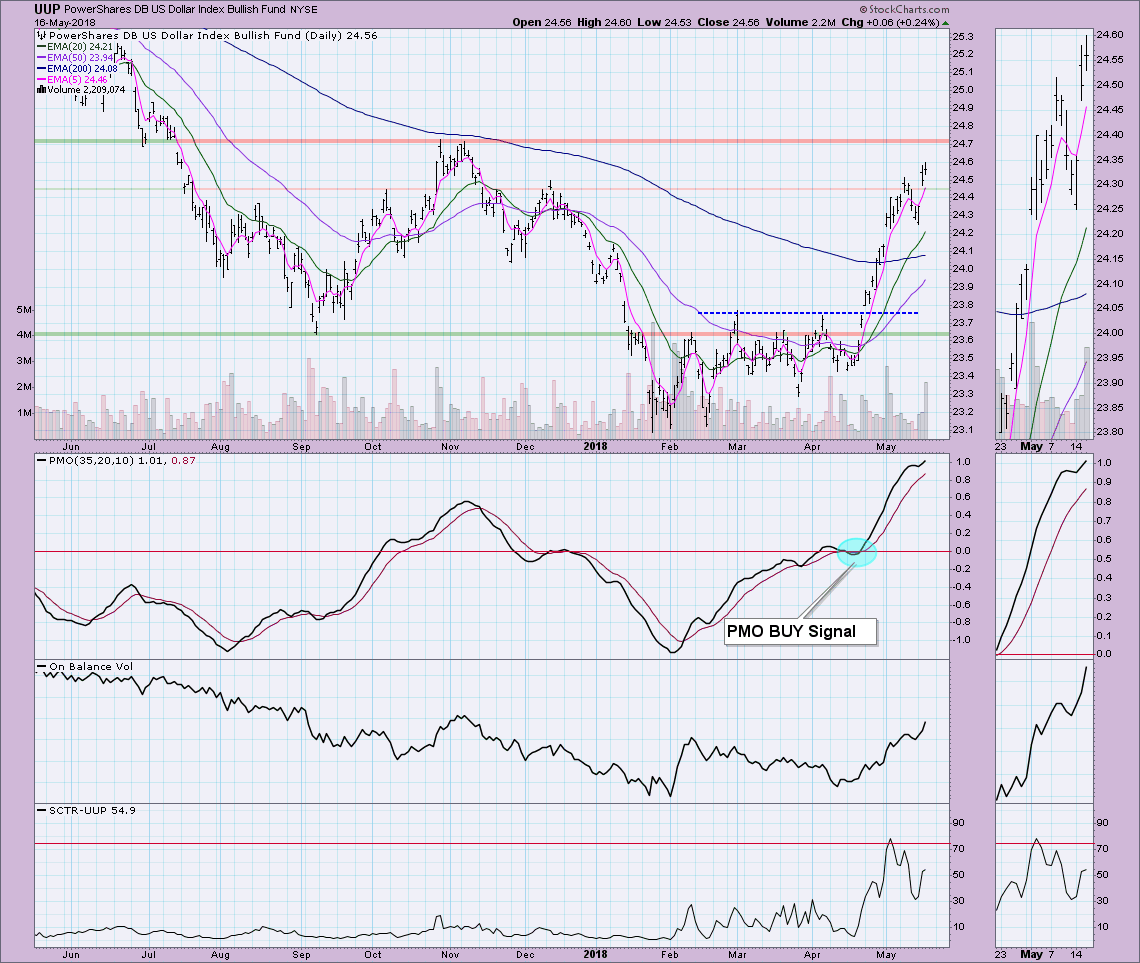
IT Trend Model: BUY as of 4/24/2018
LT Trend Model: SELL as of 5/24/2017
UUP Daily Chart: The Dollar took a pause as I had thought, but the PMO didn't unwind at all. It is now in overbought territory just as price is approaching strong resistance. I'm still expecting a pause or small decline on UUP to alleviate these overbought conditions in the shorter term.
GOLD
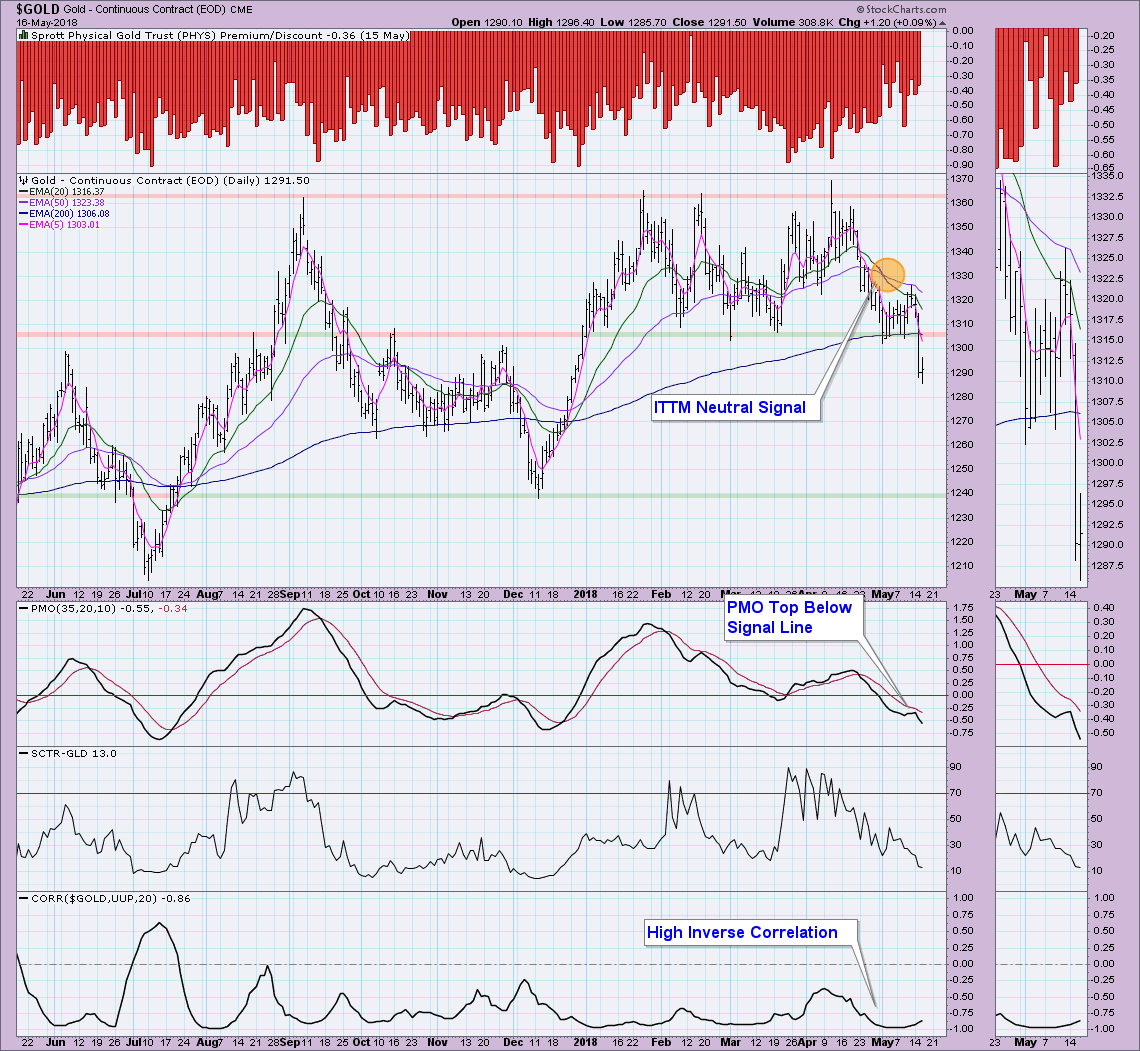
IT Trend Model: Neutral as of 5/2/2018
LT Trend Model: BUY as of 4/12/2017
GOLD Daily Chart: Gold finally broke down yesterday and suspect that isn't the end of it. The markets seem to be recuperating and I don't see that as favorable to Gold. It may take some time to get there, but I'm looking for a test of 1240. The Dollar is taking a pause or is in for a bit of decline and that will certainly benefit Gold. However, notice that the reverse correlation with the Dollar is softening. We could see Gold detach from the Dollar, meaning that Gold could continue lower even if the Dollar pauses or even declines.
CRUDE OIL (USO)
IT Trend Model: BUY as of 9/6/2017
LT Trend Model: BUY as of 11/2/2017
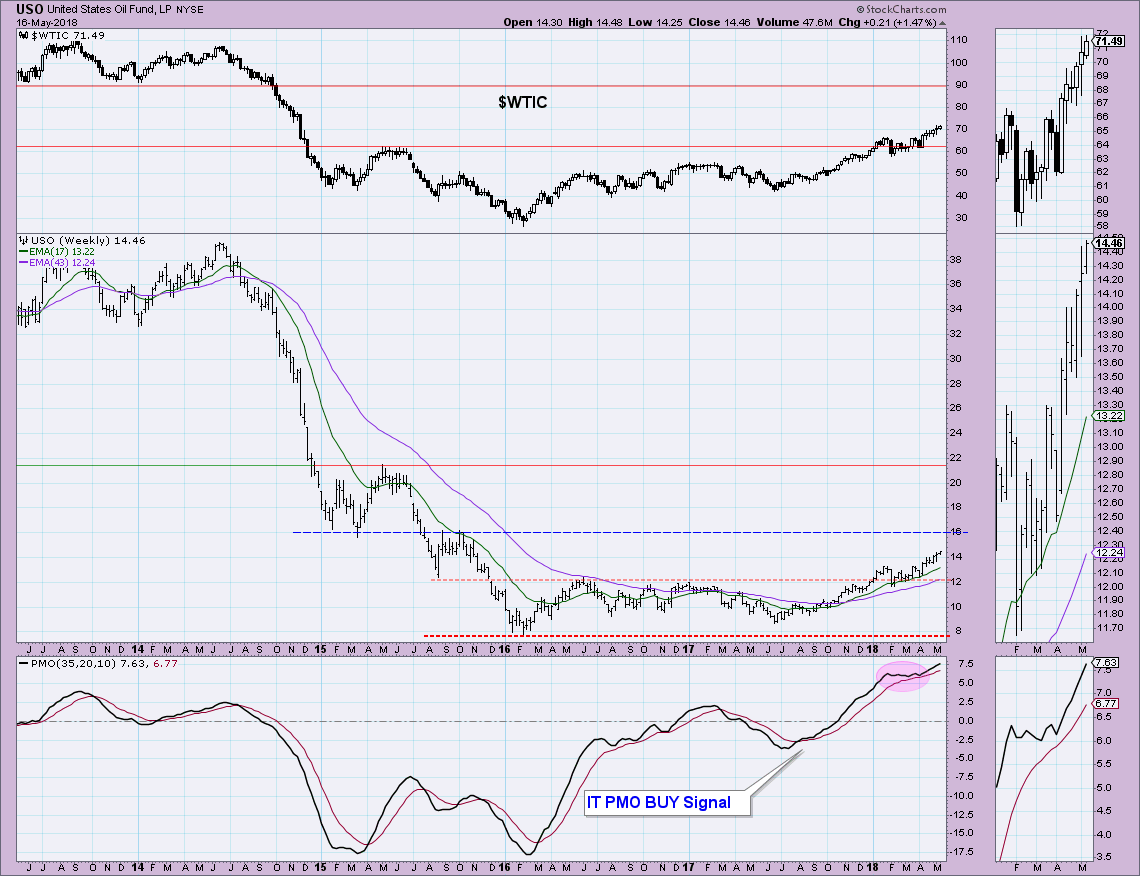
USO Daily Chart: Today USO broke out from a short-term consolidation. I was somewhat concerned about a possible island reversal off the gap, but with this breakout, I see that gap as a possible breakaway.The PMO is in overbought territory but hasn't really hit extremes. We need to look at a weekly chart to determine the upside potential of USO and $WTIC.
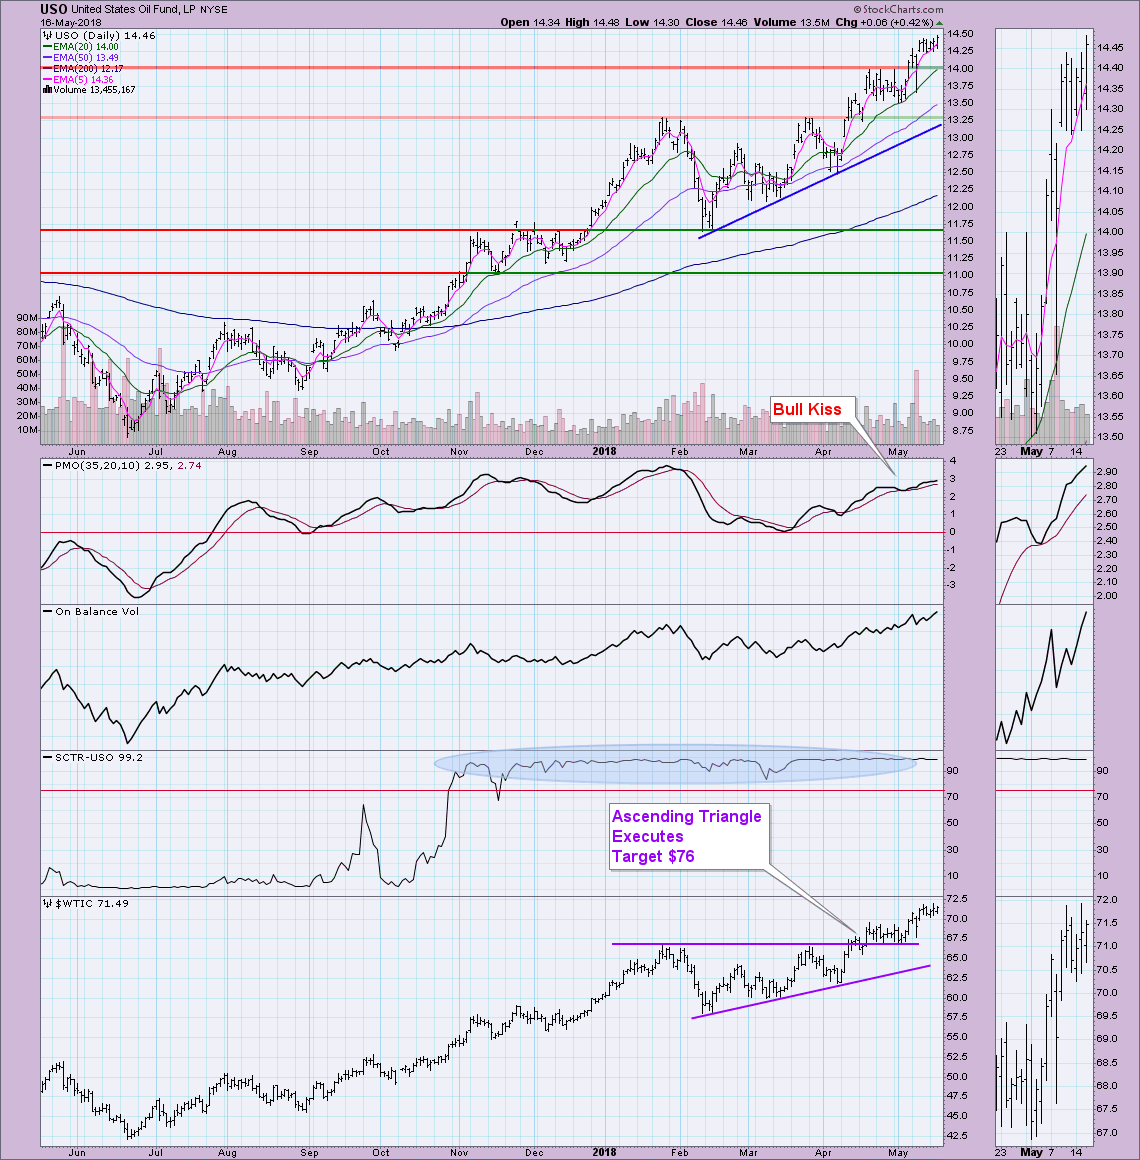
As far as $WTIC in the top pane, there really isn't any overhead resistance until you hit $90/barrel. USO does have some fairly strong overhead resistance at the early 2015 lows at $16.00. That might be a place for this rally to slow down a bit to unwind overbought PMOs
BONDS (TLT)
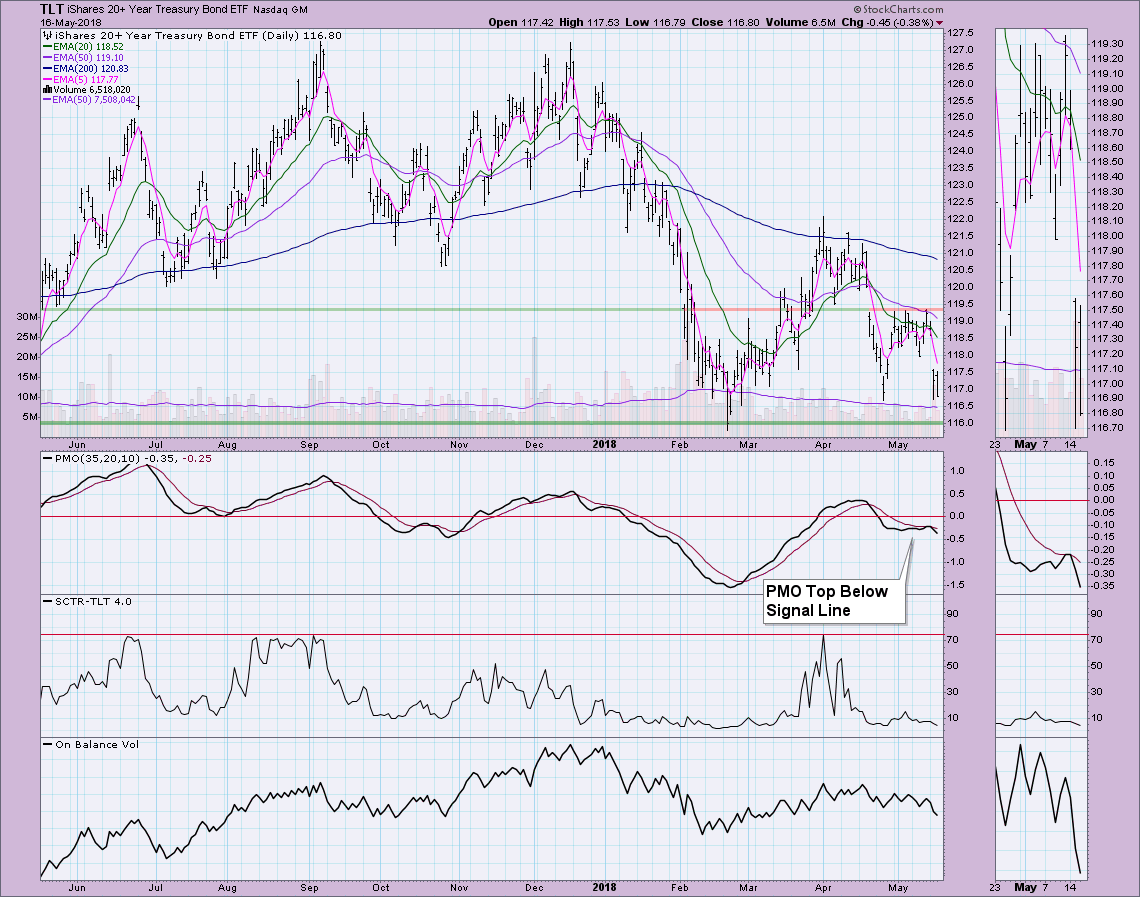
IT Trend Model: SELL as of 4/20/2018
LT Trend Model: SELL as of 2/8/2018
TLT Daily Chart: TLT continues its deep decline since failing to breakout from overhead resistance at $119.50. The next area of support arrives at about $116. Unfortunately looking at the PMO top below the signal line and very negative configuration of the EMAs, I doubt that will hold. If that doesn't hold, we need to look to the weekly chart to find the next area of support.
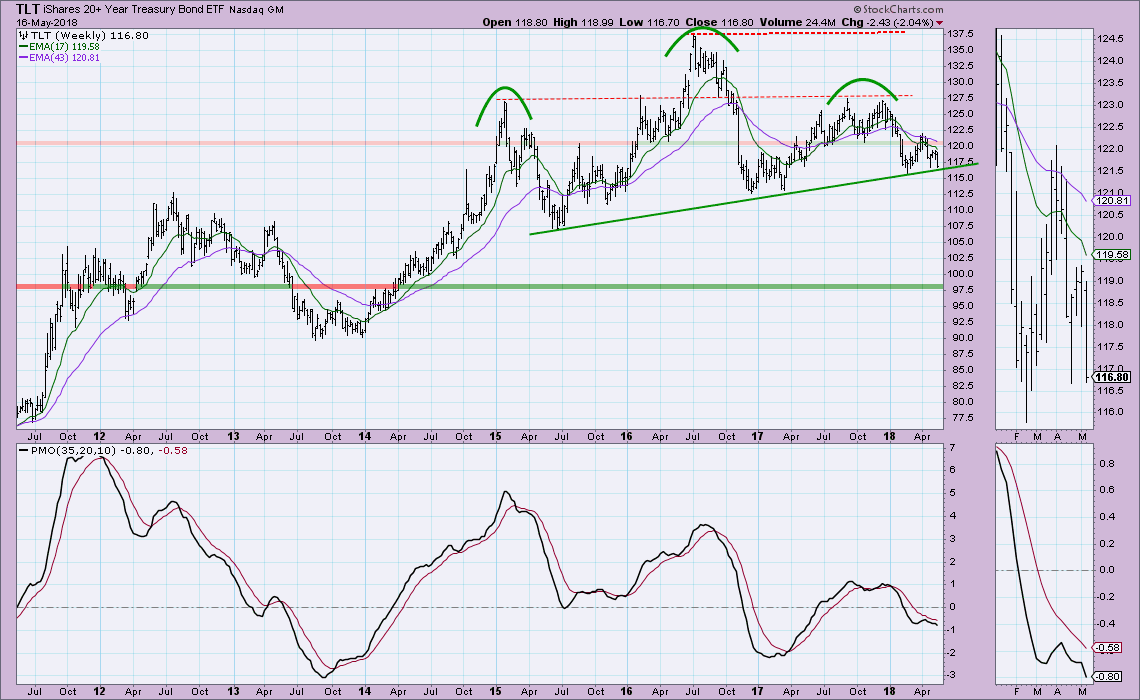
$116 is clearly important, but there is support available at the 2016/2017 lows at $112.50. What is most worrisome (especially coming on the heels of a new 7-year high for 10-year Treasure Yields) is the very large head and shoulders pattern. It is a rising neckline so a drop below that will execute the pattern. The minimum downside target based on the height of that pattern is around $97.50. Of course there are plenty of stopping points along the way for price to find support at $110 and $107.50. This is a very long-term projection based on PMO top below signal line as well as the negative crossover of the 17-week/43-week EMAs with increasing margin between them.
Technical Analysis is a windsock, not a crystal ball.
Happy Charting!
- Erin
**Don't miss any of the DecisionPoint commentaries! Go to the "Notify Me" box toward the end of this blog page to be notified as soon as they are published.**
NOTE: The signal status reported herein is based upon mechanical trading model signals, specifically, the DecisionPoint Trend Model. They define the implied bias of the price index based upon moving average relationships, but they do not necessarily call for a specific action. They are information flags that should prompt chart review. Further, they do not call for continuous buying or selling during the life of the signal. For example, a BUY signal will probably (but not necessarily) return the best results if action is taken soon after the signal is generated. Additional opportunities for buying may be found as price zigzags higher, but the trader must look for optimum entry points. Conversely, exit points to preserve gains (or minimize losses) may be evident before the model mechanically closes the signal.
Helpful DecisionPoint Links:
DecisionPoint Shared ChartList and DecisionPoint Chart Gallery
Price Momentum Oscillator (PMO)
Swenlin Trading Oscillators (STO-B and STO-V)
