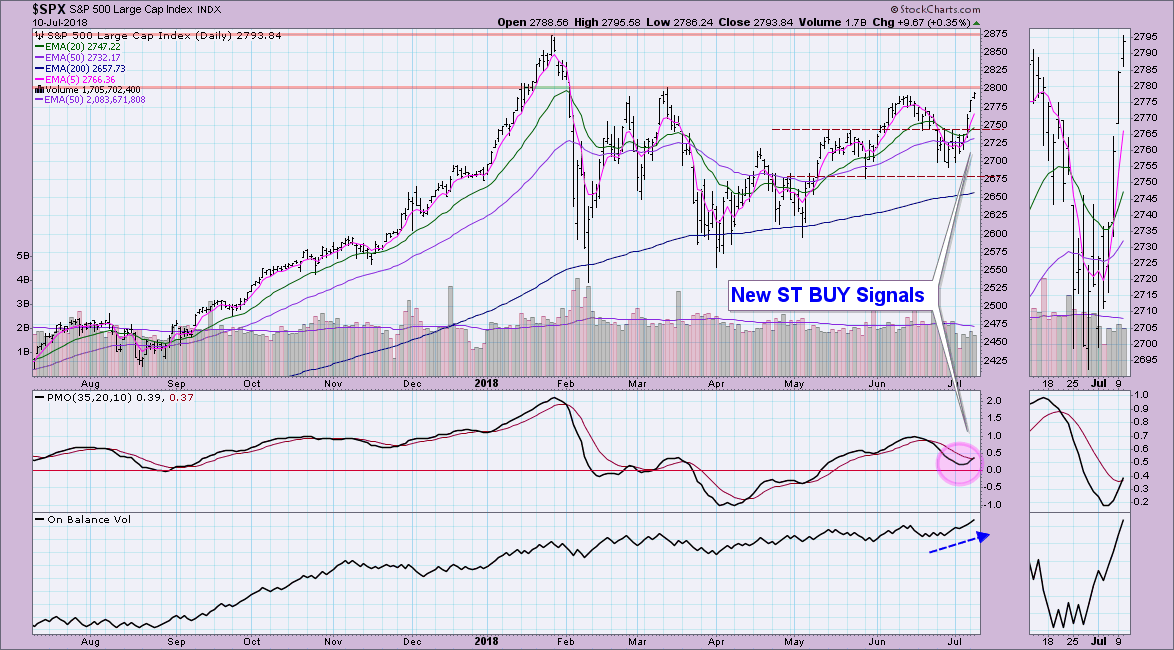
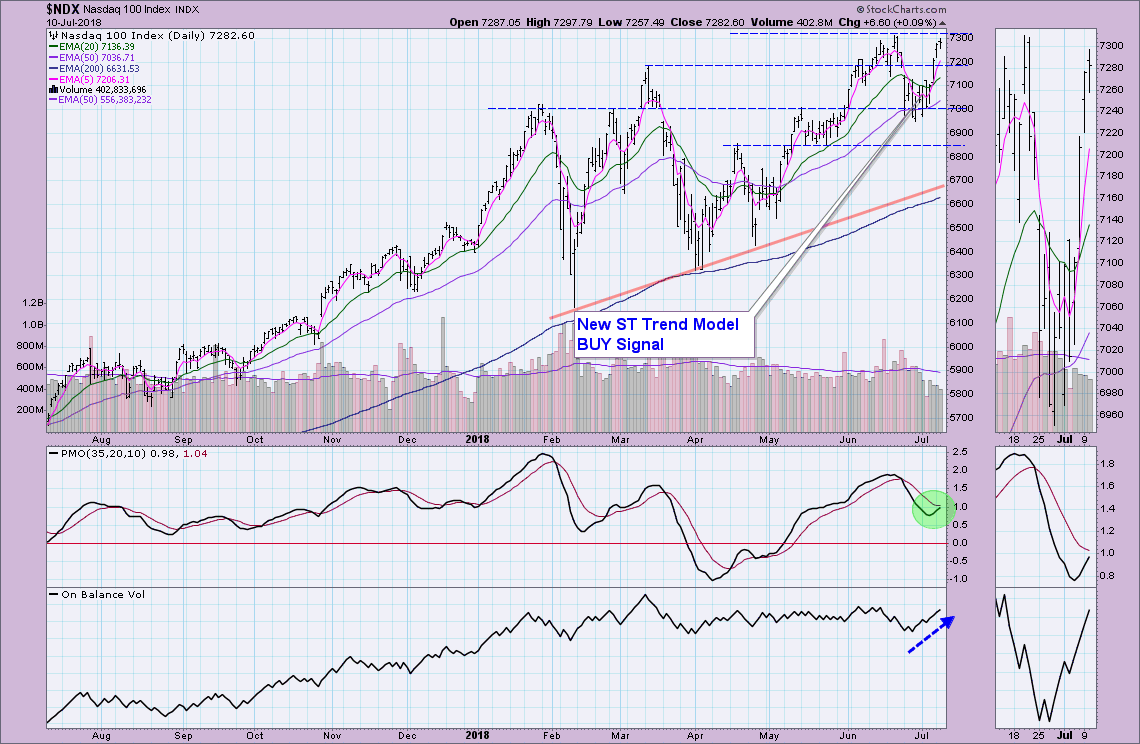
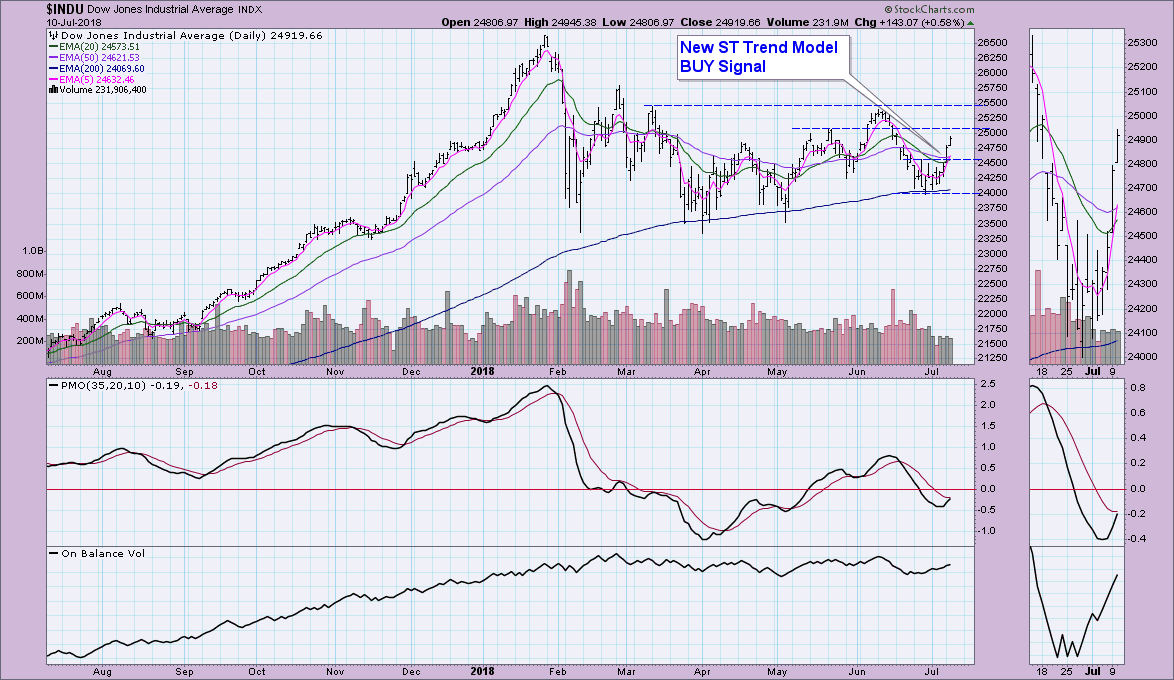
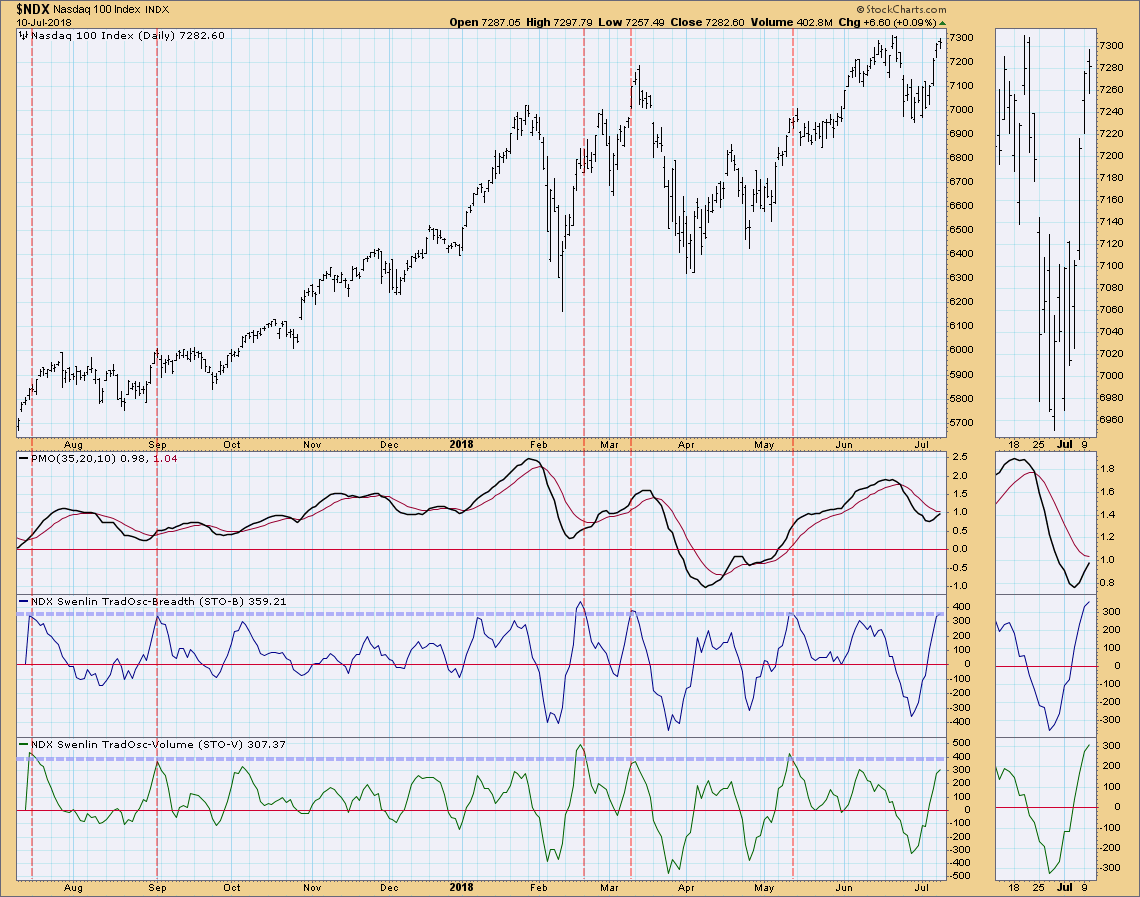
We've had a few signal changes arrive the past few trading days that you should be aware of. While these new green arrows look promising, the DecisionPoint Swenlin Trading Oscillators (STOs) suggest we may experience some short-term weakness before pushing past overhead resistance at June price tops. The NDX and Dow pulled back quite a bit and therefore are the slowest to recapture short-term PMO BUY signals. However, expect a DP Bulletin soon announcing those signals.
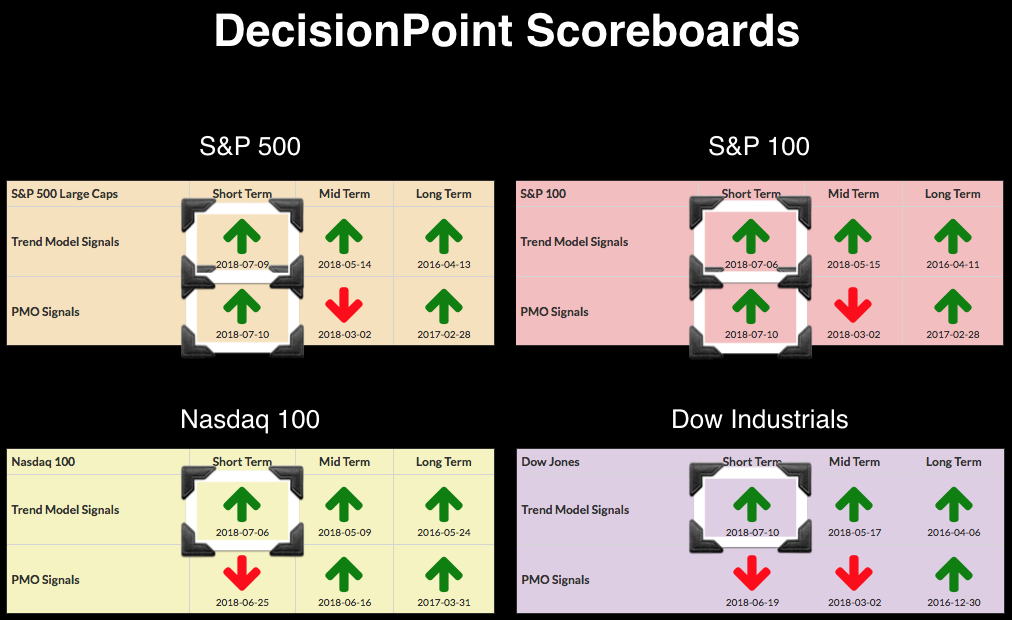
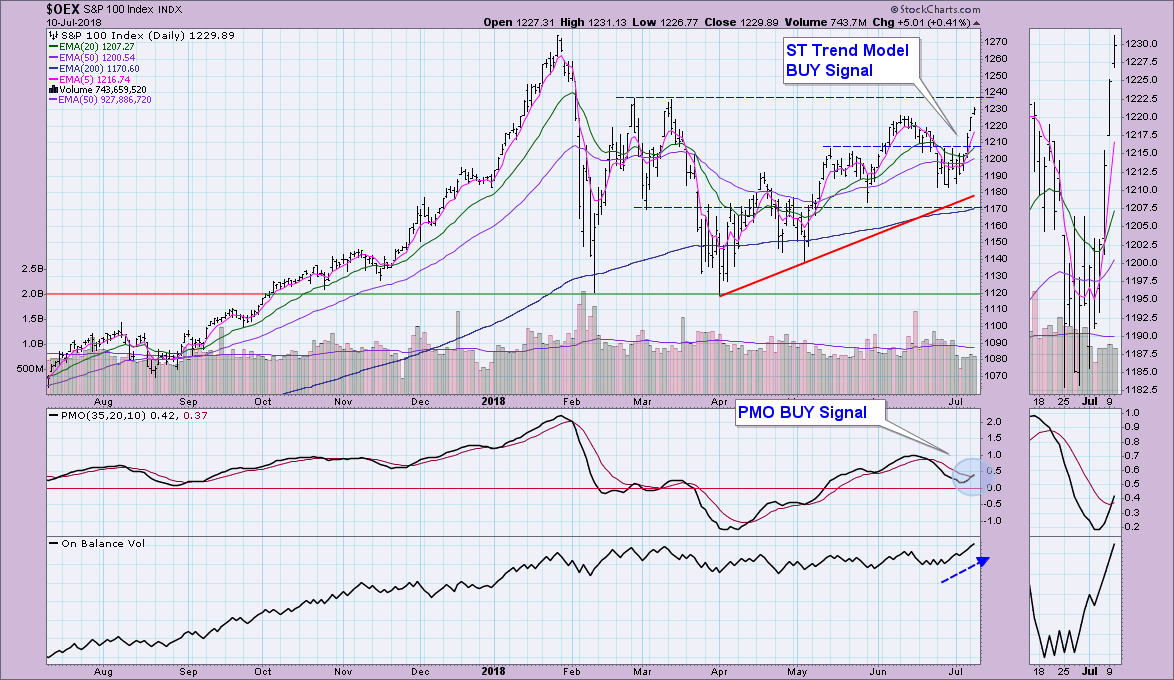
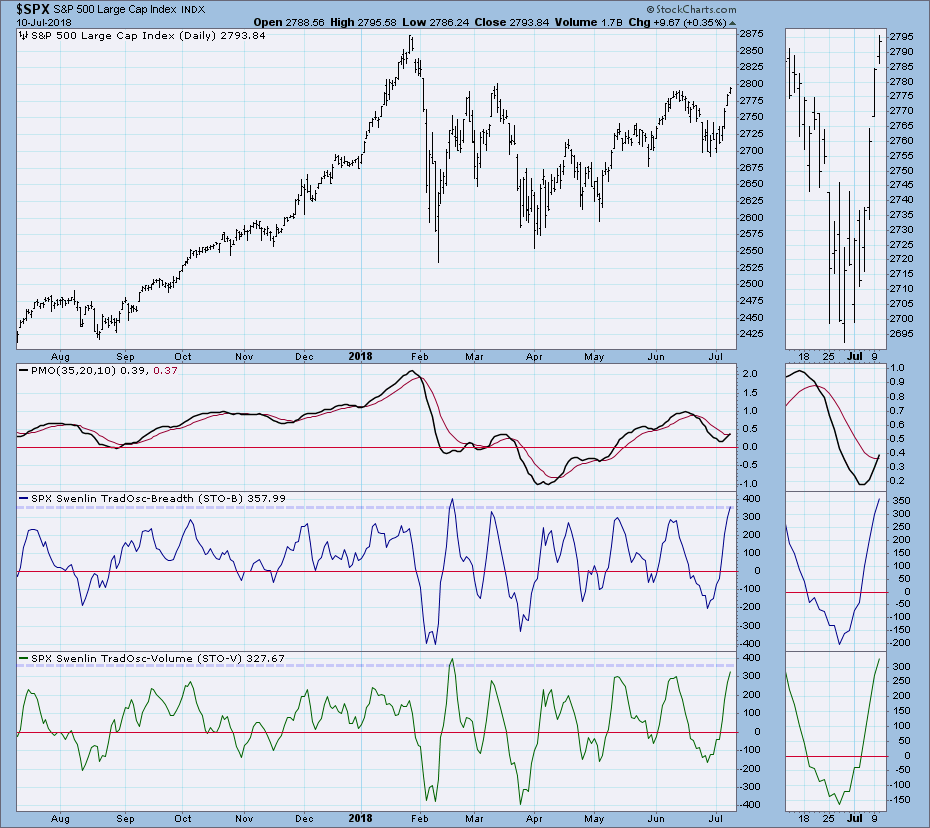
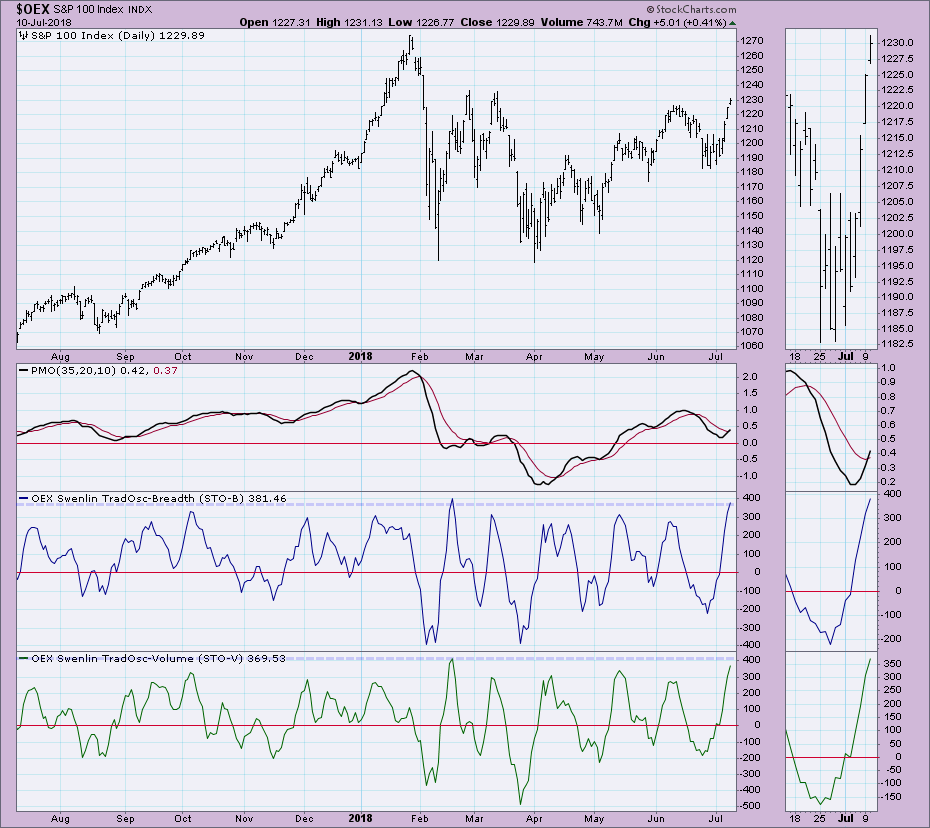
The two strongest charts are the SPX and OEX as both have managed ST BUY signals on trend and momentum. A Short-Term Trend Model (STTM) BUY signal triggers when the 5-EMA crosses above the 20-EMA. The problem I see for both of these indices is overhead resistance at the June price tops and especially the March tops. I suspect passing these areas of resistance will prove difficult. I'll explain why later.
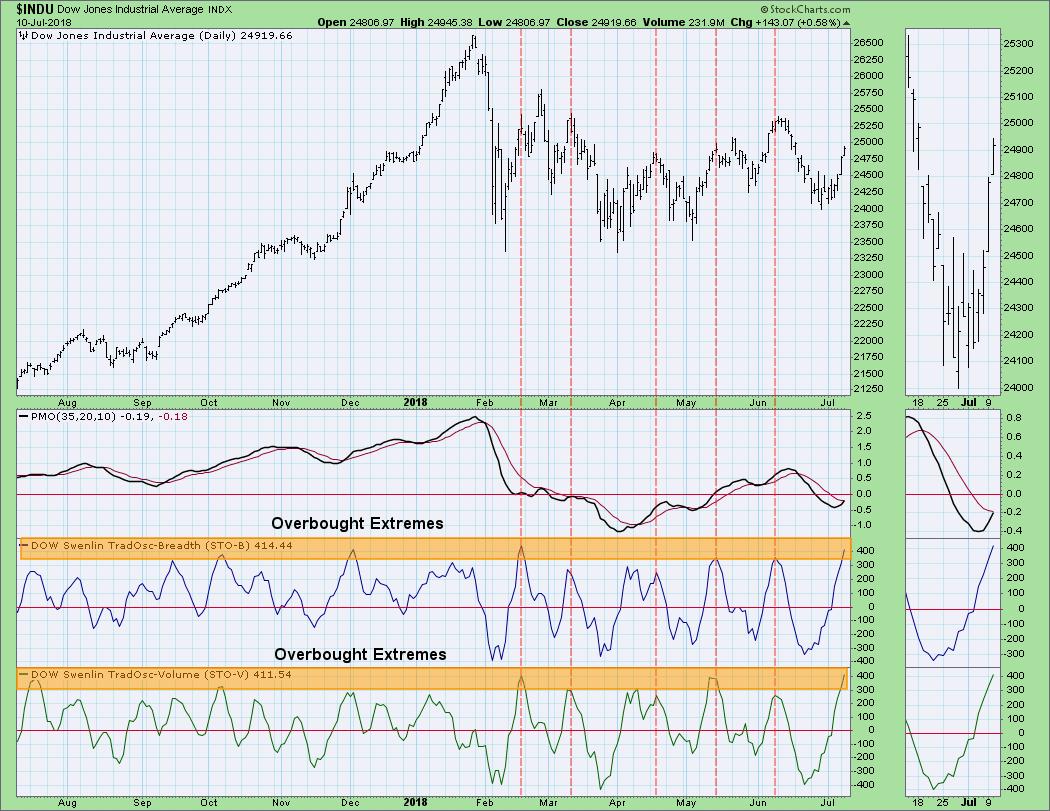
As noted above, the NDX and Dow haven't triggered PMO BUY signals, but as you can see, the margin is quite thin between the PMOs and their signal lines, so we should expect those positive crossovers before week's end (barring a serious correction or pullback). As with the SPX and OEX, the OBV is rising nicely. The NDX is poised to test resistance at all-time highs. Based on market indicators for both the NDX and SPX (shown below the Dow chart), I would expect to see some difficulty with resistance levels I've pointed out.
The Swenlin Trading Oscillators for all four indexes (you'll find these charts in the DP Market Indicators ChartPack) show very overbought conditions. The good news is that all four of these indexes are in "bull market" configurations which suggests that we may not need to see a serious pullback or correction to relieve these conditions. Many times overbought conditions can clear with price consolidation as we saw after the May STOs topped. I am expecting to see some struggle for these indexes to move much past current overhead resistance at June tops.
Technical Analysis is a windsock, not a crystal ball.
Happy Charting!
- Erin
Helpful DecisionPoint Links:
DecisionPoint Shared ChartList and DecisionPoint Chart Gallery
Price Momentum Oscillator (PMO)
Swenlin Trading Oscillators (STO-B and STO-V)
**Don't miss DecisionPoint Commentary! Add your email below to be notified of new updates"**


