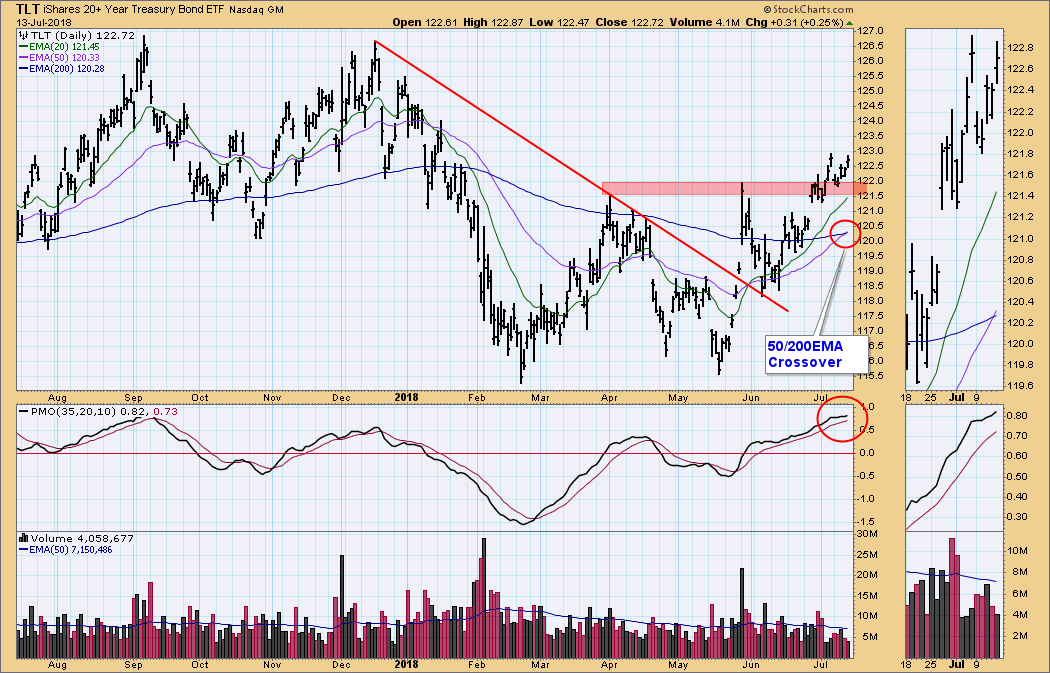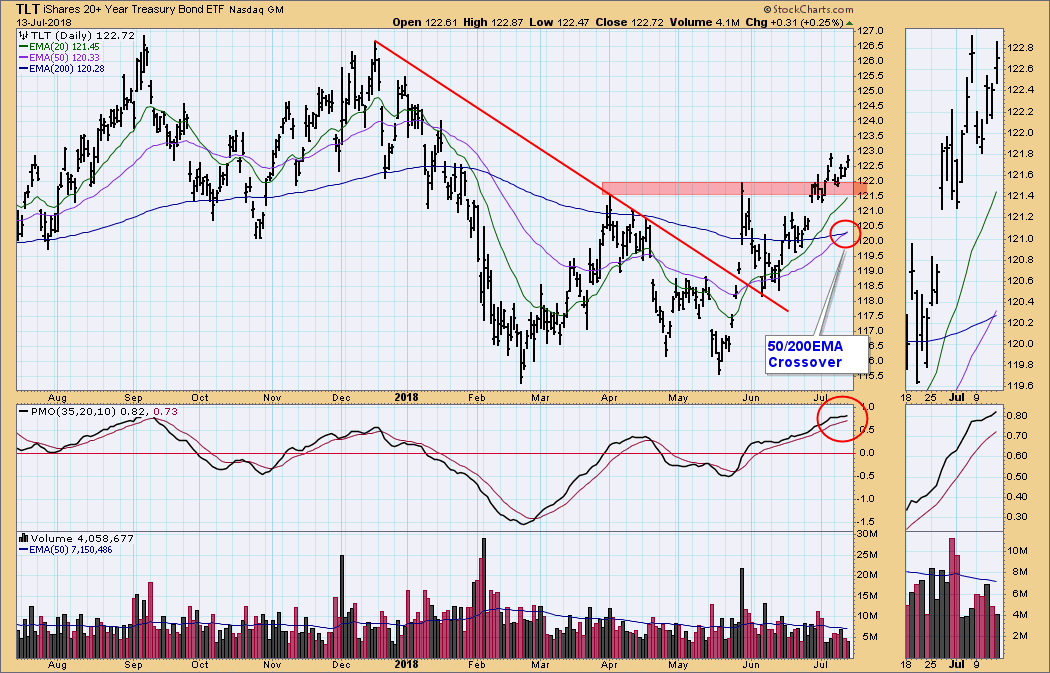
On Friday the Long-Term Trend Model (LTTM) for long bonds (TLT) generated a long-term BUY signal. How that happens is that the 50EMA crosses up through the 200EMA, an event more commonly known as the "Golden Cross," because big money is sure to follow (just kidding). When we say long-term, we mean months to years, but in the broader picture TLT appears to be moving sideways -- the LTTM SELL signal we just closed only lasted about five months, and with interest rates on the rise, the upside for bonds would seem to be limited. Remember, the new BUY signal does not call for immediate buying. It is an information flag, and it implies that there should be a positive environment for bonds for at least several months.
The DecisionPoint Weekly Wrap presents an end-of-week assessment of the trend and condition of the stock market (S&P 500), the U.S. Dollar, Gold, Crude Oil, and Bonds.
SECTORS
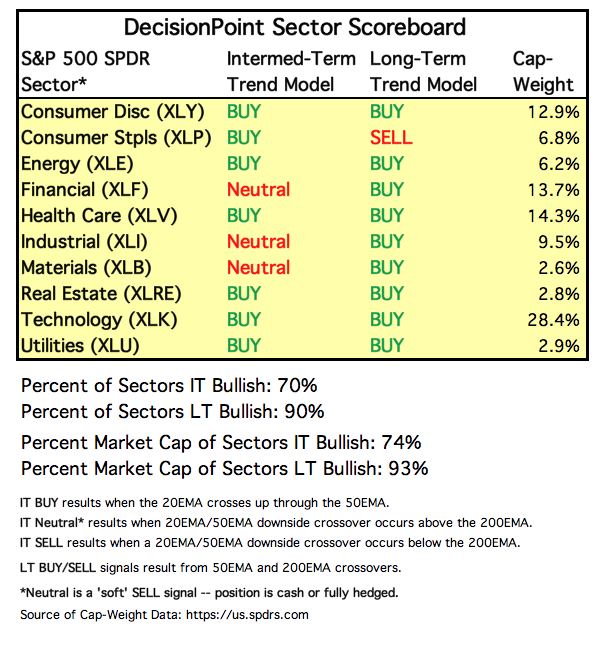
Each S&P 500 Index component stock is assigned to one, and only one, of 10 major sectors. This is a snapshot of the Intermediate-Term and Long-Term Trend Model signal status for those sectors.
STOCKS
IT Trend Model: BUY as of 5/11/2018
LT Trend Model: BUY as of 4/1/2016
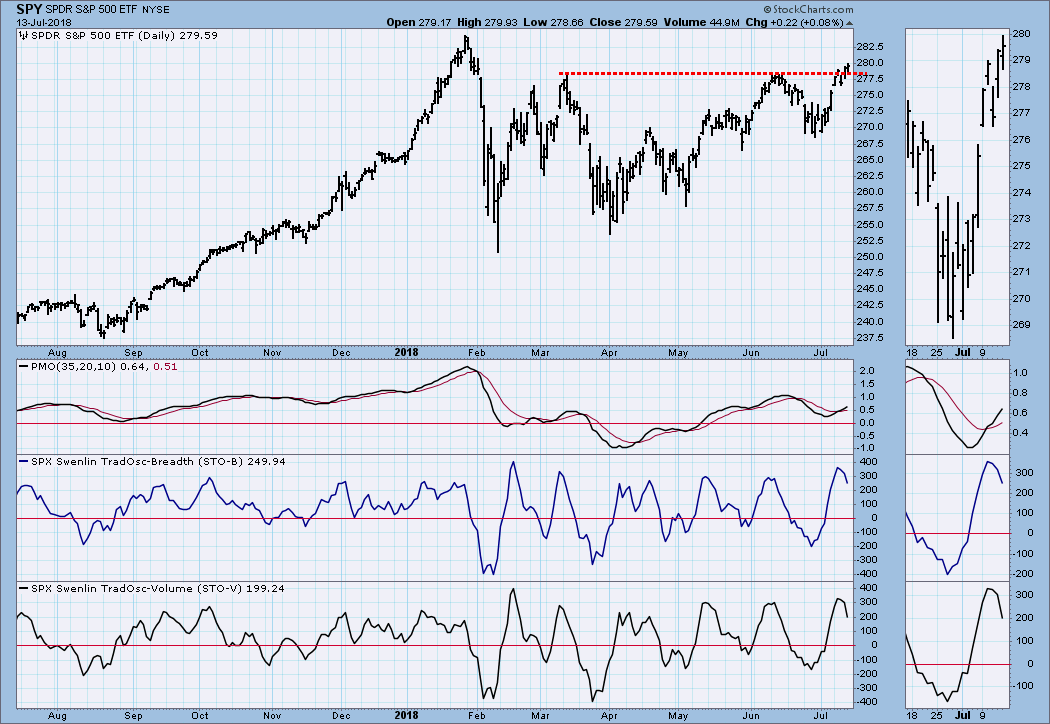
SPY Daily Chart: The market attempted a breakout on Tuesday, but it was turned back on Wednesday -- looked like a top for sure. But, no. Thursday and Friday it managed a marginal breakout above the top of the trading range. It should be noted that volume this week was slim.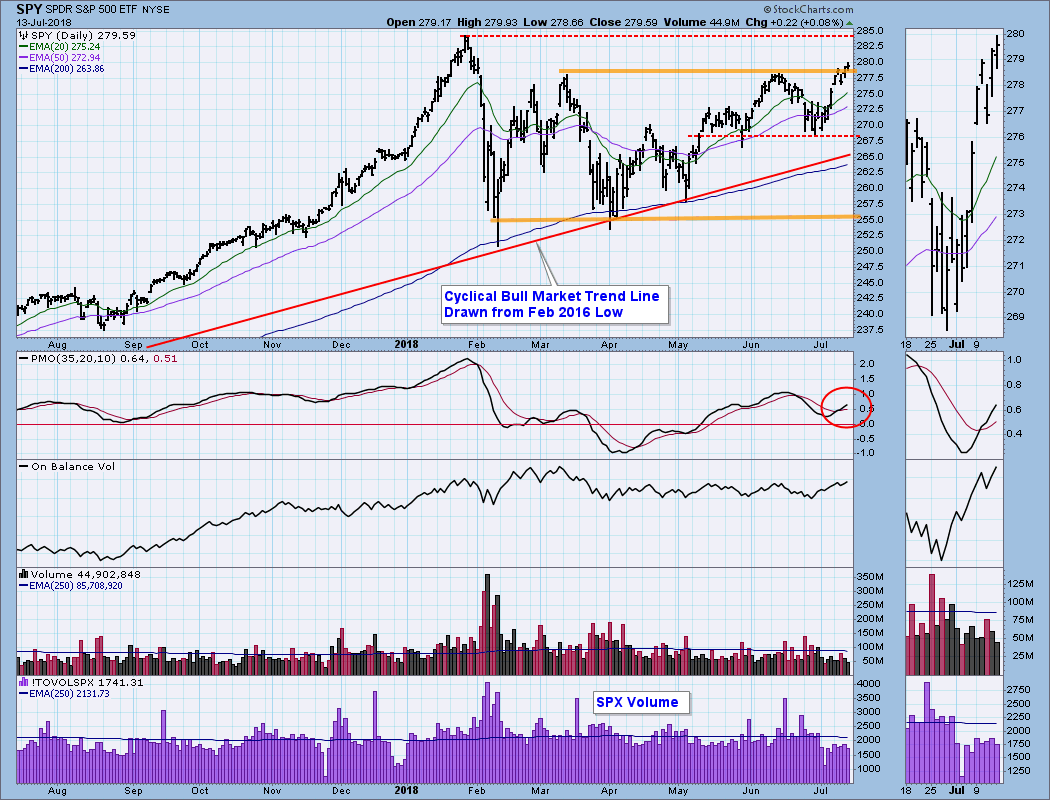
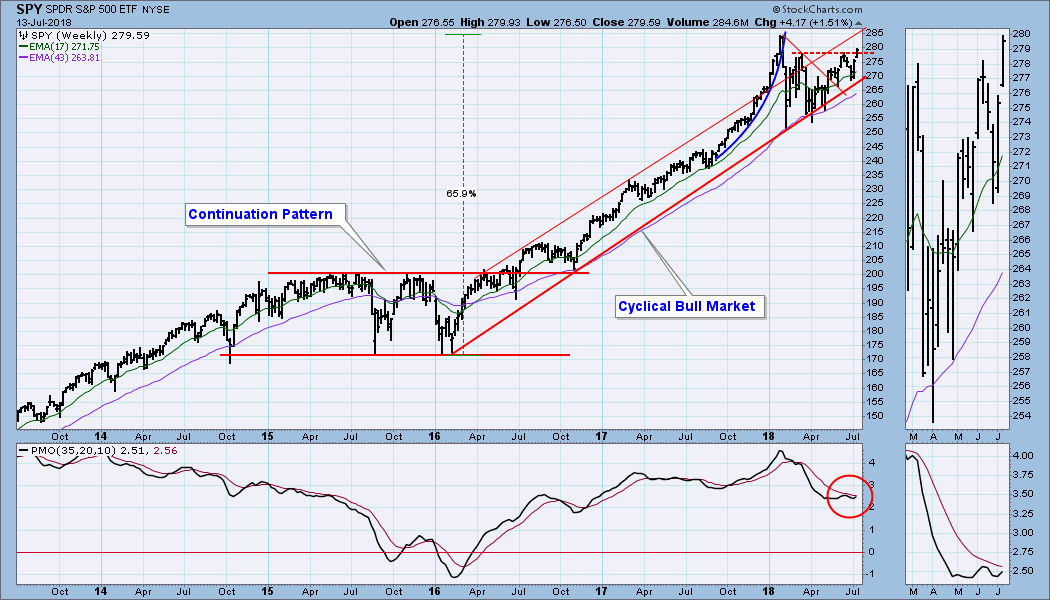
SPY Weekly Chart: We can see the price breakout and the weekly PMO has turned up. Kinda positive.
Short-Term Market Indicators: The STO-B (breadth) and STO-V (volume) have topped at overbought levels. If we look at other STO tops this year, we can see that they are fairly reliable indications that a price top and pullback is on the way.
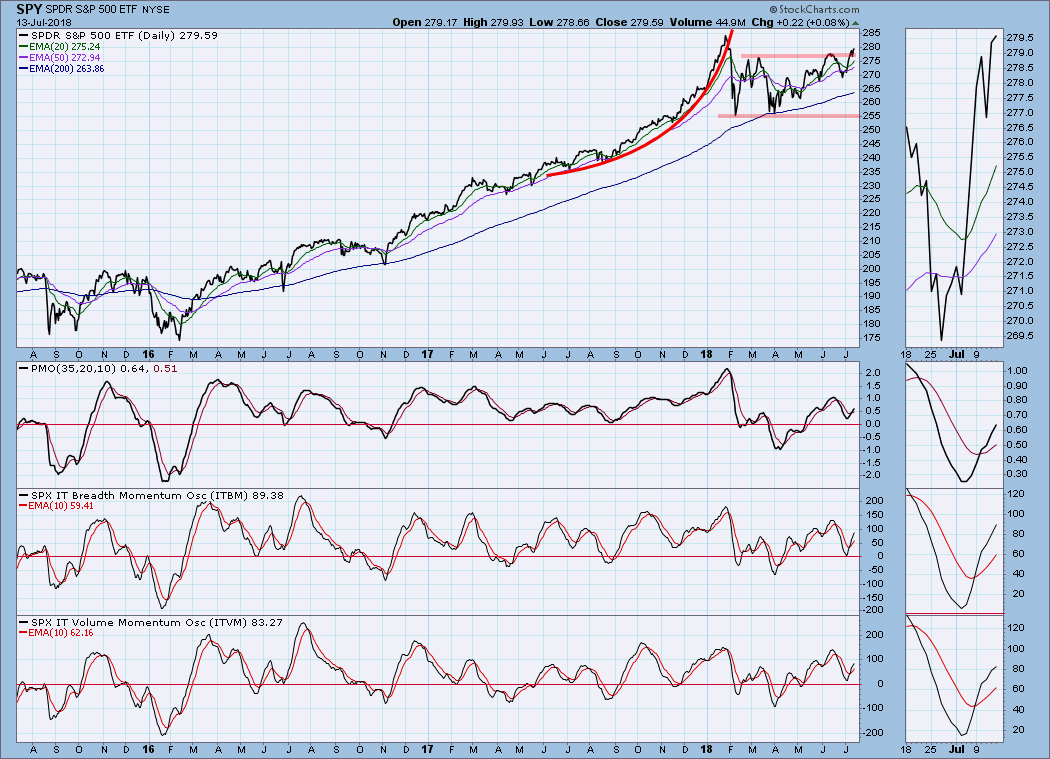
Intermediate-Term Market Indicators: These indicators are positive and have plenty of room for more upside before they become overbought.
Conclusion: The charts are generally positive, but the chart that speaks most loudly to me today is the short-term indicator (STO) chart. The STOs are overbought and topping, a configuration that most of this year has been a pretty reliable indication that a short-term price top was in the cards. For that reason I'll be looking for a short-term correction next week.
Reminder: Next Friday is options expiration, which tends to dampen volatility toward the end of the week.
DOLLAR (UUP)
IT Trend Model: BUY as of 4/24/2018
LT Trend Model: BUY as of 5/25/2018
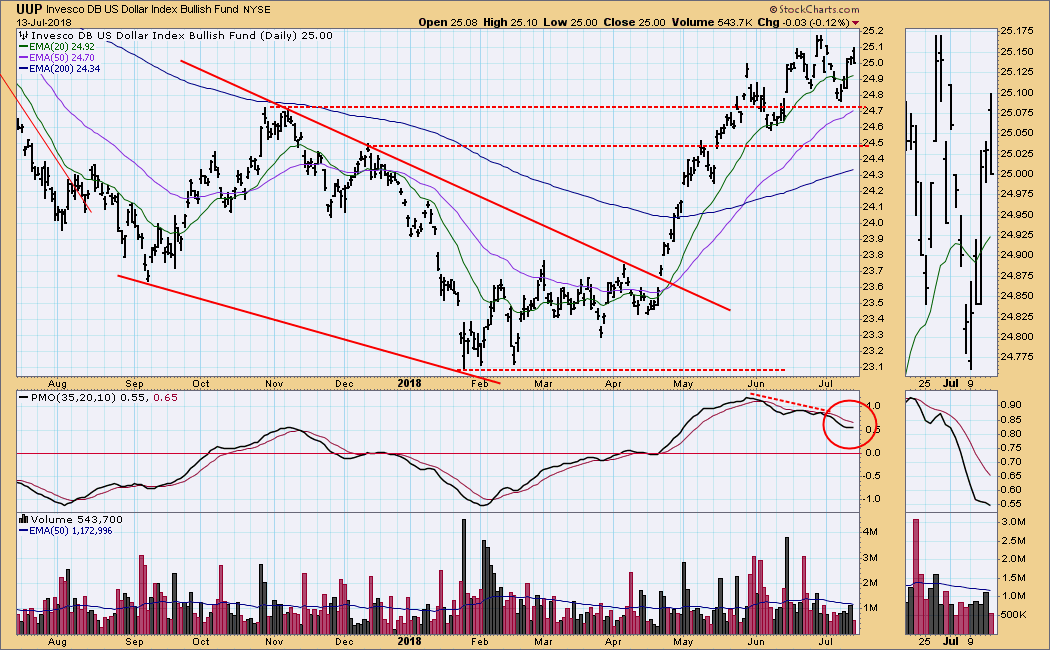
UUP Daily Chart: UUP is taking its time, but there is a daily PMO negative divergence, and it appears that UUP is in the process of topping.
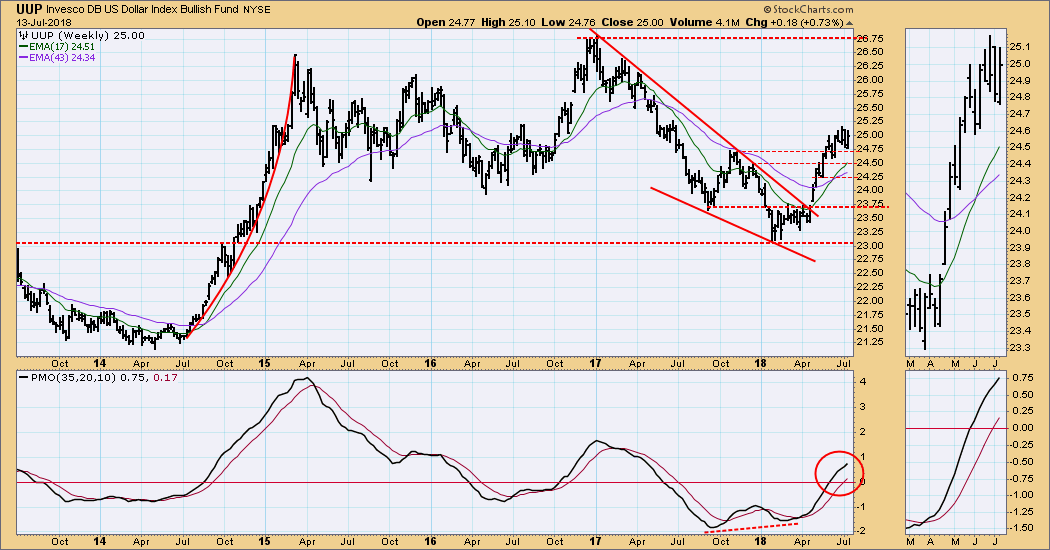
UUP Weekly Chart: This is a positive chart, but, again, price seems to be topping in preparation for a correction. This would be good for gold.
GOLD
IT Trend Model: NEUTRAL as of 5/2/2018
LT Trend Model: SELL as of 6/22/2018
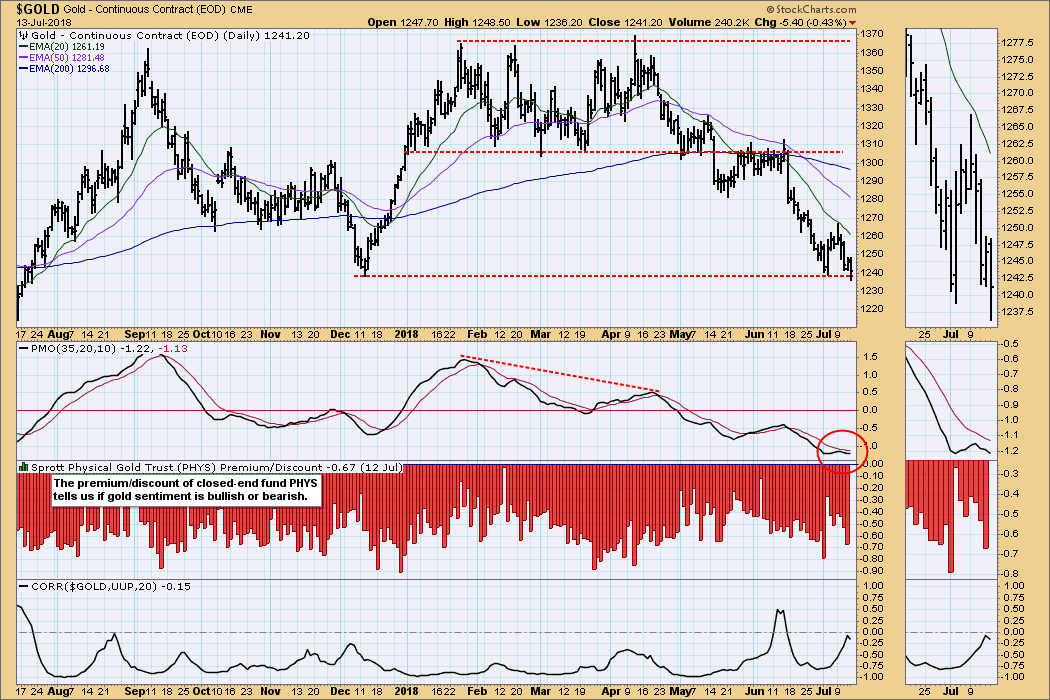
GOLD Daily Chart: At the beginning of July gold bounced off horizontal support and the daily PMO bottomed. This week gold topped and a retest of that support is underway.
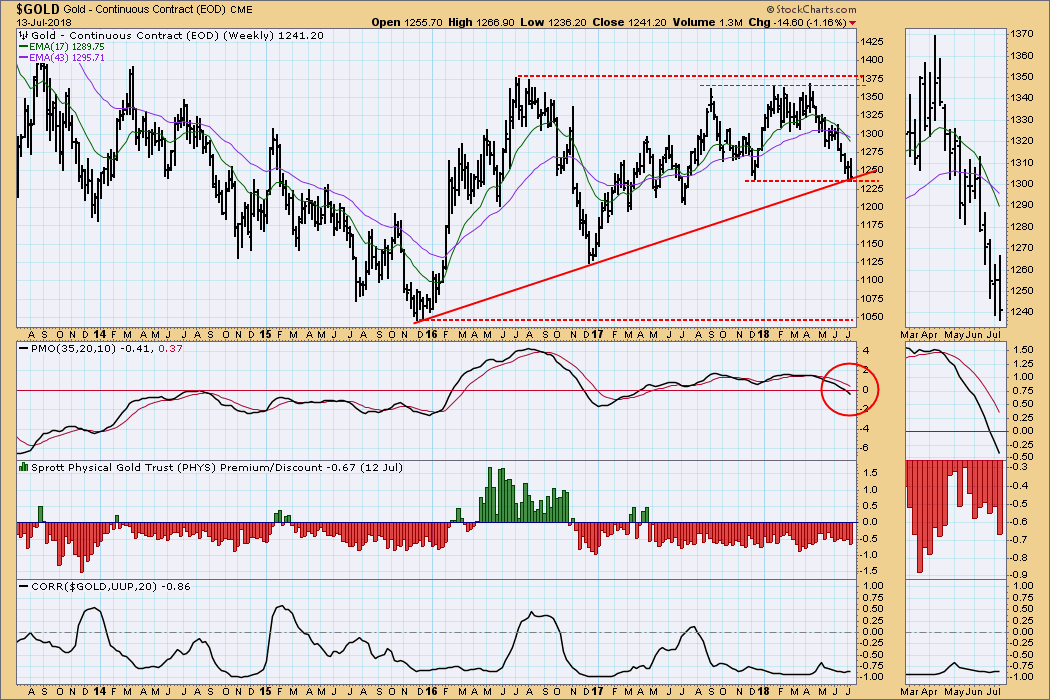
GOLD Weekly Chart: The only positive thing on this chart is the fact that price has found support on the intersection of the rising trend line and horizontal support. Otherwise, the weekly PMO is falling below the zero line, and 17EMA is below the 43EMA and falling.
CRUDE OIL (USO)
IT Trend Model: BUY as of 6/26/2018
LT Trend Model: BUY as of 11/2/2017
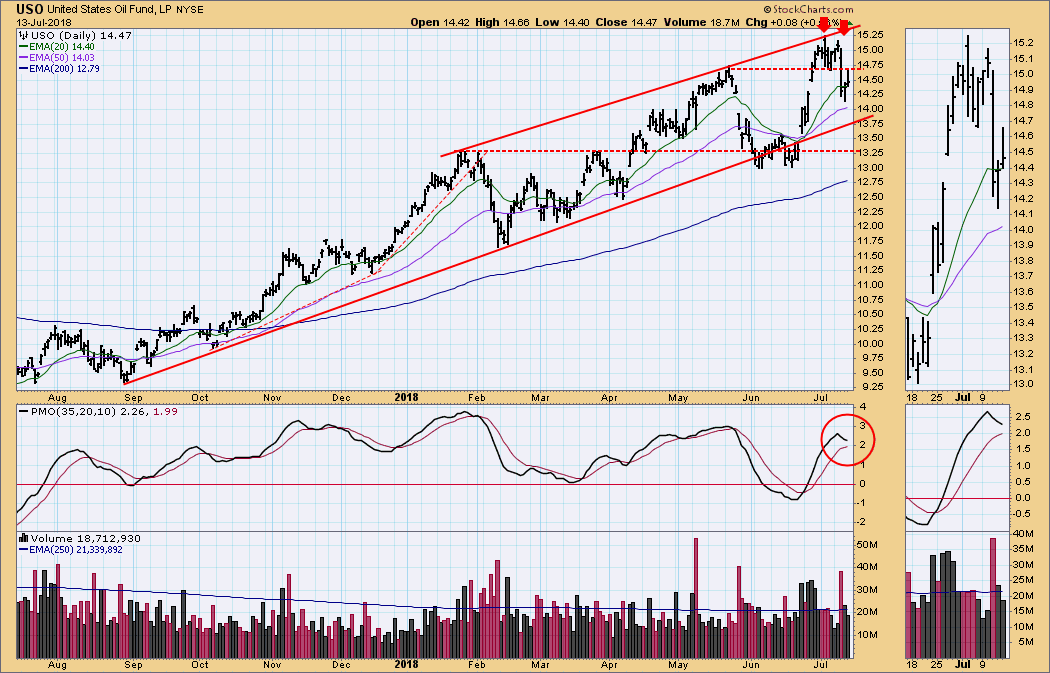
USO Daily Chart: There is a short-term double top, and Wednesday's air pocket drop executed it and at the same time met the minimum downside price objective. The daily PMO has topped, so there could be more downside ahead.
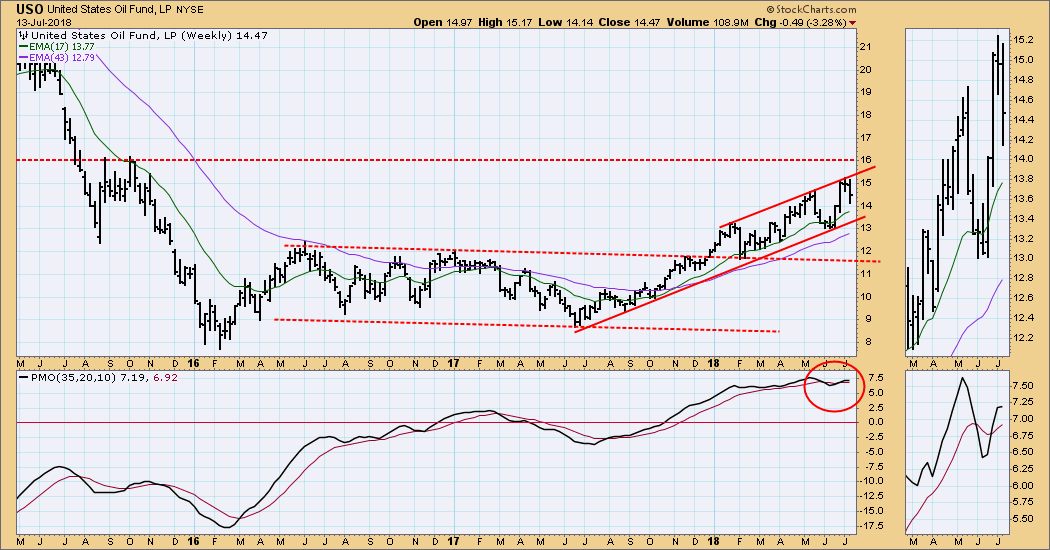
USO Weekly Chart: The weekly PMO is overbought and looks ready to top. Price remains within a rising trend channel, but there is plenty of room for a continued decline before the rising trend line is challenged.
BONDS (TLT)
IT Trend Model: BUY as of 6/1/2018
LT Trend Model: BUY as of 7/13/2018
TLT Daily Chart: Price broke through a zone of resistance last week. This week, as technically expected, it pulled back to the point of breakout, then moved higher. The daily PMO is overbought, but there is every indication that price is headed higher.
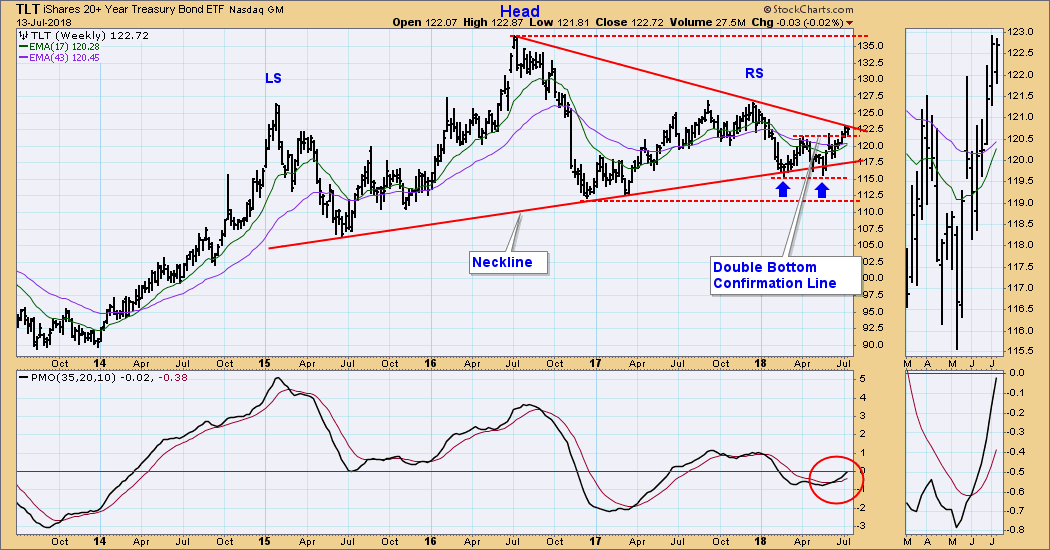
TLT Weekly Chart: The head and shoulders pattern remains intact, but the weekly PMO is rising above the signal line, and price seems poised to move higher. If that happens, we can forget the head and shoulders.
**Don't miss any of the DecisionPoint commentaries! Go to the "Notify Me" box toward the end of this blog page to be notified as soon as they are published.**
Technical Analysis is a windsock, not a crystal ball.
Happy Charting!
- Carl
NOTE: The signal status reported herein is based upon mechanical trading model signals, specifically, the DecisionPoint Trend Model. They define the implied bias of the price index based upon moving average relationships, but they do not necessarily call for a specific action. They are information flags that should prompt chart review. Further, they do not call for continuous buying or selling during the life of the signal. For example, a BUY signal will probably (but not necessarily) return the best results if action is taken soon after the signal is generated. Additional opportunities for buying may be found as price zigzags higher, but the trader must look for optimum entry points. Conversely, exit points to preserve gains (or minimize losses) may be evident before the model mechanically closes the signal.
Helpful DecisionPoint Links:
DecisionPoint Shared ChartList and DecisionPoint Chart Gallery
Price Momentum Oscillator (PMO)
Swenlin Trading Oscillators (STO-B and STO-V)

