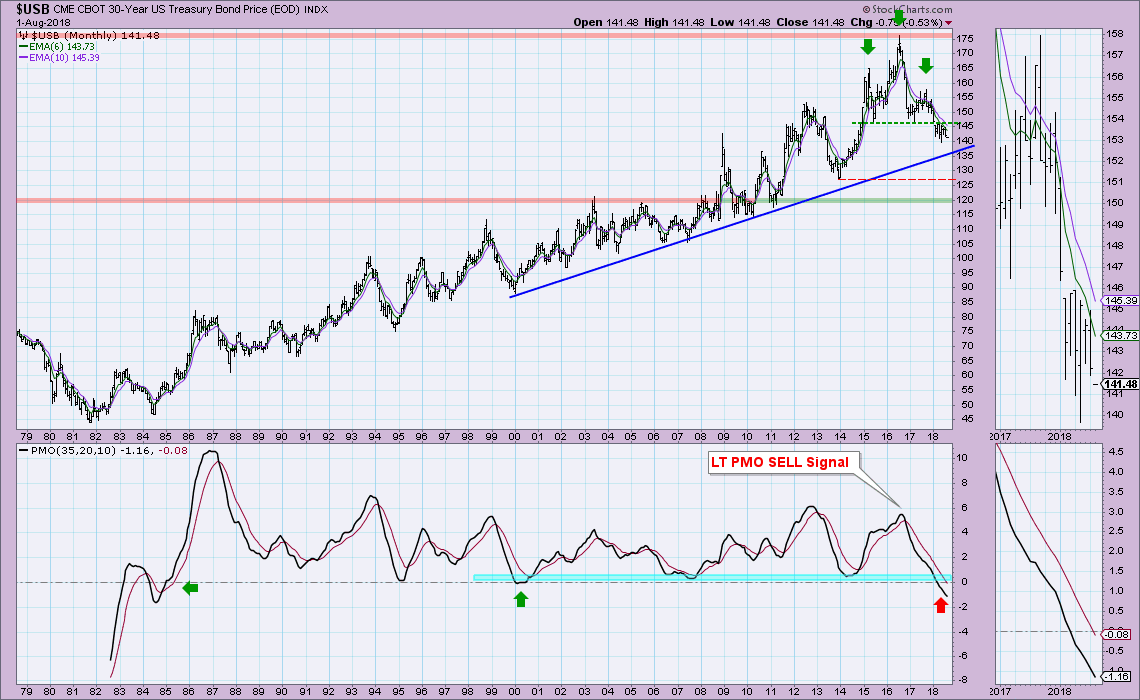
 The monthly charts 'went final' yesterday after the market closed, so it's time to review and prepare for next month. I highly recommend you check out the video version on today's MarketWatchers LIVE show where I had more time and space to discuss.
The DP Scoreboards are unchanged since yesterday's new Neutral and SELL signals on the NDX. Interestingly, that was one of the few indexes that managed to hold on to a positive close, along with the OEX.
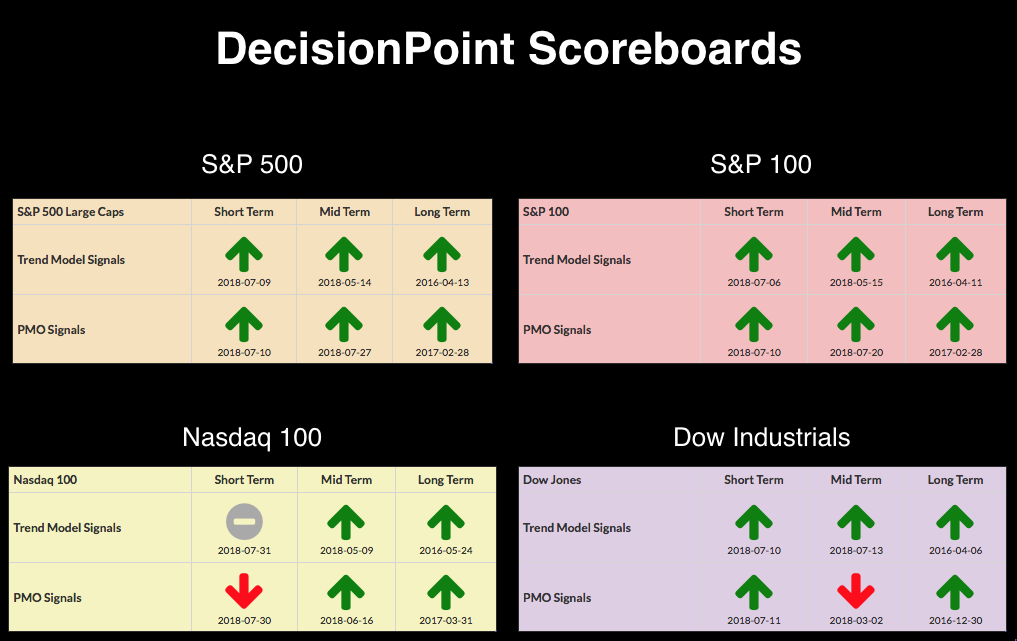
The DecisionPoint Alert presents an mid-week assessment of the trend and condition of the stock market (S&P 500), the U.S. Dollar, Gold, Crude Oil, and Bonds.
SECTORS
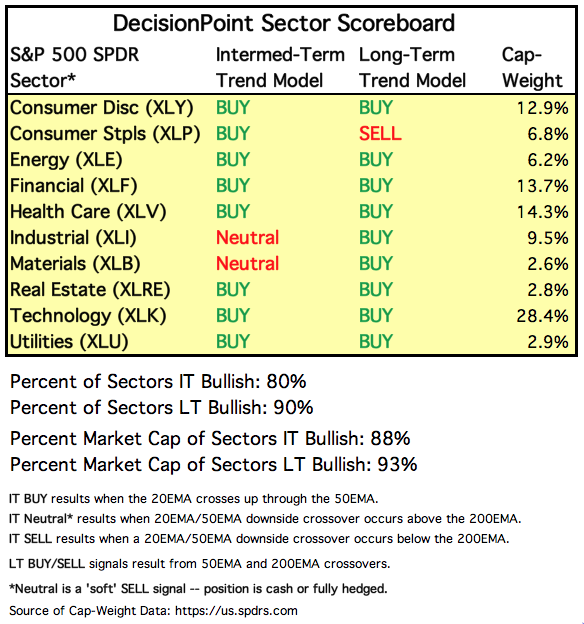
Each S&P 500 Index component stock is assigned to one, and only one, of 10 major sectors. This is a snapshot of the Intermediate-Term and Long-Term Trend Model signal status for those sectors.
STOCKS
IT Trend Model: BUY as of 5/11/2018
LT Trend Model: BUY as of 4/1/2016
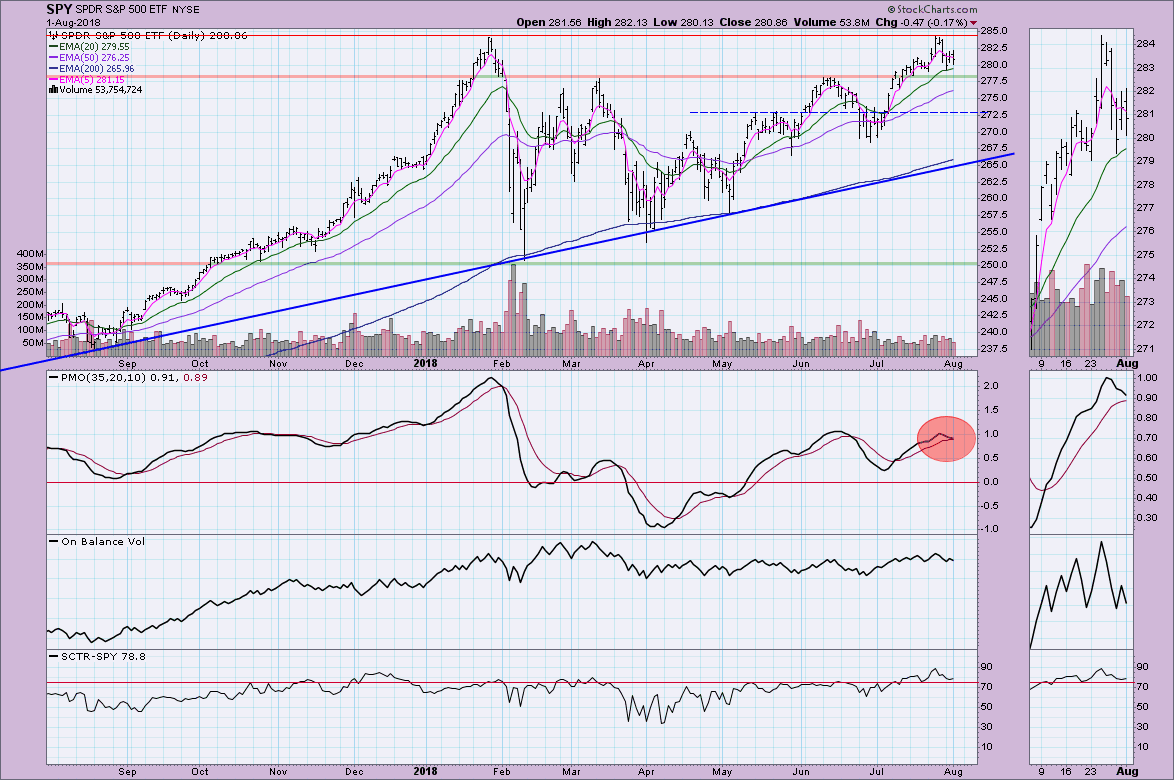
SPY Daily/Monthly Chart: The SPY is holding on to support along the March/June tops as well as the 20-EMA. The PMO has continued to fall and is now dangerously close to a SELL signal.
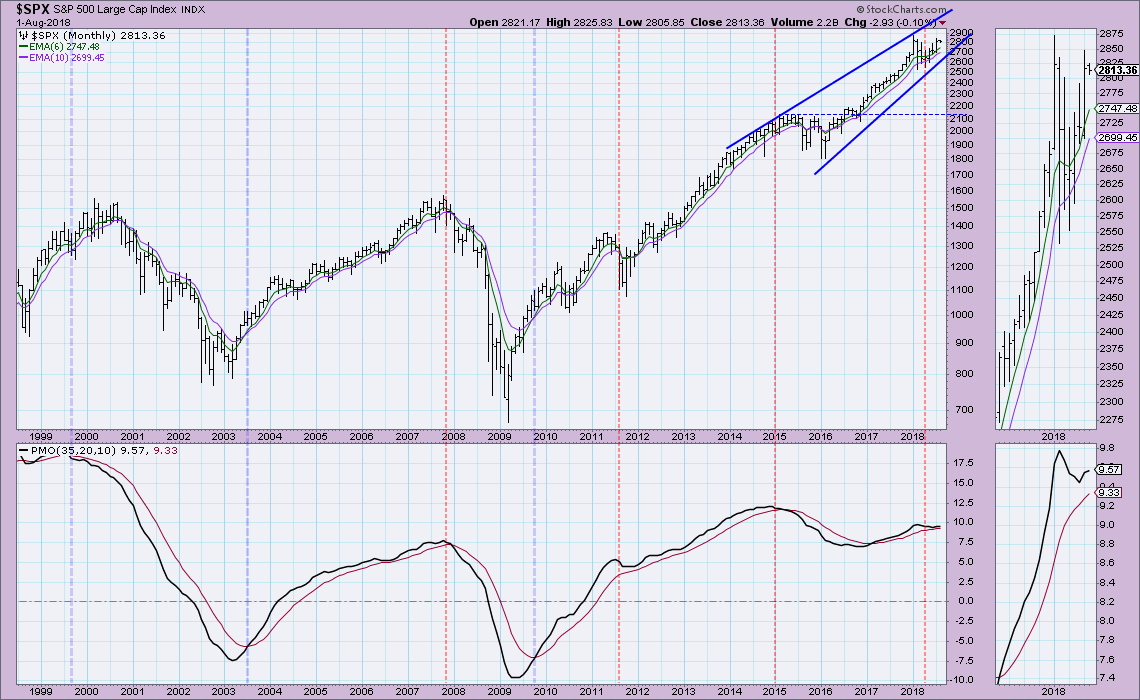
I noted during my review of the monthly charts for the MarketWatchers LIVE show, that we have a few possibly dangerous rising wedges (bearish formations). The PMO on the monthly chart is decelerating, but is still technically on the rise.
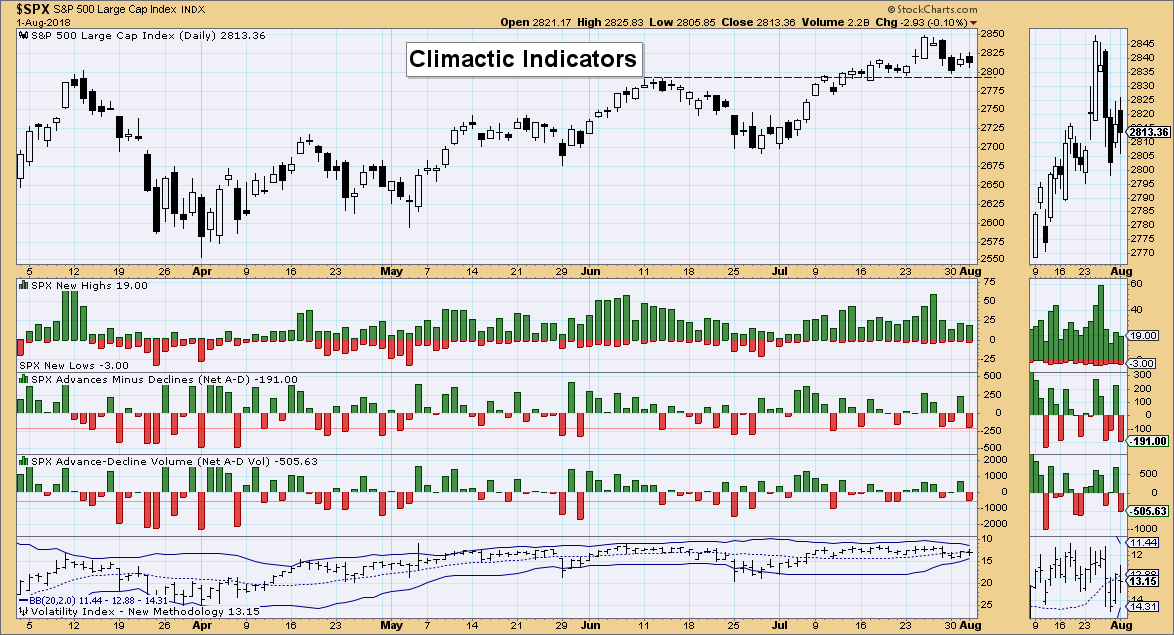
Climactic Market Indicators: Readings aren't really climactic and the VIX is situated right in the middle of its Bollinger Bands. I pointed out today that the bands are tightening and that honestly reduces the meaningfulness of any breakouts or breakdowns from the bands.
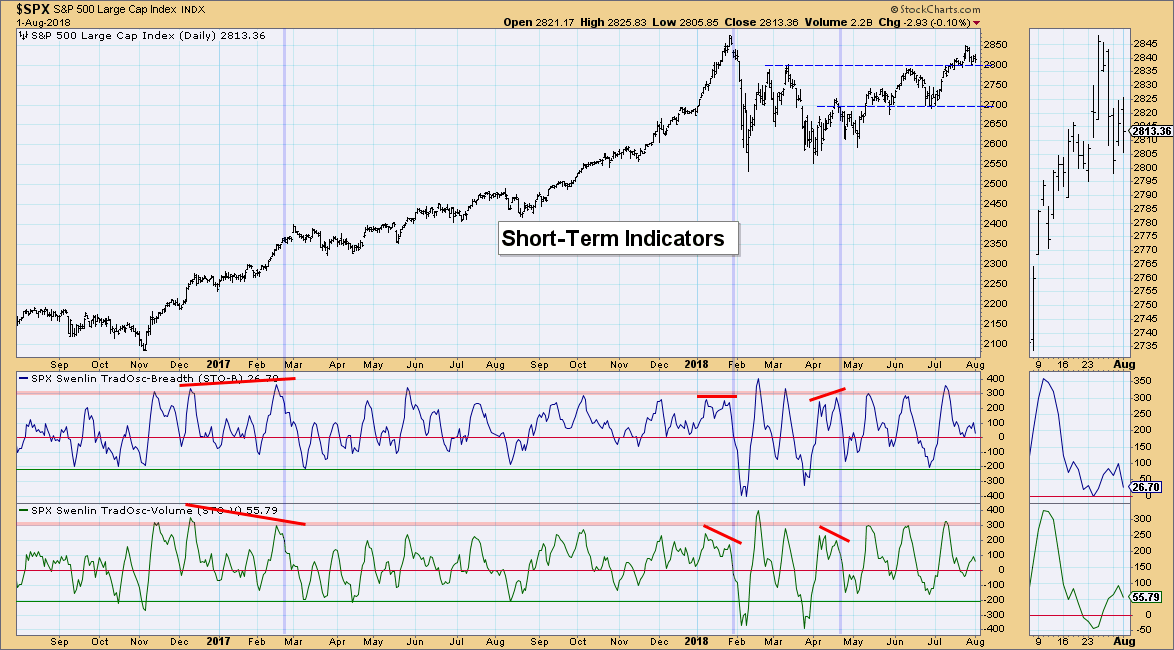
Short-Term Market Indicators: This morning these indicators were still on the rise, but today they took a dive lower into neutral territory.
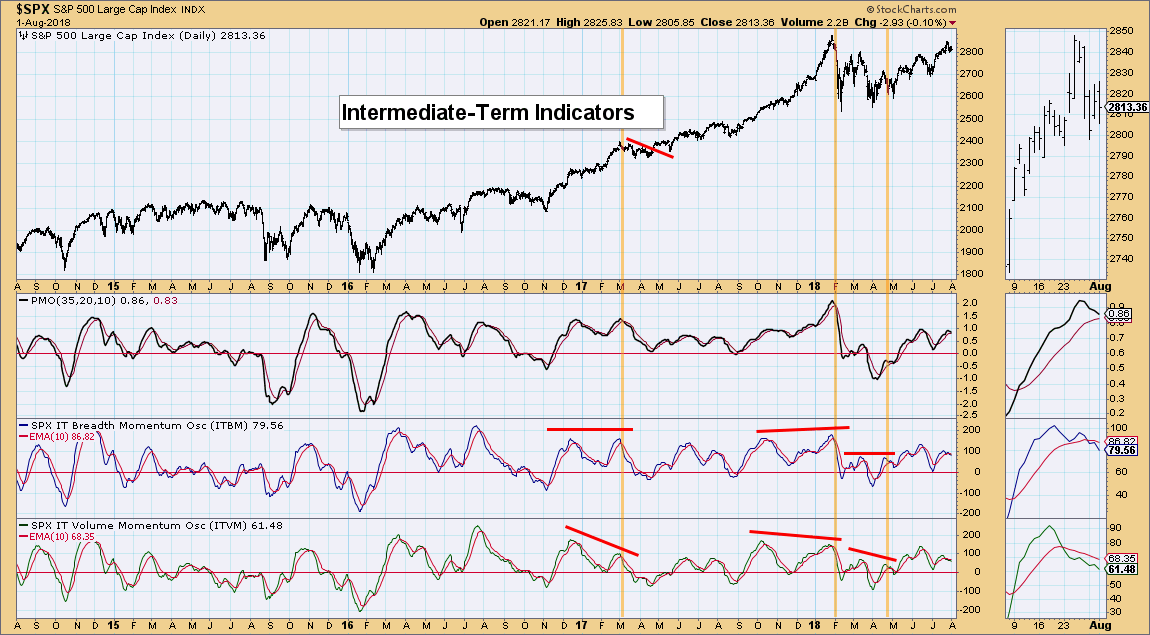
Intermediate-Term Market Indicators: These indicators were rising this morning too, but finished the day in a decline. This is not good as there is plenty of territory for them to accommodate more downside before getting even near-term oversold.
Conclusion: Technical weakness in our indicators underscores the bearish rising wedge on the monthly chart and the short-term PMO SELL signal that is lining up on the daily chart. I suspect there will be more churn as the market digests earnings, tariffs, trade, GDP, etc. I'd feel more optimistic about the upcoming week and month if my indicators were rising and not falling.
DOLLAR (UUP)
IT Trend Model: BUY as of 4/24/2018
LT Trend Model: BUY as of 5/25/2018
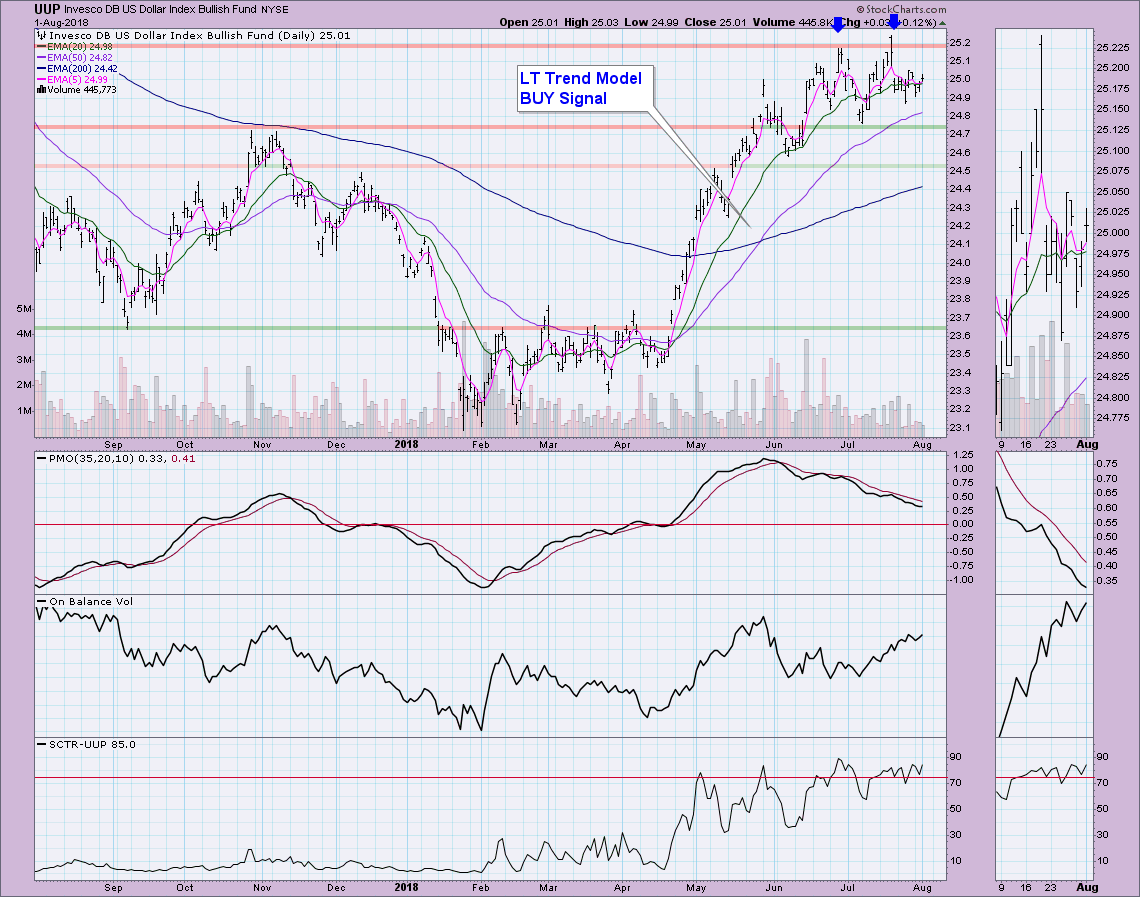
UUP Daily/Monthly Chart: I see a double-top forming on UUP with a confirmation line at about $24.75. If that were to finish forming and execute, it suggests a decline down to $24.20. The PMO seems to agree that a decline is forthcoming but OBV is rising in contradiction. I am looking for price to decline as negative momentum seems to be the more important factor.
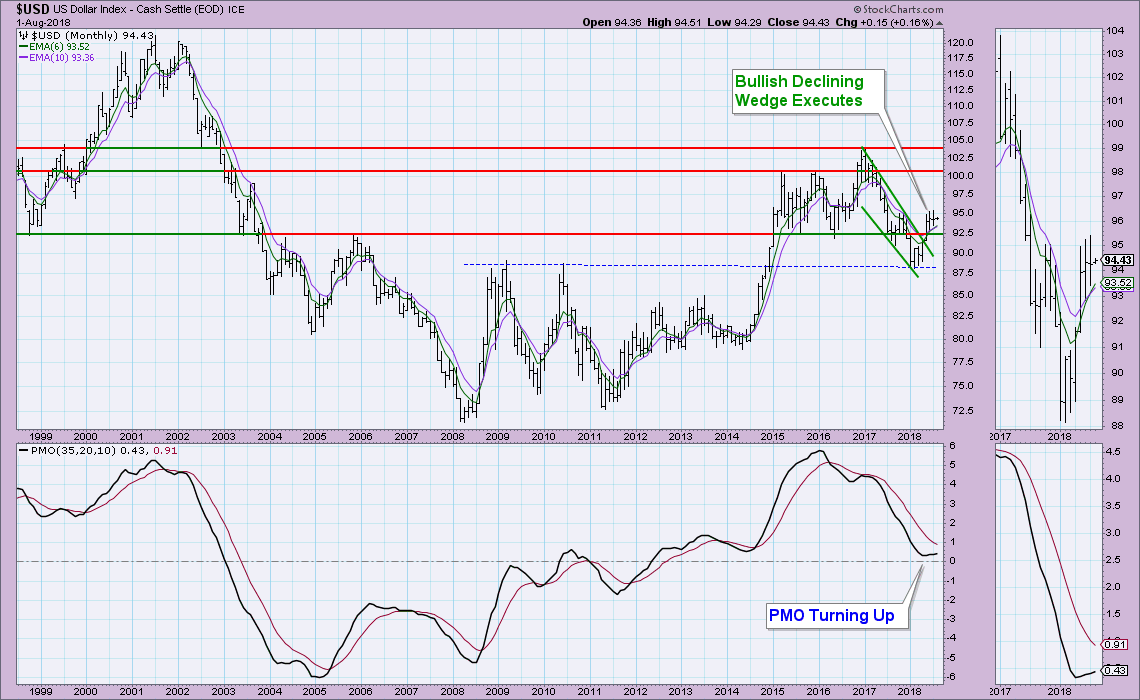
I'm not concerned about support on $USD. It looks strong. The wedge executed and using the length of the base to calculate upside potential, a move to 100.00 is possible. I think the short-term picture needs to improve right now though.
GOLD
IT Trend Model: Neutral as of 5/2/2018
LT Trend Model: SELL as of 6/22/2018
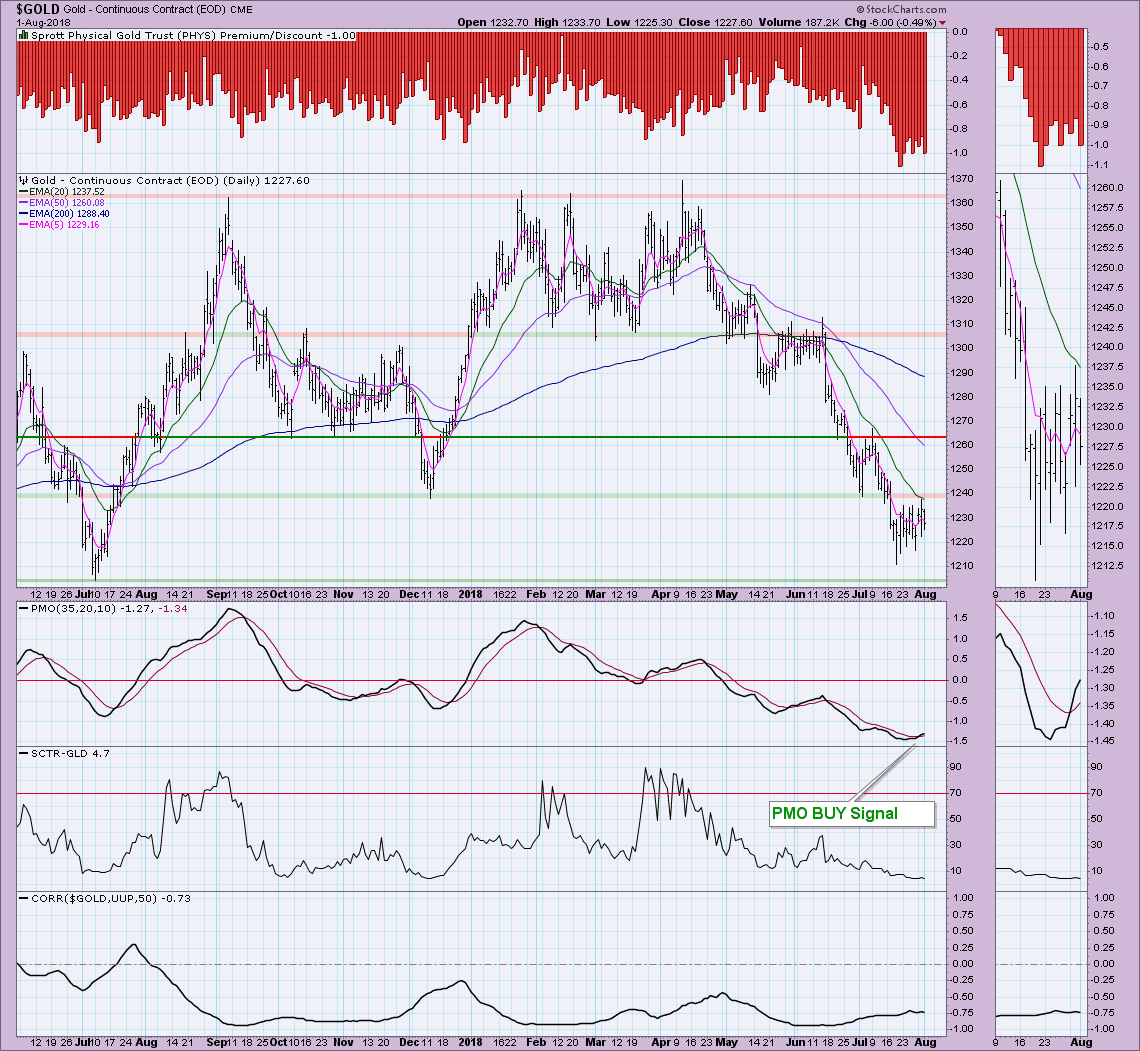
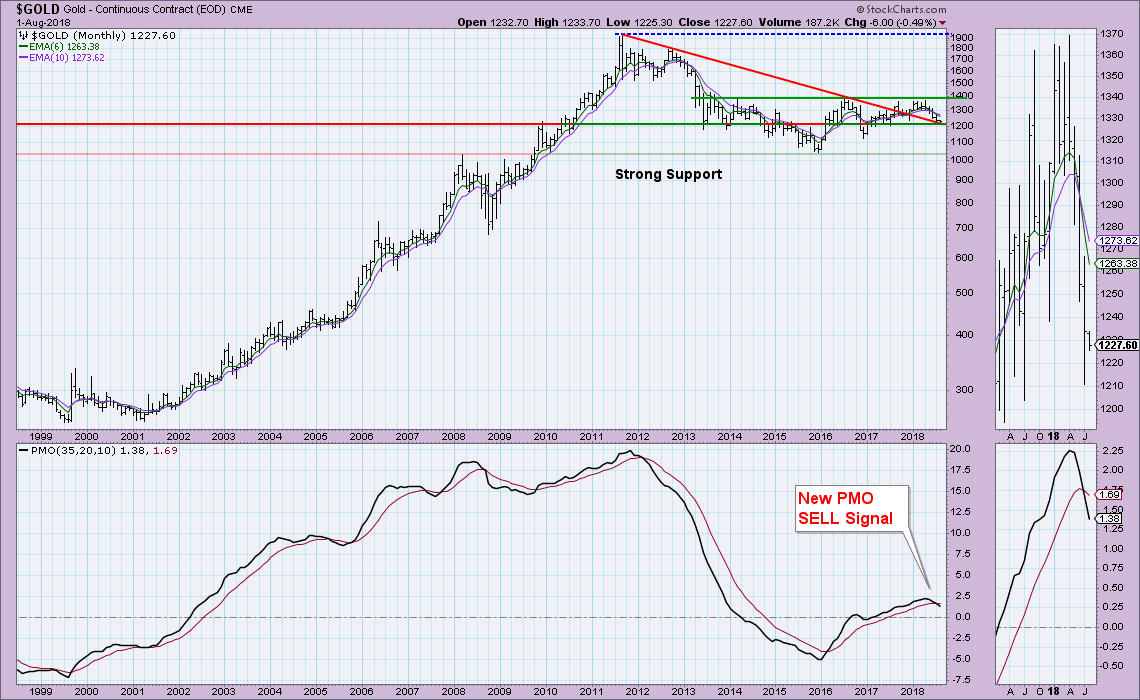
GOLD Daily Chart: Sentiment continues to be quite bearish as discounts rise further on $PHYS. Sentiment being contrarian, we should expect to see more upside for Gold. The new PMO BUY signal suggests that price could punch through overhead resistance at $1240.
Gold is sitting on very critical support at the 1200 level. It is the bottom of a trading channel and coincides with previous tops and bottoms. The declining tops trend line also adds a little support as well. Big problem is the recent PMO SELL signal. If this area of support cannot hold up, price could move as low as $1000!
CRUDE OIL (USO)
IT Trend Model: BUY as of 6/26/2018
LT Trend Model: BUY as of 11/2/2017
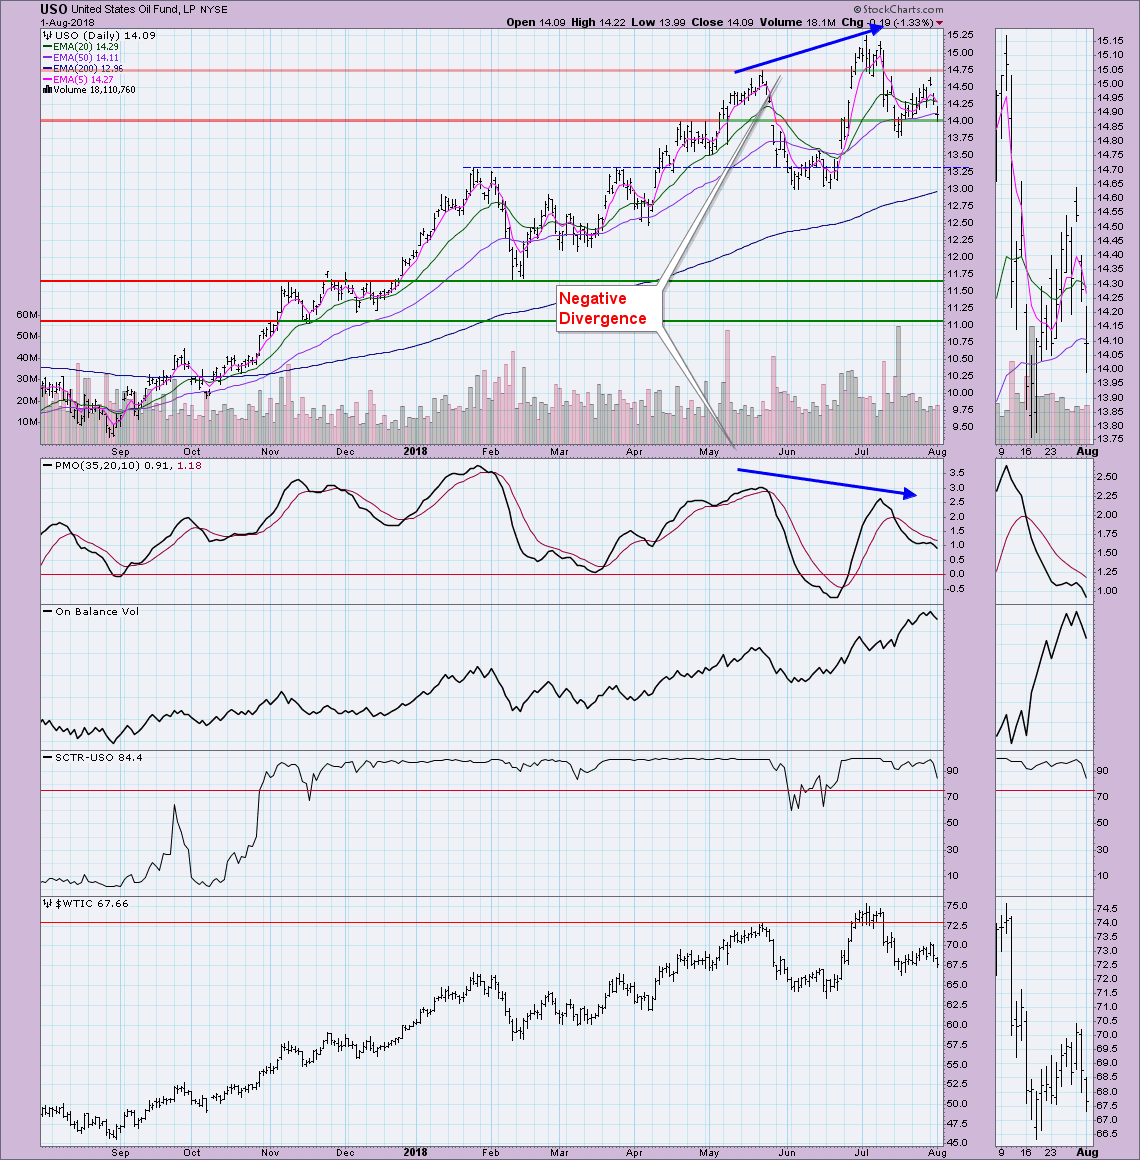
USO Daily/Monthly Chart: The negative divergence executed with the decline and since then price had been steadily moving higher. Today the bottom fell out. It is testing support at the April tops, but has not successfully held support at the 50-EMA. This is troubling when added to the PMO top below its signal line and new Short-Term Trend Model Neutral signal which executed when the 5-EMA dropped below the 20-EMA while both were above the 50-EMA.
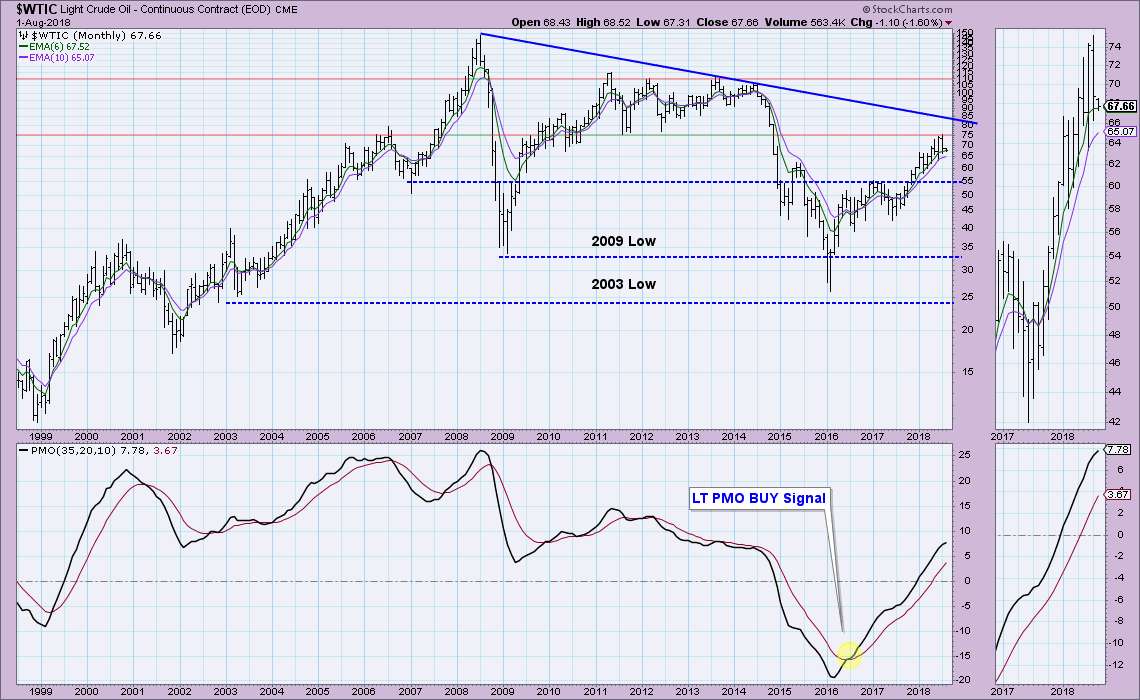
The monthly chart shows that overhead resistance at $75 is hold tightly. If price managed to breakout, it would then have to contend with declining tops line resistance. The PMO is healthy enough, but it does appear both price and the PMO are decelerating.
BONDS (TLT)
IT Trend Model: BUY as of 6/1/2018
LT Trend Model: SELL as of 8/1/2018
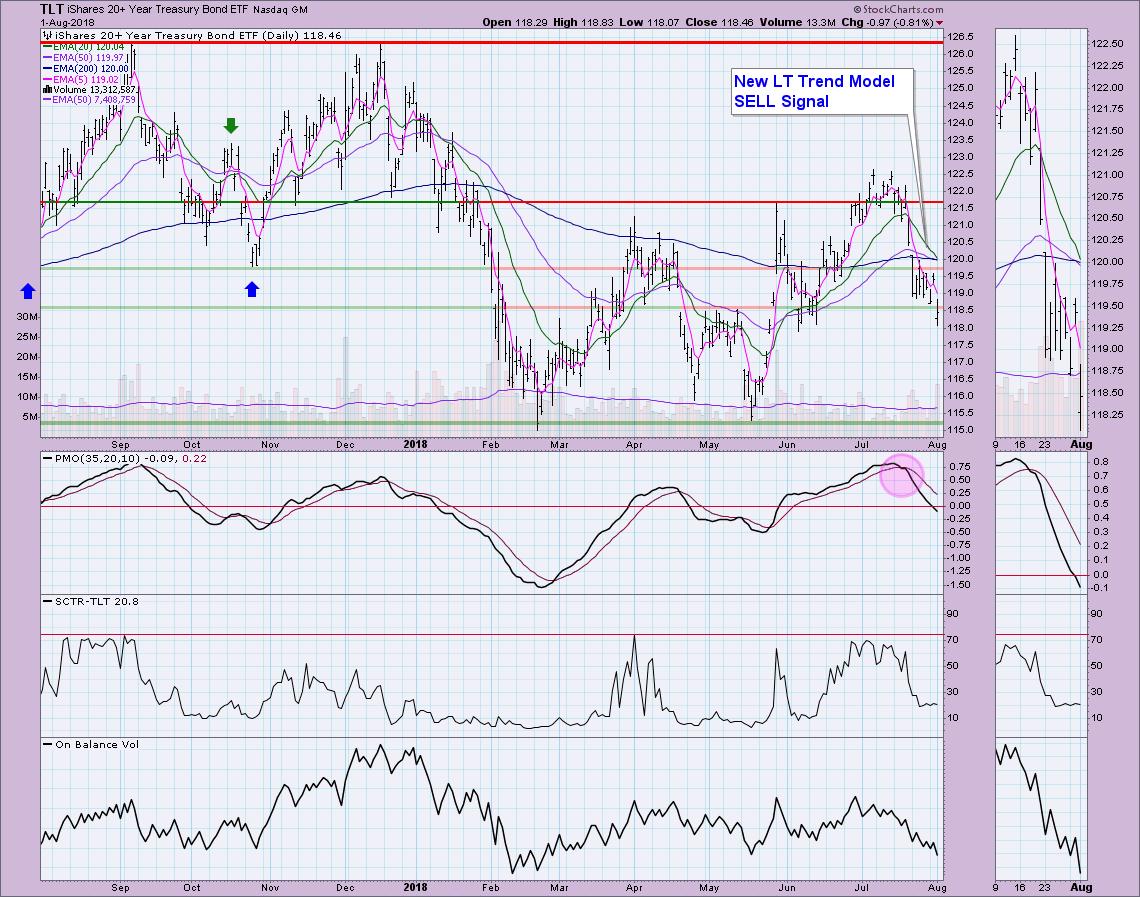
TLT Daily/Monthly Chart: I continue to be bearish on bonds, especially now that we have a Long-Term Trend Model SELL signal that triggered when the 50-EMA crossed below the 200-EMA. It is joined by a previous PMO SELL signal and declining OBV.
The monthly chart is very pessimistic. We can see a long-term head and shoulders formation that is trying to execute. Price is trying to break back above the neckline. The PMO has now reached very negative territory. Look for lower prices to continue. Support could be found along the rising bottoms trendline, but it still means a drop below 137 or so.
Technical Analysis is a windsock, not a crystal ball.
Happy Charting!
- Erin
**Don't miss any of the DecisionPoint commentaries! Go to the "Notify Me" box toward the end of this blog page to be notified as soon as they are published.**
NOTE: The signal status reported herein is based upon mechanical trading model signals, specifically, the DecisionPoint Trend Model. They define the implied bias of the price index based upon moving average relationships, but they do not necessarily call for a specific action. They are information flags that should prompt chart review. Further, they do not call for continuous buying or selling during the life of the signal. For example, a BUY signal will probably (but not necessarily) return the best results if action is taken soon after the signal is generated. Additional opportunities for buying may be found as price zigzags higher, but the trader must look for optimum entry points. Conversely, exit points to preserve gains (or minimize losses) may be evident before the model mechanically closes the signal.
Helpful DecisionPoint Links:
DecisionPoint Shared ChartList and DecisionPoint Chart Gallery
Price Momentum Oscillator (PMO)
Swenlin Trading Oscillators (STO-B and STO-V)

