On an options expiration week we normally expect low volatility, and that is what we got this week. Despite somewhat dramatic, but opposite, moves on Wednesday and Thursday, the SPY trading range for the week was a little over two percent, and the difference between the weekly closing high and low was a little over one percent. The moral is that options expiration week usually denies all options players, whether they are looking for a big move up or a big move down. It just runs out the clock.
The DecisionPoint Weekly Wrap presents an end-of-week assessment of the trend and condition of the stock market (S&P 500), the U.S. Dollar, Gold, Crude Oil, and Bonds.
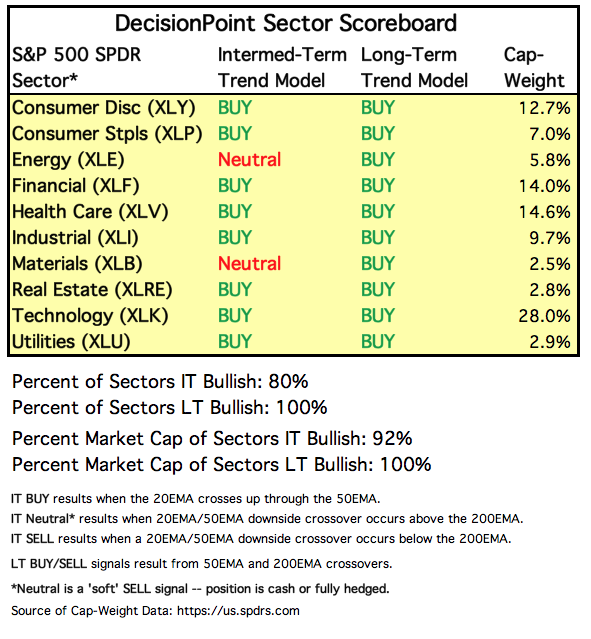
SECTORS
Each S&P 500 Index component stock is assigned to one, and only one, of 10 major sectors. This is a snapshot of the Intermediate-Term and Long-Term Trend Model signal status for those sectors.
Two sectors switched to NEUTRAL this week, but the rest look strong.
STOCKS
IT Trend Model: BUY as of 5/11/2018
LT Trend Model: BUY as of 4/1/2016
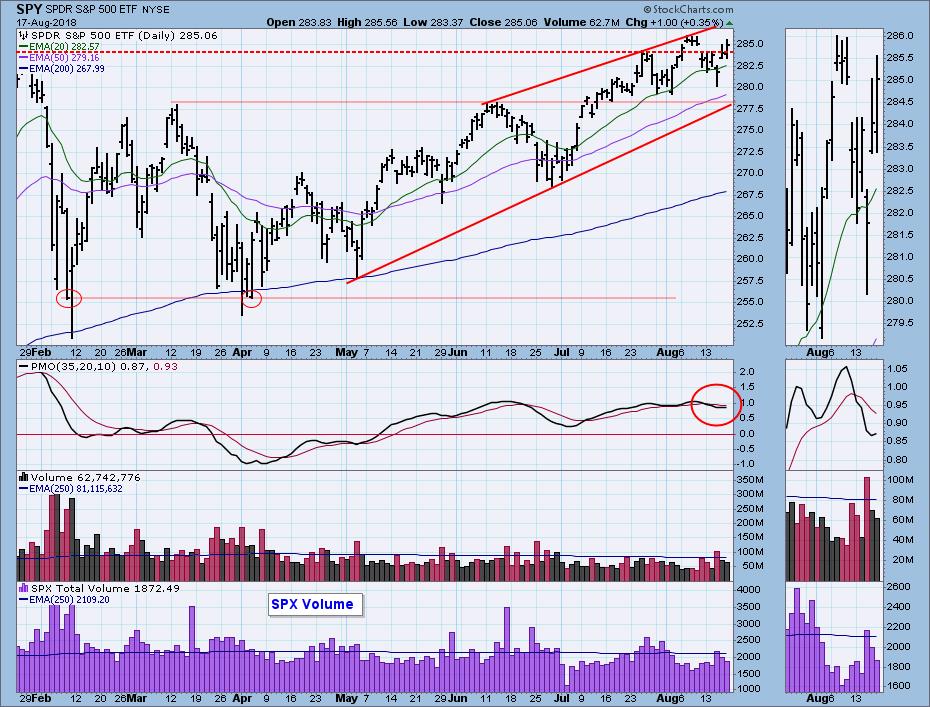
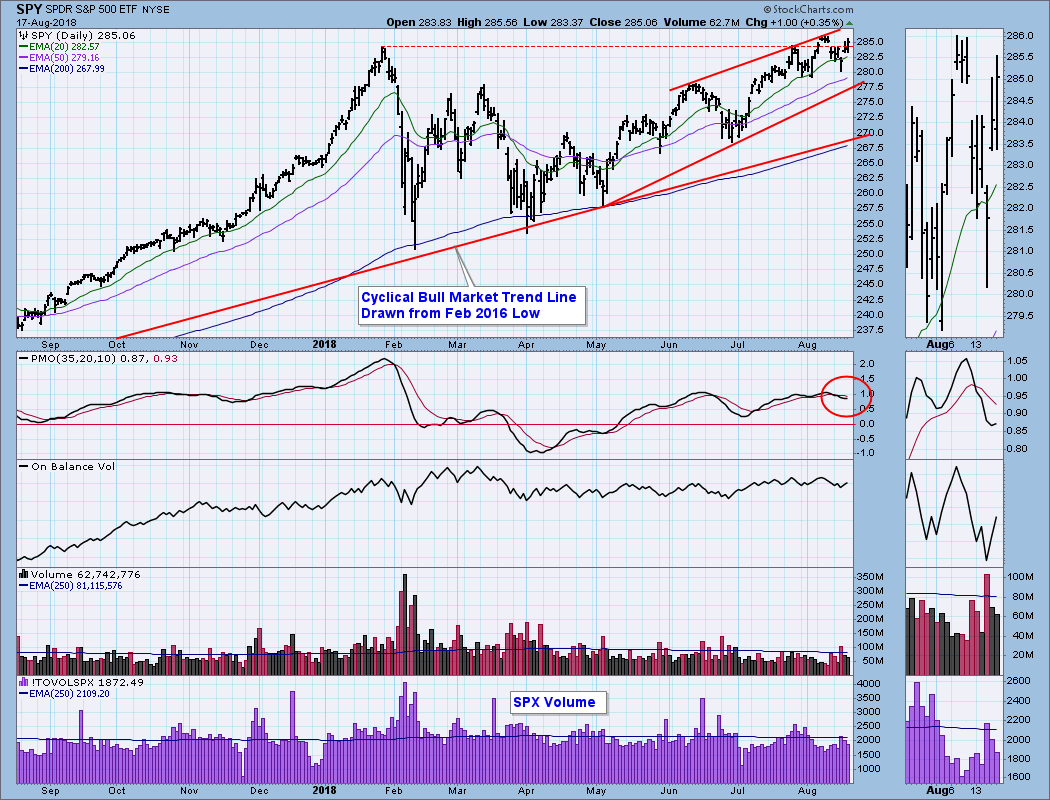
SPY Daily Chart: For an options expiration day, volume was downright puny, and that does not support today's price advance.
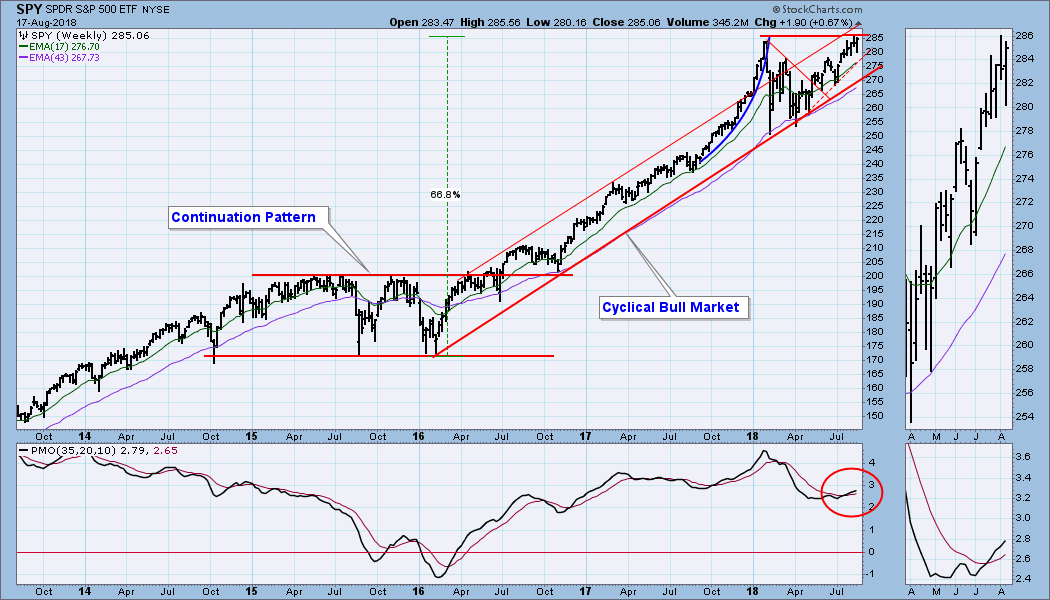
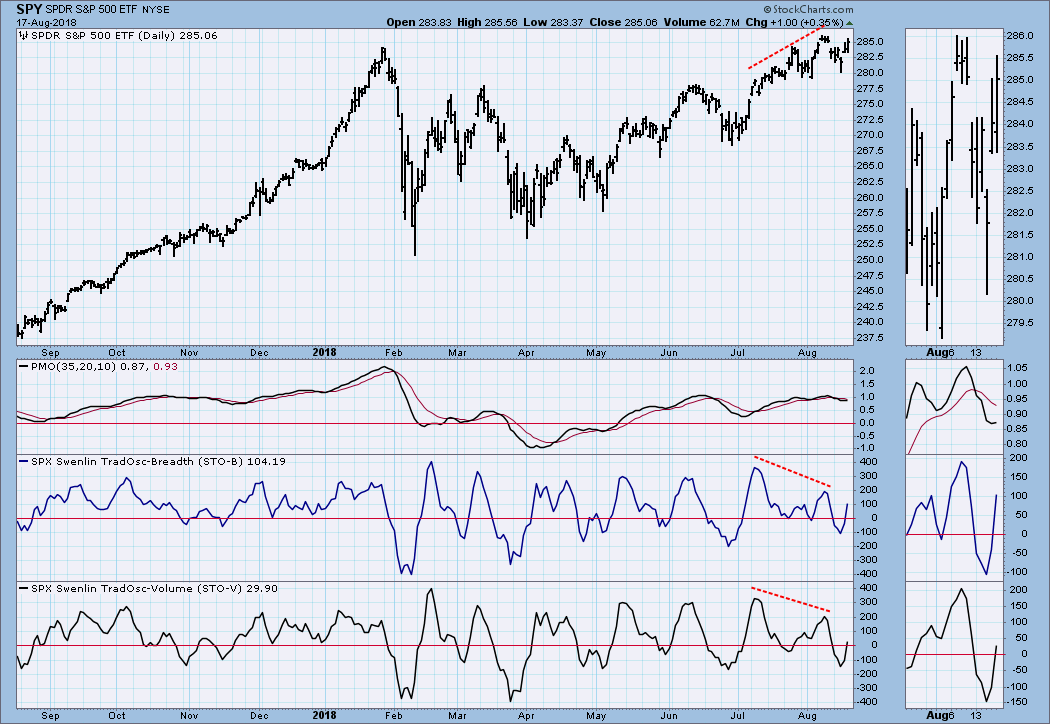
SPY Weekly Chart: While recent highs slightly exceeded January's highs, we're still looking at a potential double top formation, but we'd need to see more of a pullback to set the second top first.
Ultra-Short-Term Market Indicators: Erin has been using a VIX panel on our ultra-short-term indicator chart set, and I think it is a good idea. I use a reverse scale so that overbought and oversold readings are depicted rationally. Note how when the VIX hits the lower band it is frequently a sign that a price bottom is at hand. Of course, nothing works all the time, as was dramatically demonstrated at the beginning of the year.
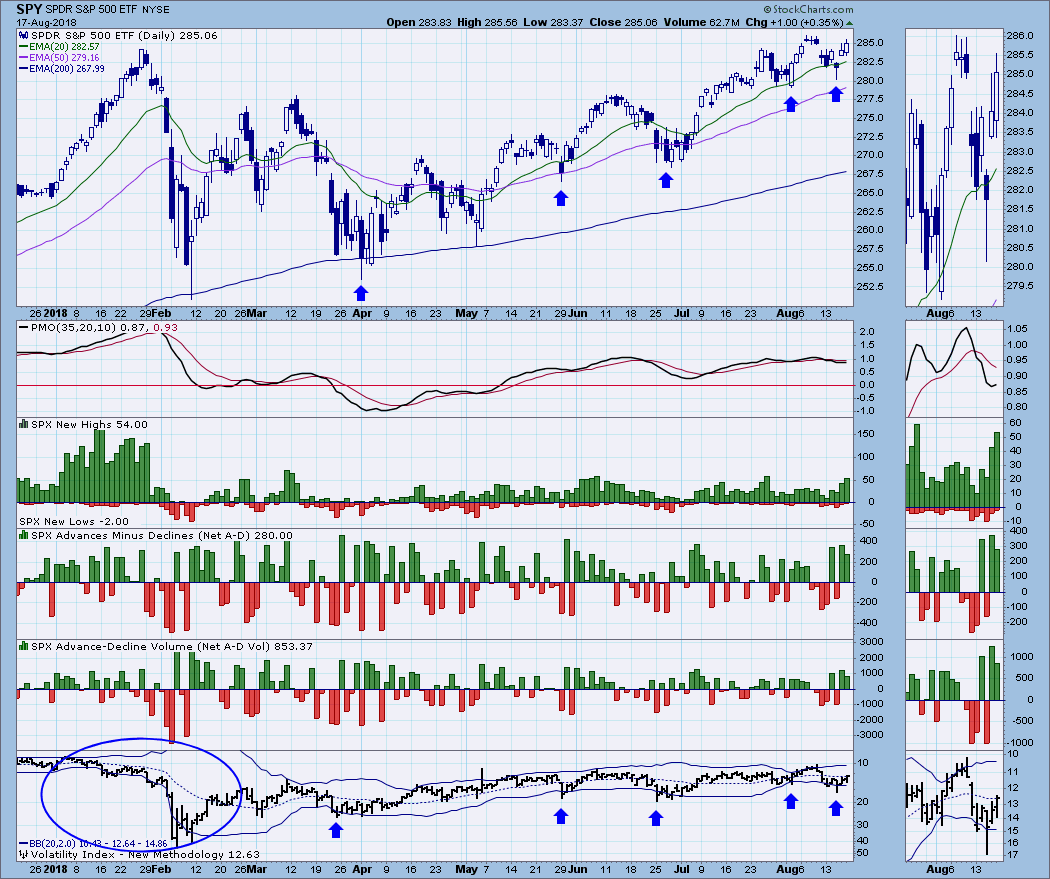
Short-Term Market Indicators: The recent bottoms on the STO-B and STO-V were made at levels that have been oversold since April. The indicator ranges during that period have been lopsided to where most of the range is above the zero line -- clearly a bull market configuration.
Intermediate-Term Market Indicators: My comment regarding short-term indicator ranges being mostly above the zero line certainly applies in this time frame. In fact, to the beginning of the cyclical bull market to find the last deeply oversold readings. All these indicators have turned up again, and they are somewhat overbought, but they have room to go either way before they get too stretched.
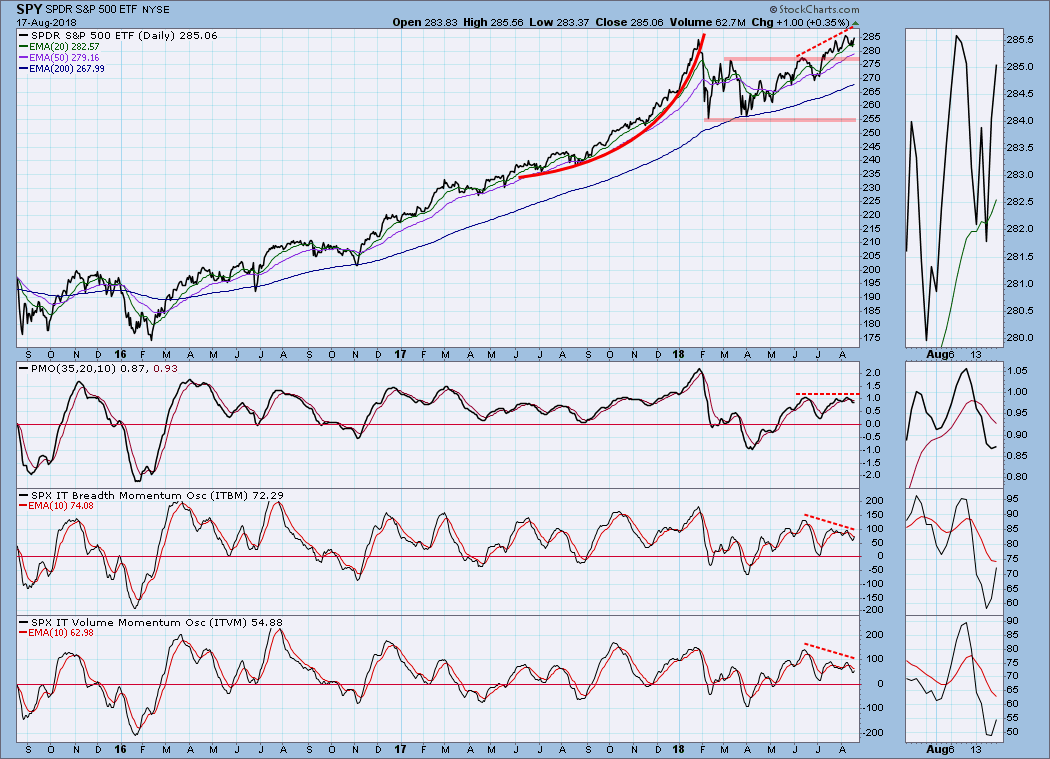
Conclusion: Last week I said: The chart immediately above gives a very good technical summary: the market is overbought, price is potentially forming a double top, and the negative divergences are unanimous. I am expecting weakness next week, and it could last a while. I think I'll go with that for another week.
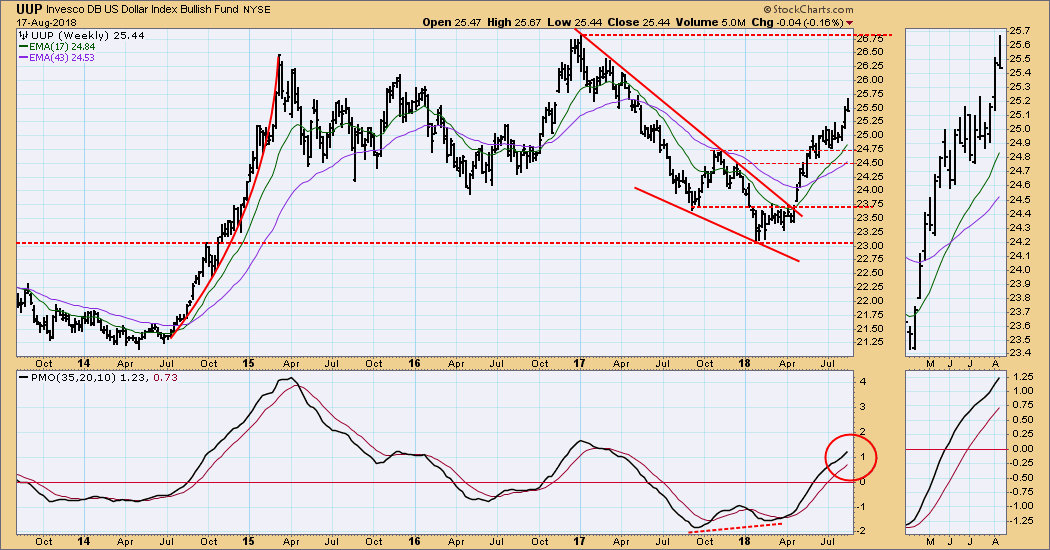
DOLLAR (UUP)
IT Trend Model: BUY as of 4/24/2018
LT Trend Model: BUY as of 5/25/2018
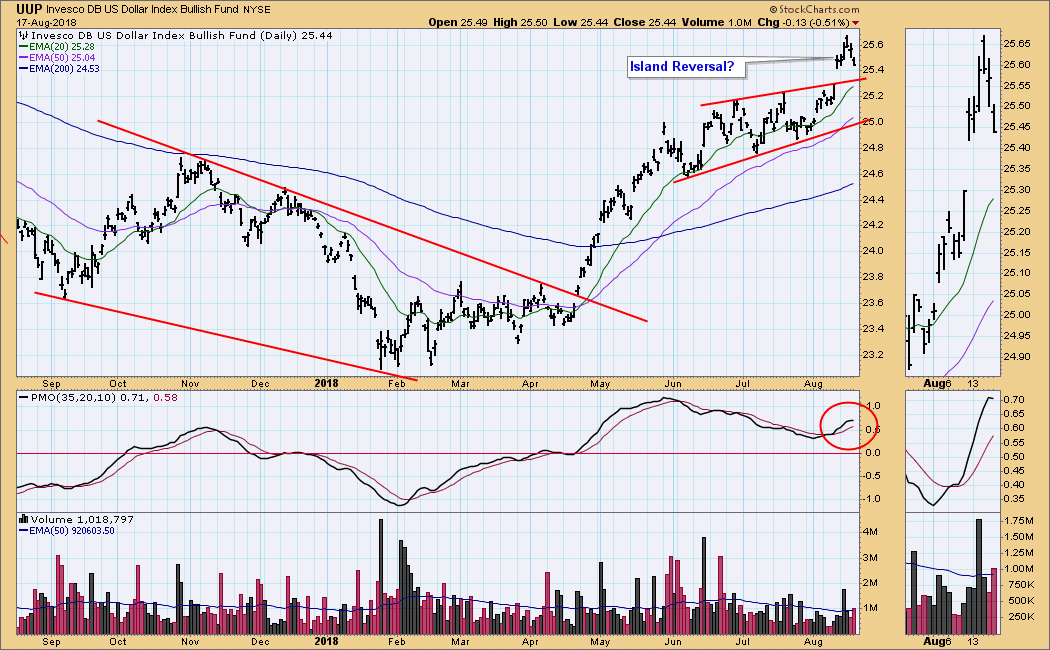
UUP Daily Chart: The breakout cluster looks like a possible island reversal. If that is what it is, we can expect price to break down across the gap soon. No guarantees, of course.
UUP Weekly Chart: In this time frame, it looks as if UUP has made a top, with the close being near the week's lows. UUP has gotten a bit over-extended in the last two weeks, so at least a consolidation is needed.
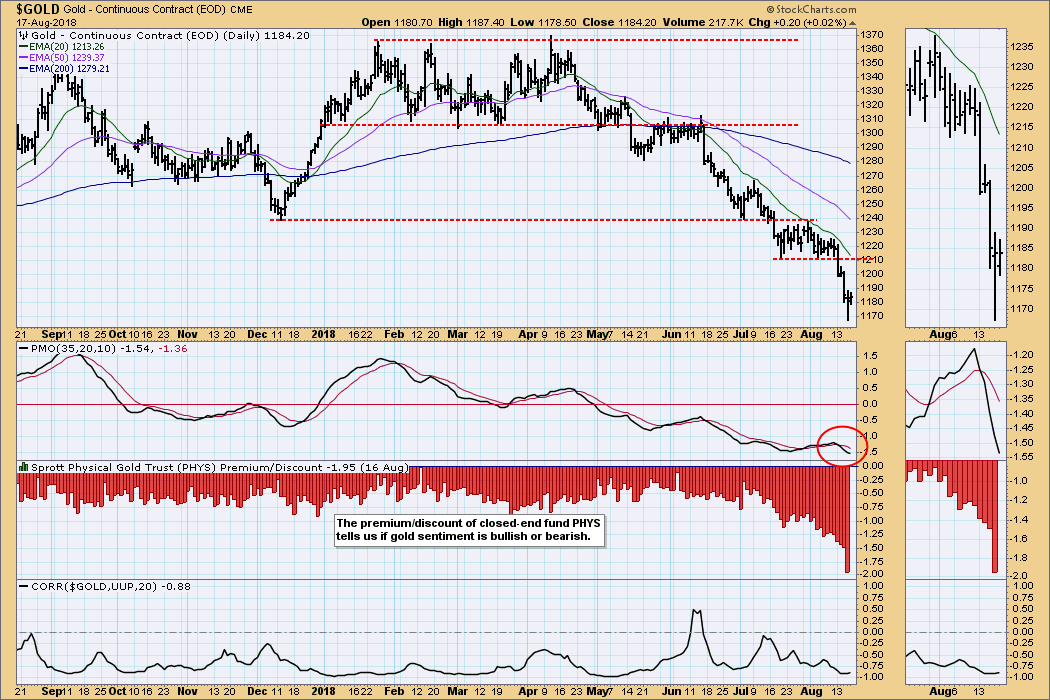
GOLD
IT Trend Model: NEUTRAL as of 5/2/2018
LT Trend Model: SELL as of 6/22/2018
GOLD Daily Chart: Gold had been consolidating around 52-week lows for about a month, but it broke down on Monday and stretched to lower lows this week. Sentiment grew a lot more negative this week.
GOLD Weekly Chart: The support just vacated looks more important in this time frame. The next obvious support is at about 1120.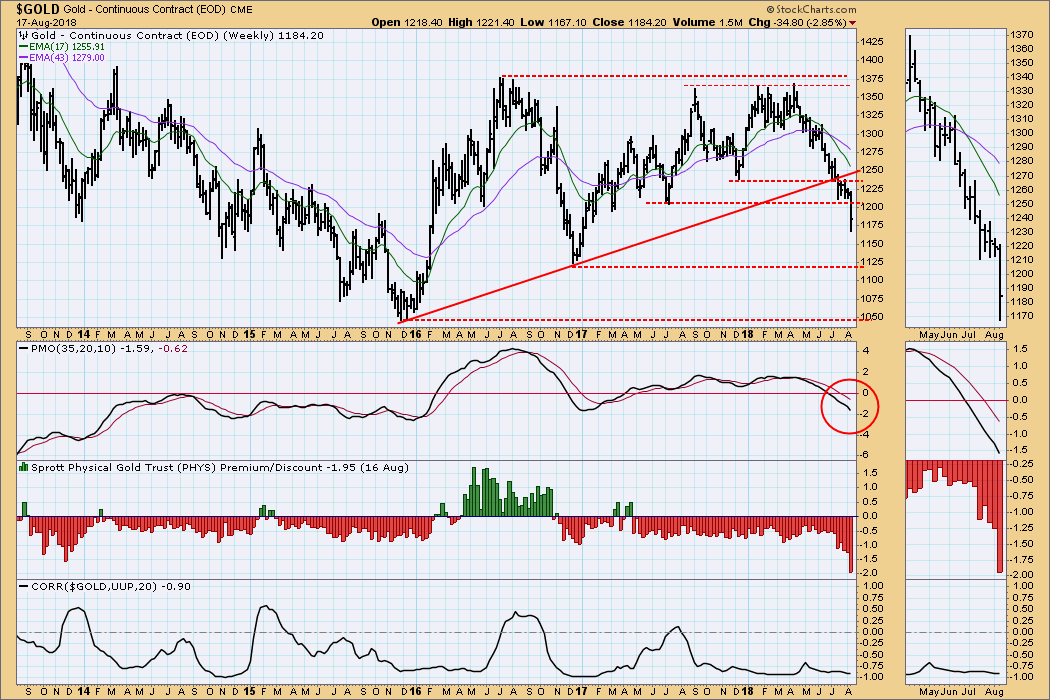
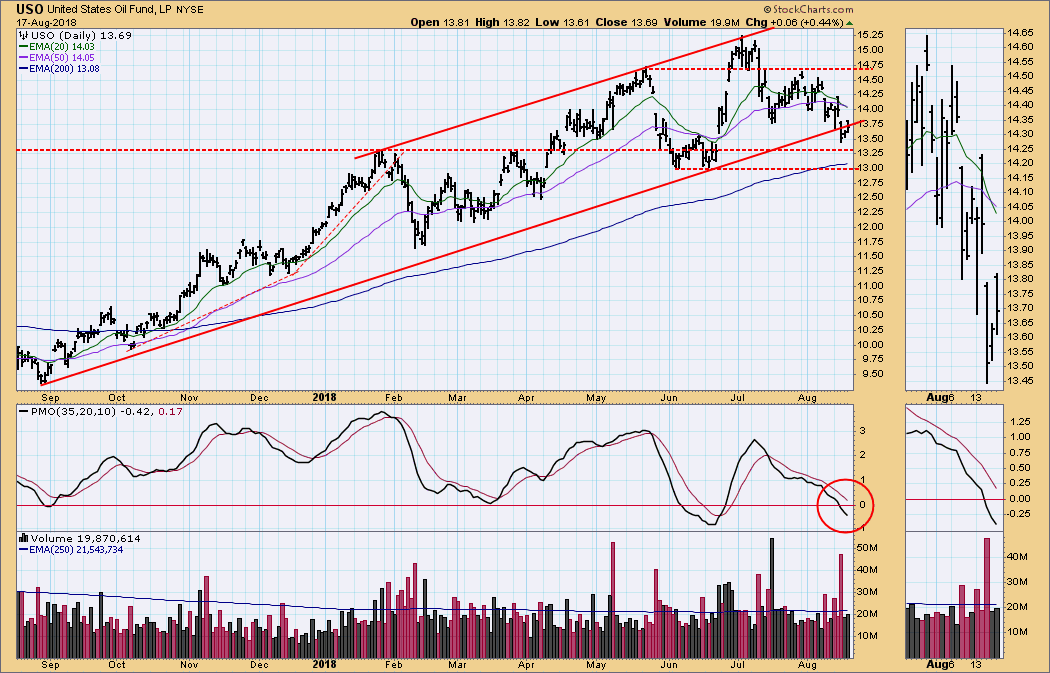
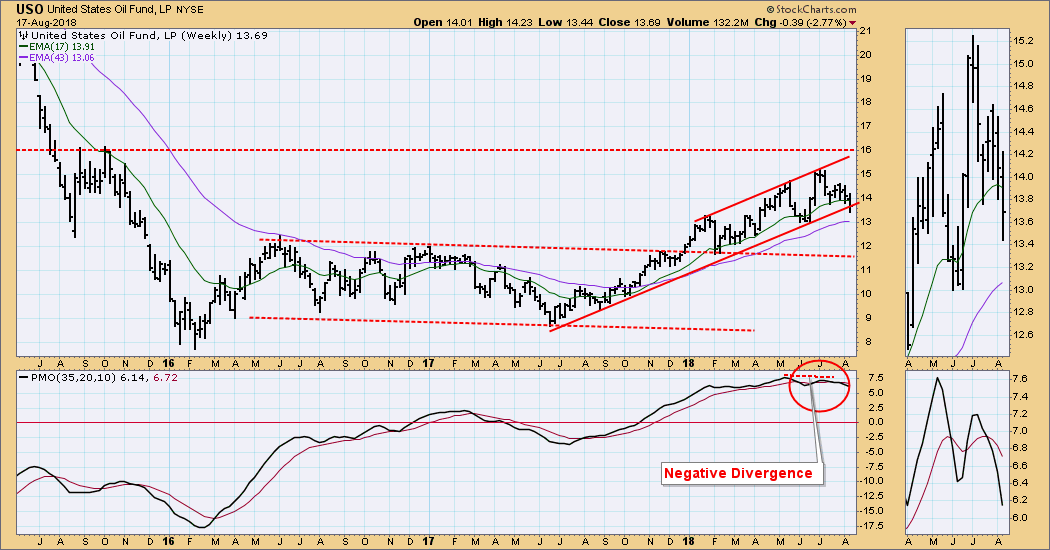
CRUDE OIL (USO)
IT Trend Model: NEUTRAL as of 8/16/2018
LT Trend Model: BUY as of 11/2/2017
USO Daily Chart: USO broke the rising trend line on Wednesday and failed to recapture it on Friday. The daily PMO is solidly negative. The 20EMA crossed down through the 50EMA, so the IT Trend Model changed from BUY to NEUTRAL.
USO Weekly Chart: The rising trend line is drawn somewhat differently in this time frame, and it remains intact; however, the weekly PMO is below the signal line and falling, so a negative outcome is likely.
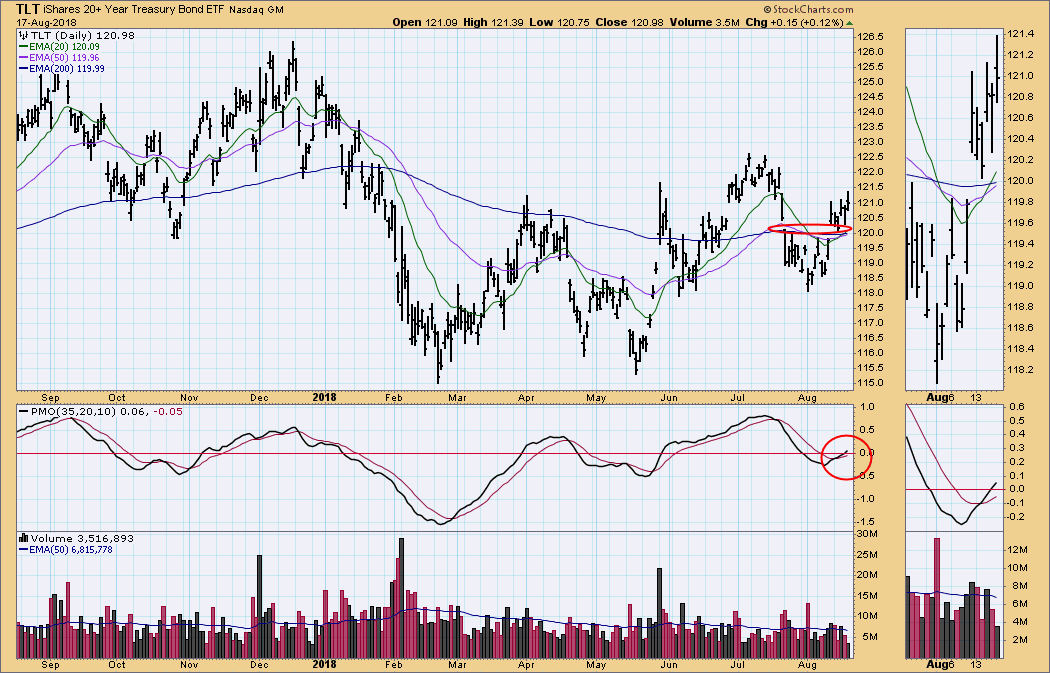
BONDS (TLT)
IT Trend Model: BUY as of 8/15/2018
LT Trend Model: SELL as of 8/1/2018
TLT Daily Chart: Price has executed an island reversal, and seems headed higher. The IT Trend Model (ITTM) generated a new BUY signal on Wednesday, but price has been moving sideways, and there have been three ITTM signal changes in as many months. Also, unless price drops below the EMAs, the LT Trend Model will switch to a BUY signal next week.
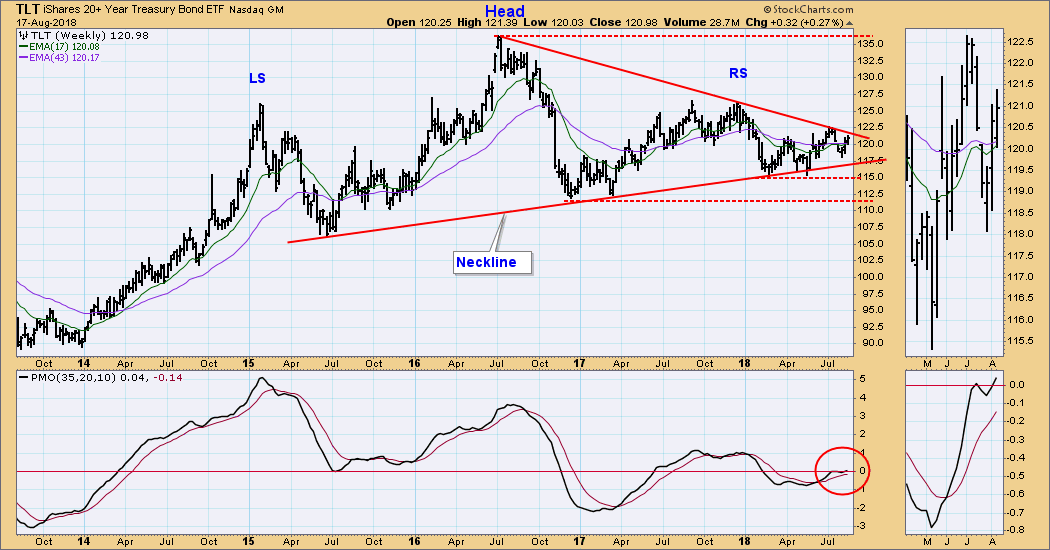
TLT Weekly Chart: The bearish head and shoulders pattern still dominates the chart, but the weekly PMO is bullish, and implies that price will break out of the head and shoulders, neutralizing the pattern.
**Don't miss any of the DecisionPoint commentaries! Go to the "Notify Me" box toward the end of this blog page to be notified as soon as they are published.**
Technical Analysis is a windsock, not a crystal ball.
Happy Charting!
- Carl
NOTE: The signal status reported herein is based upon mechanical trading model signals, specifically, the DecisionPoint Trend Model. They define the implied bias of the price index based upon moving average relationships, but they do not necessarily call for a specific action. They are information flags that should prompt chart review. Further, they do not call for continuous buying or selling during the life of the signal. For example, a BUY signal will probably (but not necessarily) return the best results if action is taken soon after the signal is generated. Additional opportunities for buying may be found as price zigzags higher, but the trader must look for optimum entry points. Conversely, exit points to preserve gains (or minimize losses) may be evident before the model mechanically closes the signal.
Helpful DecisionPoint Links:
DecisionPoint Shared ChartList and DecisionPoint Chart Gallery
Price Momentum Oscillator (PMO)
Swenlin Trading Oscillators (STO-B and STO-V)


