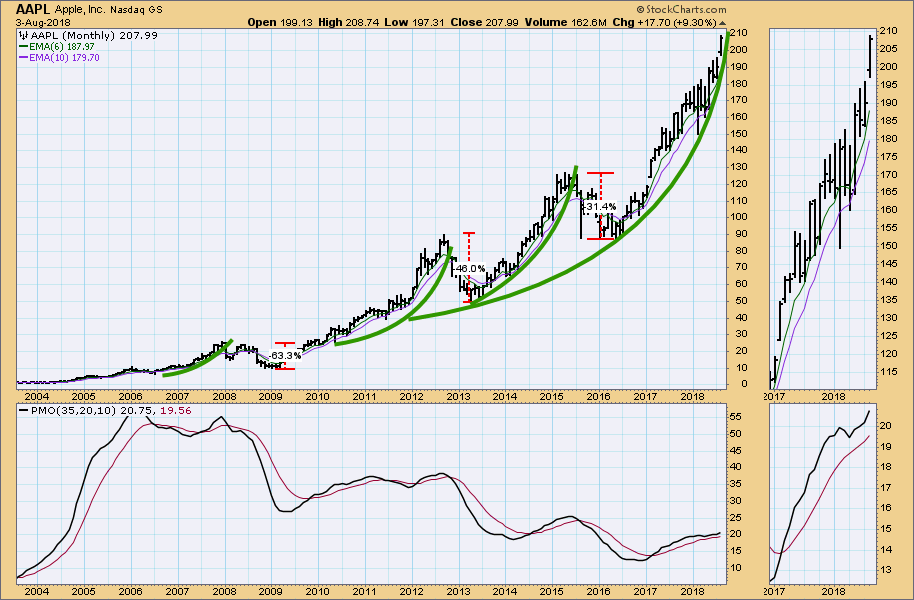
On Thursday, when Apple's (AAPL) market cap went over the $1 trillion mark, Dennis Gartman (The Gartman Letter) said something to the effect that this is the kind of thing we see at market tops, not in the middle of a long advance. I felt the same way. I don't know if he does fist bumps, but I gave him an imaginary one anyway. As we can see on the chart, AAPL has had some spectacular parabolic advances, but they were followed by some horrendous declines. Sure, AAPL is a great company, but I see no reason why history won't repeat itself. Parabolic excesses need to be corrected.
To be clear, I'm not calling for a top. I'm saying "watch out!" We can't tell when a parabolic move will finally stall, and price could go a lot higher; however, vertical advances tend to correct vertically as well, so we're probably not looking at an ideal buying point. As for the downside target? Enough sacrilege for one article -- let's wait for it to break down before we go there.
The DecisionPoint Weekly Wrap presents an end-of-week assessment of the trend and condition of the stock market (S&P 500), the U.S. Dollar, Gold, Crude Oil, and Bonds.
SECTORS
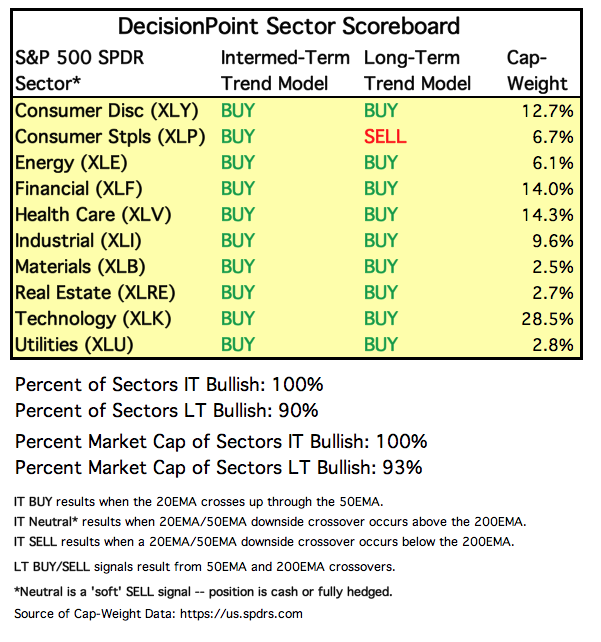
Each S&P 500 Index component stock is assigned to one, and only one, of 10 major sectors. This is a snapshot of the Intermediate-Term and Long-Term Trend Model signal status for those sectors.
STOCKS
IT Trend Model: BUY as of 5/11/2018
LT Trend Model: BUY as of 4/1/2016
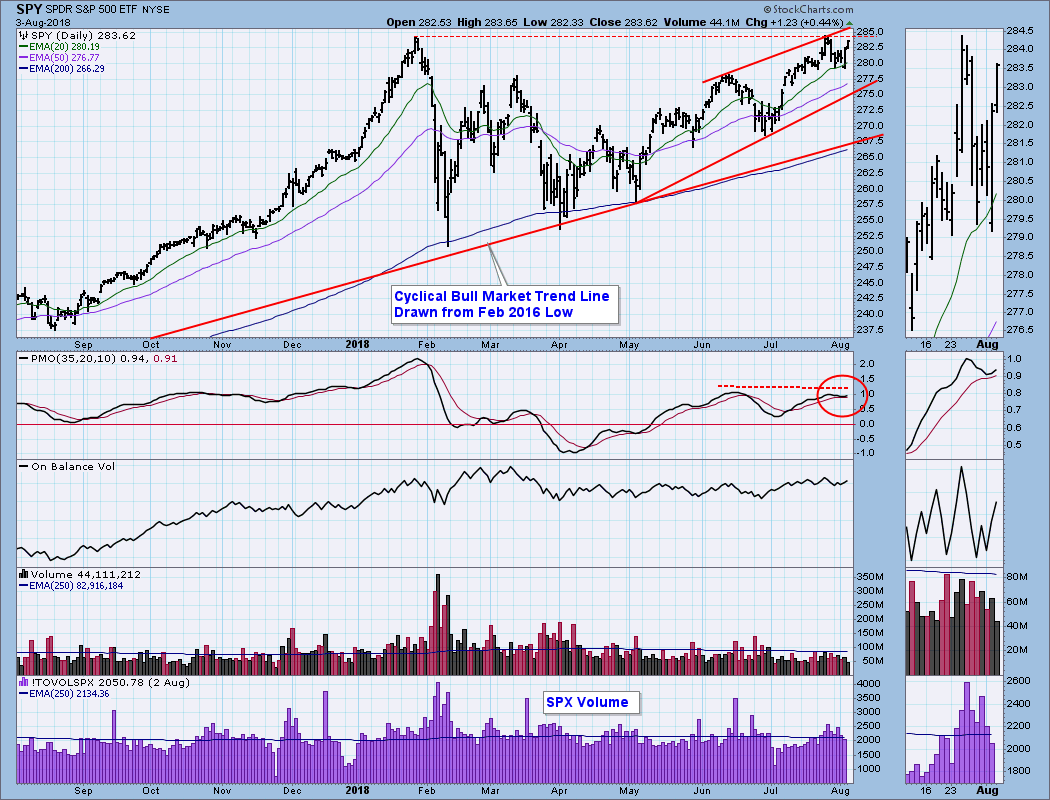
SPY Daily Chart: After topping last week, price did not retreat to the rising trend line, but is headed back toward the line of resistance drawn across the all-time high. The daily PMO has bottomed above the signal line.
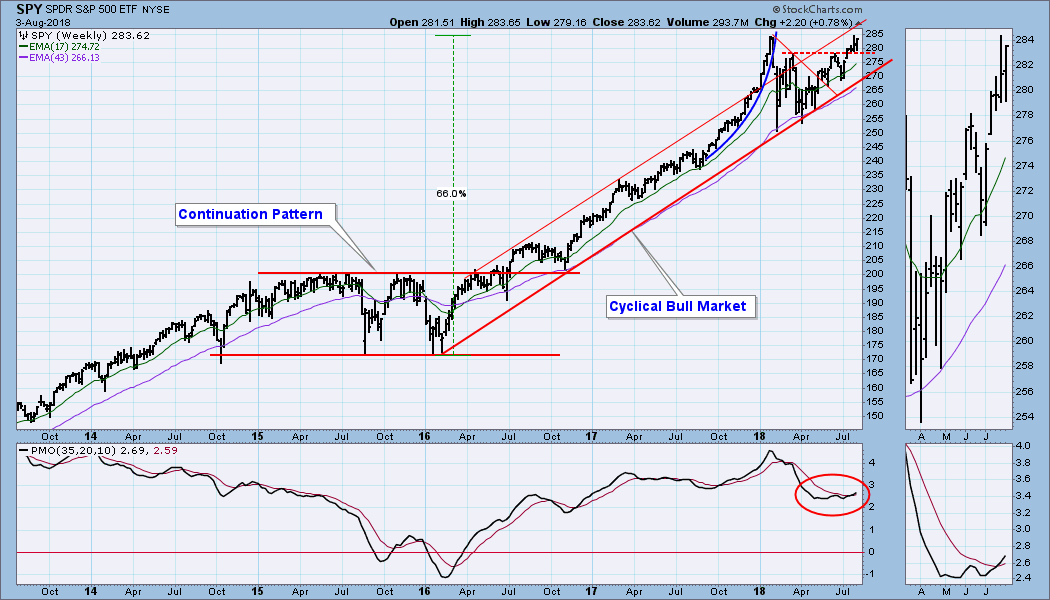
SPY Weekly Chart: Price remains within the cyclical bull market rising trend channel, and is moving toward the top of the channel. The weekly PMO looks especially bullish, having made a double bottom and having crossed up through the signal line.
Short-Term Market Indicators: The STO-B and STO-V and can accommodate a large move in either direction.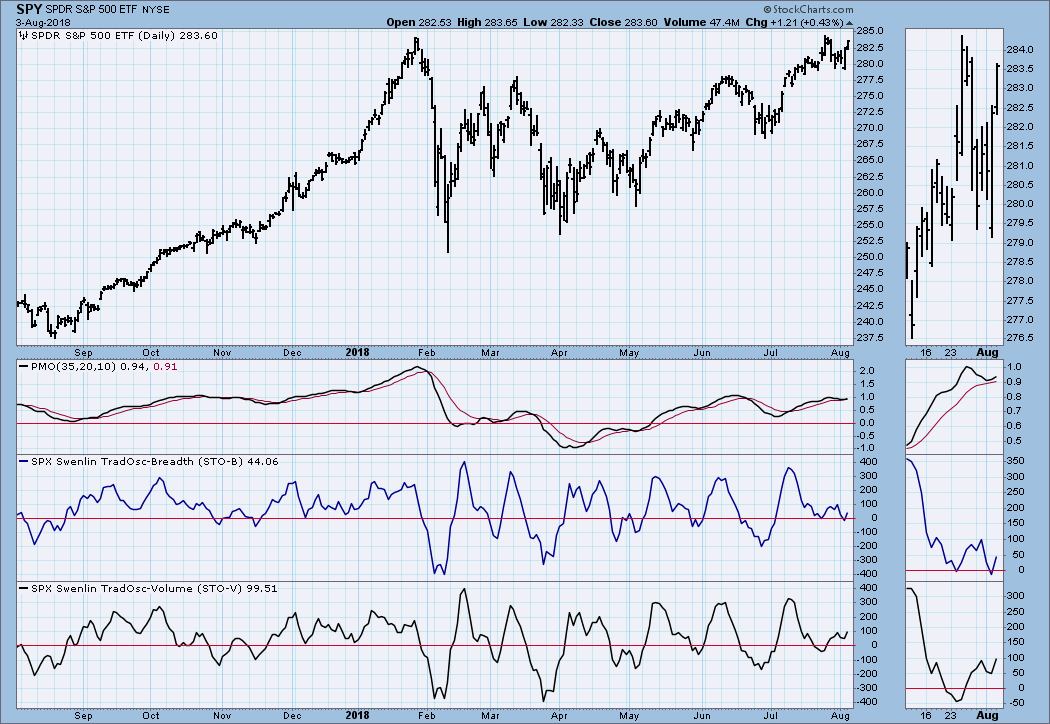
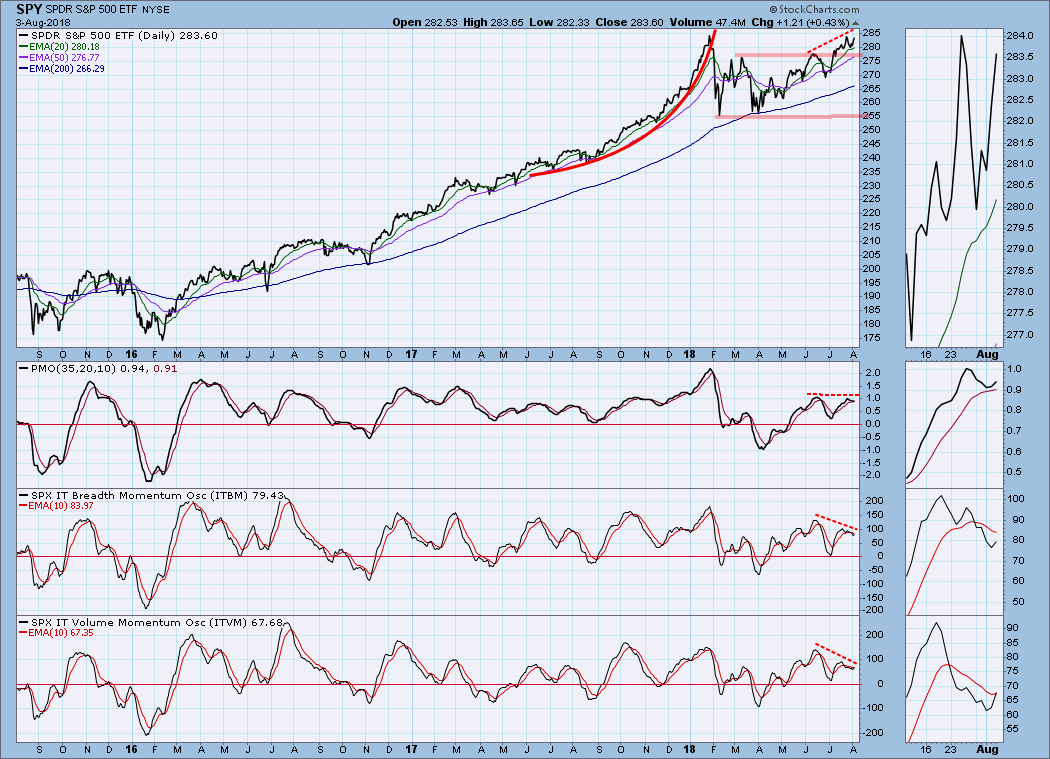
Intermediate-Term Market Indicators: Here we have a trio of negative divergences, but all three indicators are rising, and they are not so overbought as to interfere with higher prices.
Conclusion: Last week I thought that there was a good chance of a correction this week, but the market pressed higher instead. I'm not sure how much of that was a halo effect from AAPL, but I have to accept it as a bullish sign. Price is moving higher in spite of negative divergences on our three primary intermediate-term indicators (chart above), so I think there is a good chance that we'll be seeing new, all-time highs next week.
DOLLAR (UUP)
IT Trend Model: BUY as of 4/24/2018
LT Trend Model: BUY as of 5/25/2018
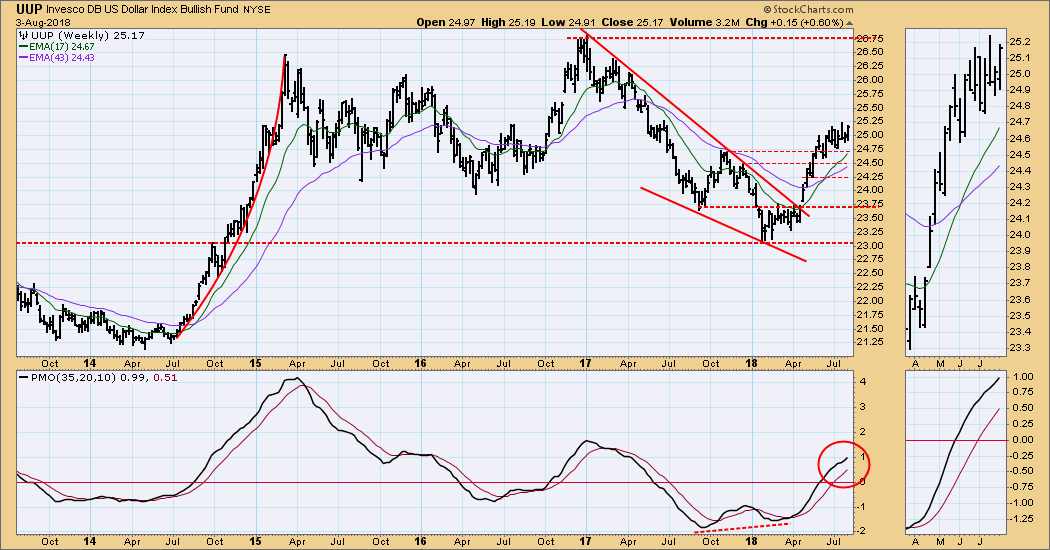
UUP Daily Chart: Apparently, the dollar doesn't want to pull back, and UUP is approaching 52-week highs. There is a PMO negative divergence, but the PMO has turned up again.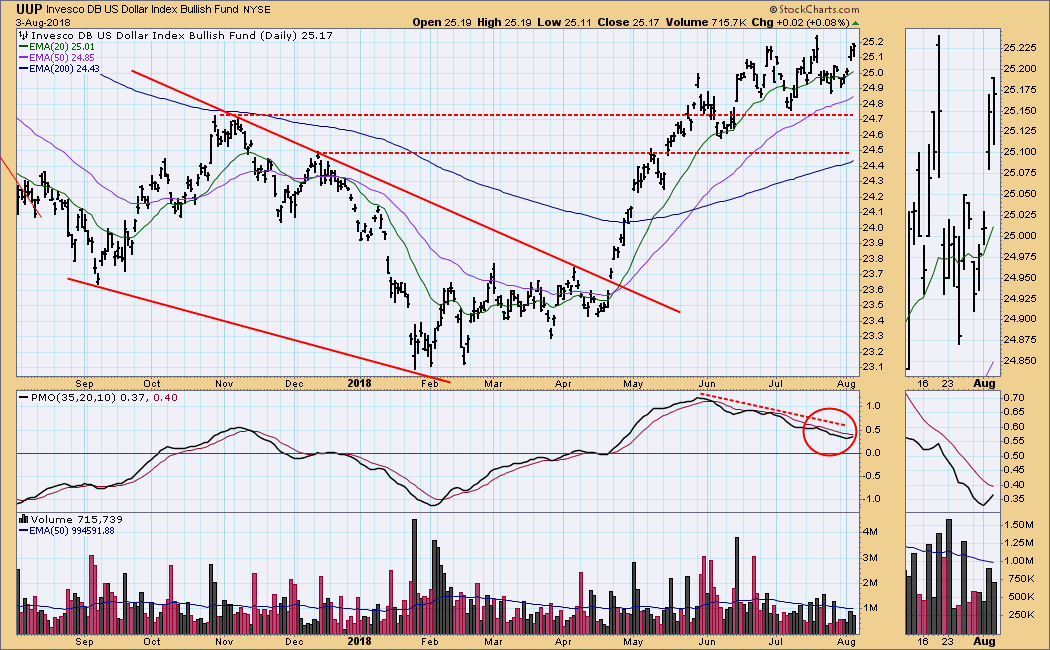
UUP Weekly Chart: Very bullish. A correction would be nice, but it does not seem to be forthcoming.
GOLD
IT Trend Model: NEUTRAL as of 5/2/2018
LT Trend Model: SELL as of 6/22/2018
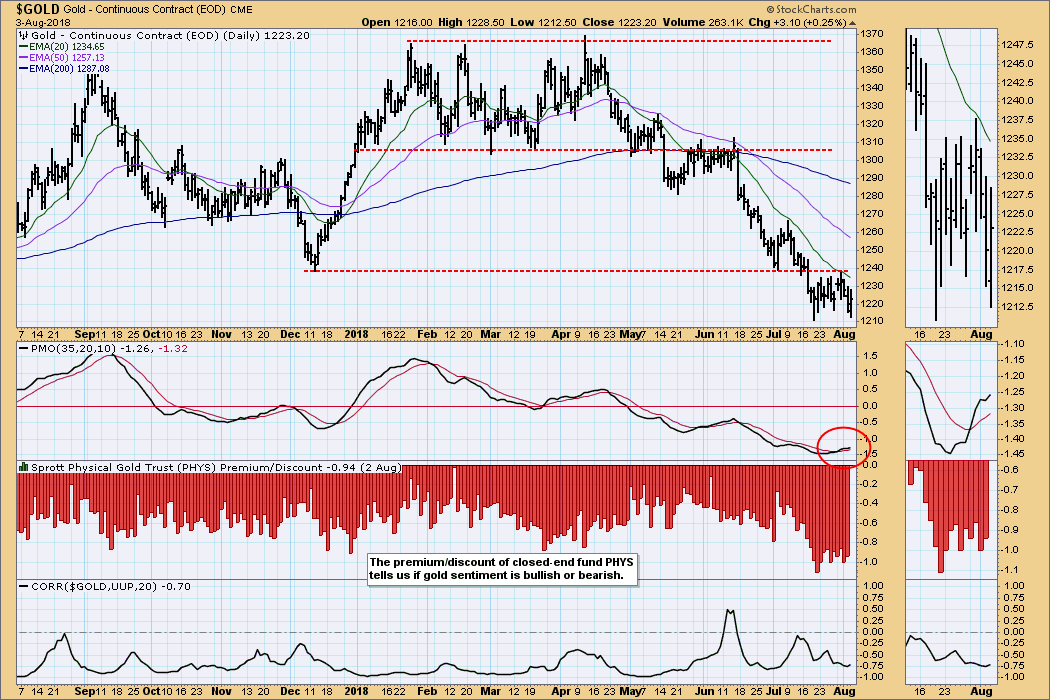
GOLD Daily Chart: After breaking support at 1240, gold has been consolidating for two weeks. Sentiment has been running at its most bearish level for a year. The daily PMO has crossed up through the signal line, but it is not rising with any vigor.
GOLD Weekly Chart: There is no encouragement in this time frame. Gold has been declining since the April top, and the weekly PMO is below the zero line and falling.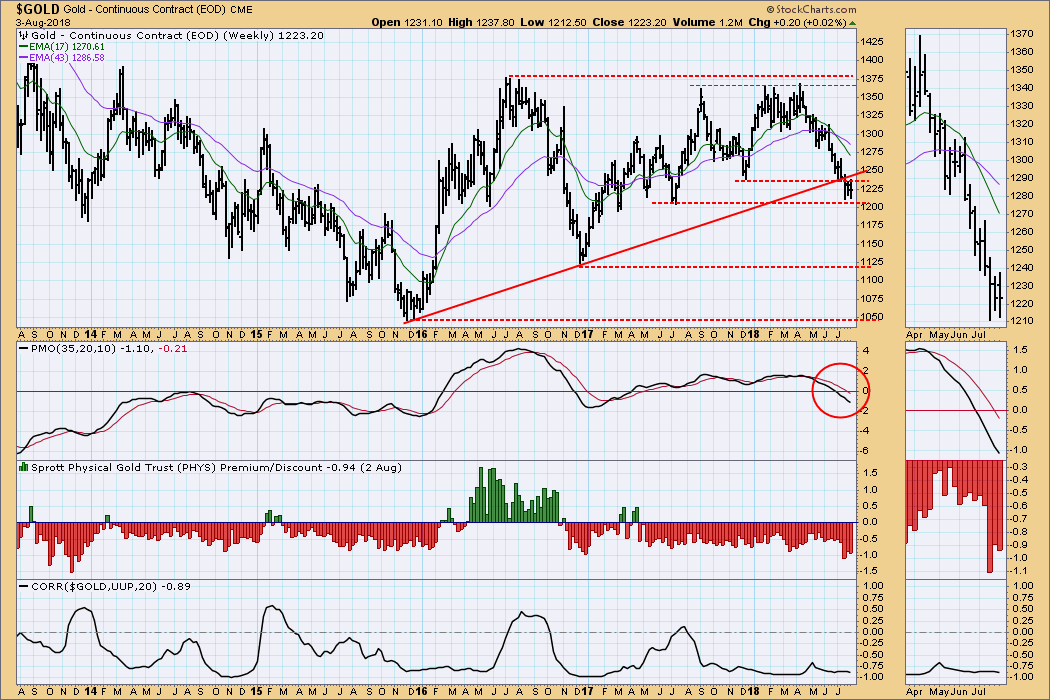
CRUDE OIL (USO)
IT Trend Model: BUY as of 6/26/2018
LT Trend Model: BUY as of 11/2/2017
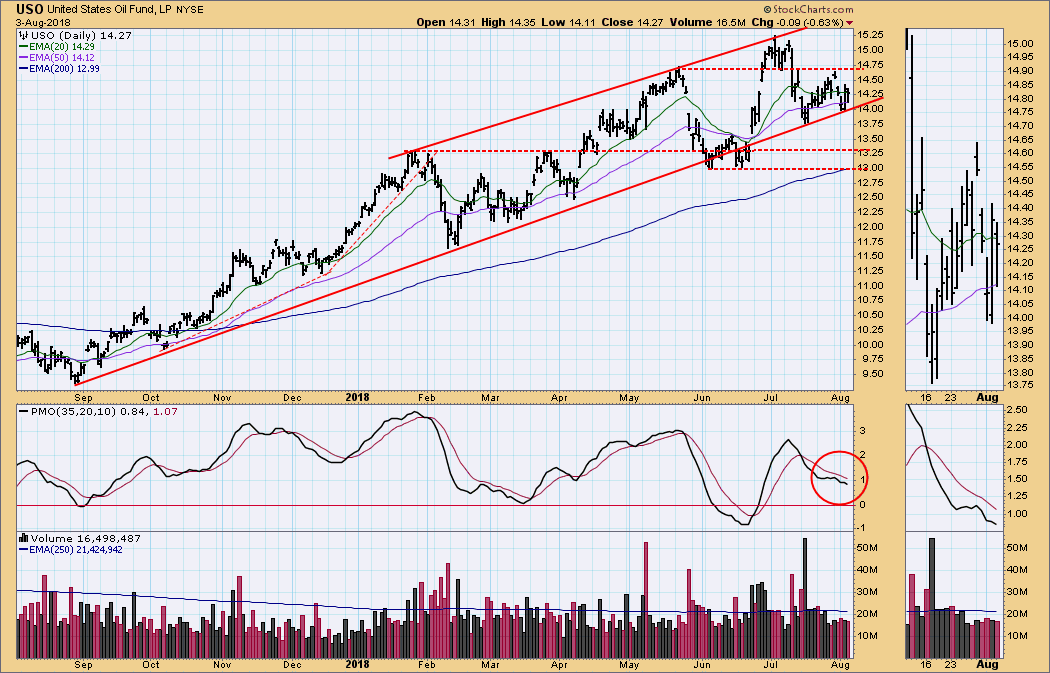
USO Daily Chart: The rising trend line has provided support twice in the last two weeks, but the falling daily PMO implies that the support is likely to fail.
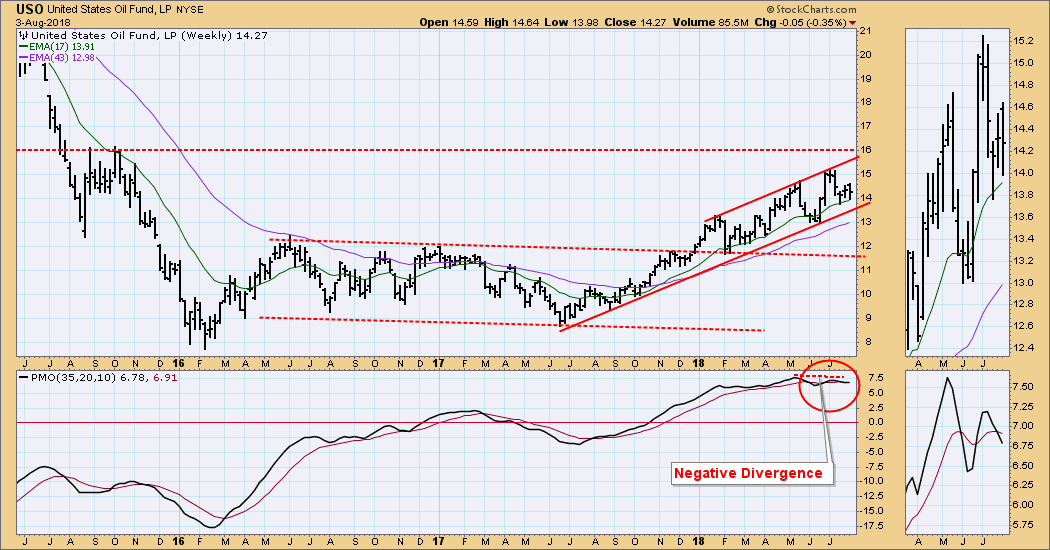
USO Weekly Chart: Price remains within the rising trend channel, but the weekly PMO negative divergence favors a continued pullback.
BONDS (TLT)
IT Trend Model: SELL as of 8/2/2018
LT Trend Model: SELL as of 8/1/2018
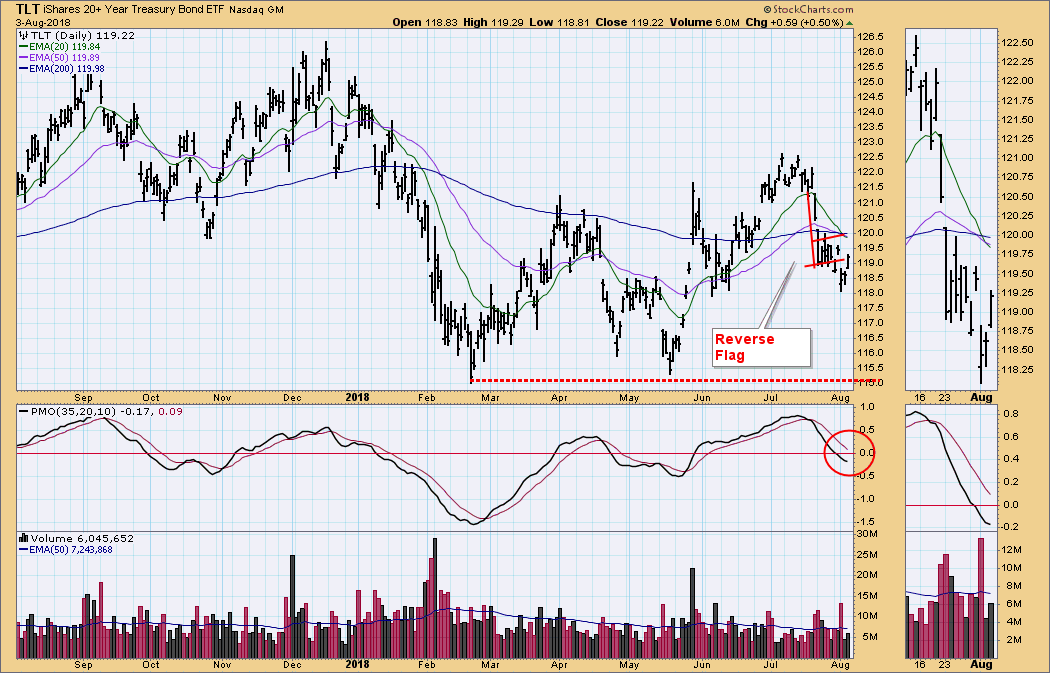
TLT Daily Chart: Last week we identified a bearish reverse flag formation, and this week price broke down from it. Also, new IT and LT Trend Model SELL signals were generated. By Friday price had reversed upward, indicating that the expected minimum downside target would not be approached. If TLT continues to rally, Trend Model signals could change again very quickly.
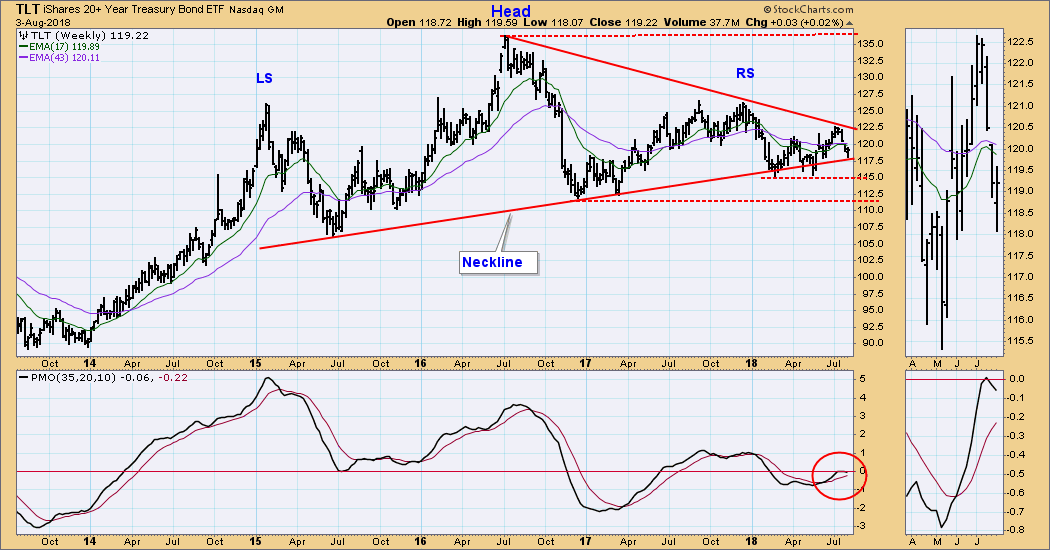
TLT Weekly Chart: The weekly PMO topped last week and continues to fall. This favors a downside resolution of the head and shoulders pattern.
**Don't miss any of the DecisionPoint commentaries! Go to the "Notify Me" box toward the end of this blog page to be notified as soon as they are published.**
Technical Analysis is a windsock, not a crystal ball.
Happy Charting!
- Carl
NOTE: The signal status reported herein is based upon mechanical trading model signals, specifically, the DecisionPoint Trend Model. They define the implied bias of the price index based upon moving average relationships, but they do not necessarily call for a specific action. They are information flags that should prompt chart review. Further, they do not call for continuous buying or selling during the life of the signal. For example, a BUY signal will probably (but not necessarily) return the best results if action is taken soon after the signal is generated. Additional opportunities for buying may be found as price zigzags higher, but the trader must look for optimum entry points. Conversely, exit points to preserve gains (or minimize losses) may be evident before the model mechanically closes the signal.
Helpful DecisionPoint Links:
DecisionPoint Shared ChartList and DecisionPoint Chart Gallery
Price Momentum Oscillator (PMO)
Swenlin Trading Oscillators (STO-B and STO-V)

