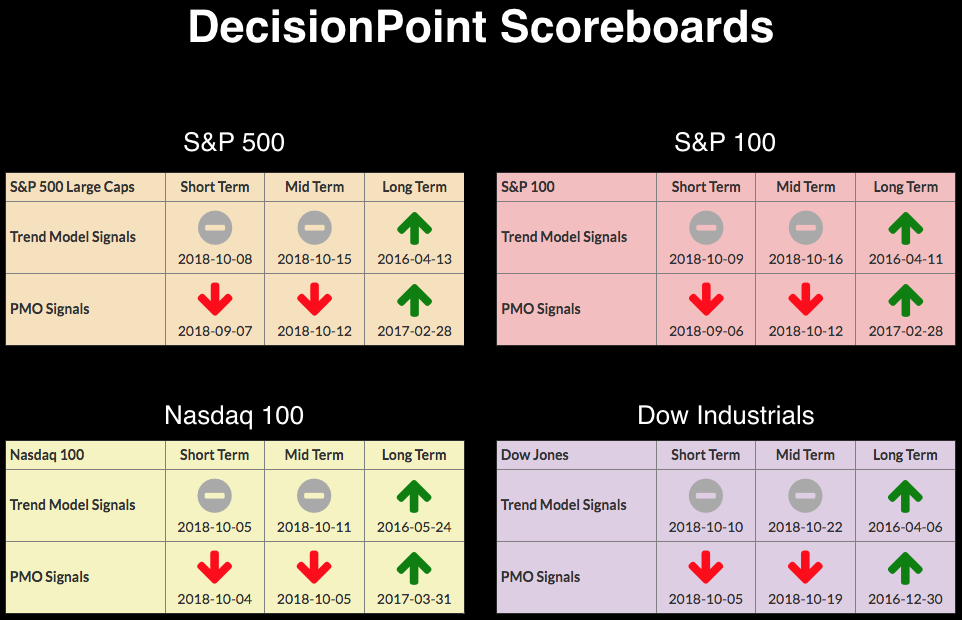
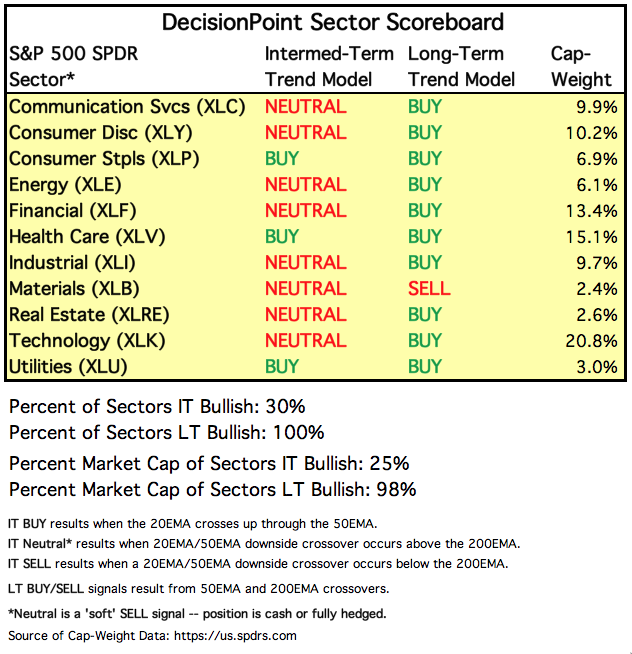
 Today's sell-offs (over 3% on the SPX , almost 4.5% on the Nasdaq and 3.79% drop on the Russell 2000) were deep and painful, but you don't need me to tell you that. I would like to be the bearer of good news, but I can't find much out there. The DP Scoreboards display the weakness in the short and intermediate terms. The Sector Scoreboard, underneath the large index Scoreboards, shows that defensive sectors are the only ones with IT Buy signals.
The DecisionPoint Alert presents an mid-week assessment of the trend and condition of the stock market (S&P 500), the U.S. Dollar, Gold, Crude Oil, and Bonds.
SECTORS
Each S&P 500 Index component stock is assigned to one, and only one, of 11 major sectors. This is a snapshot of the Intermediate-Term and Long-Term Trend Model signal status for those sectors.
STOCKS
IT Trend Model: Neutral as of 10/15/2018
LT Trend Model: BUY as of 4/1/2016
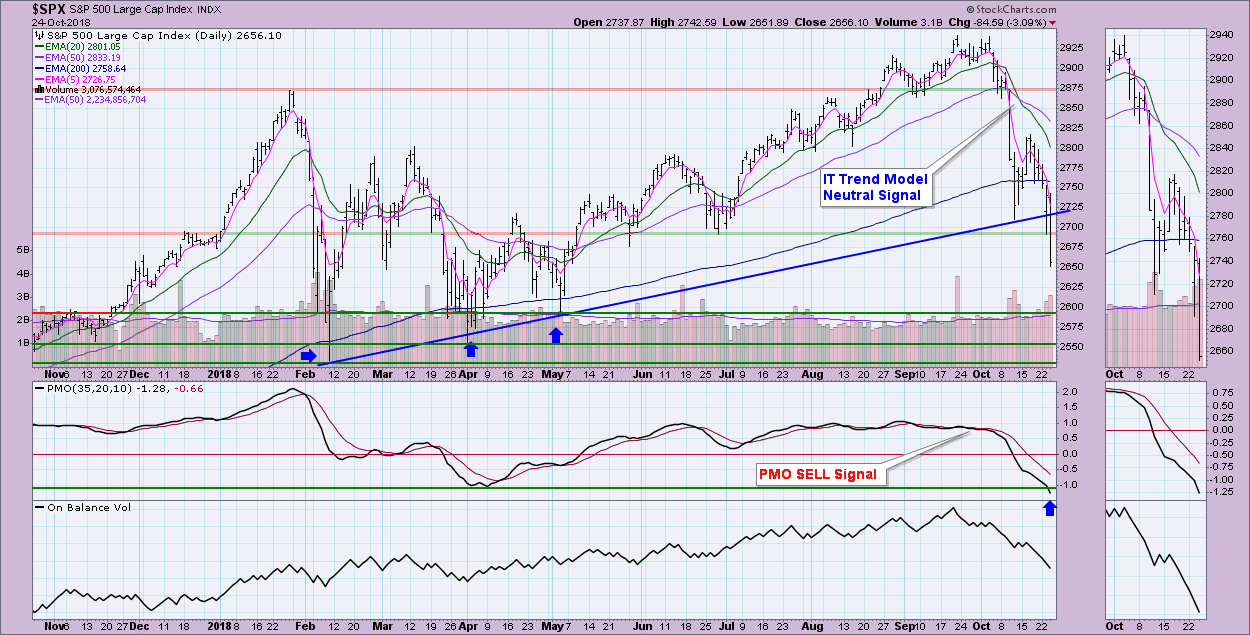
SPY Daily Chart: Yesterday saw the break in the rising trend, but it managed to close comfortably above it. Today trading occurred mostly below the rising trend and even below the June low. The PMO has now reached levels we haven't seen in over a year; and while that may look oversold, typically the SPX's PMO travels in a range of +2 to -2. With a reading of -1.28, we know that it isn't that oversold. Look at the OBV. Note the huge decline since the all-time high. The correction in February didn't see that kind of distribution by a mile. Unfortunately, that kind of weakness suggests further decline. I've marked a few different levels where we could see a reversal.
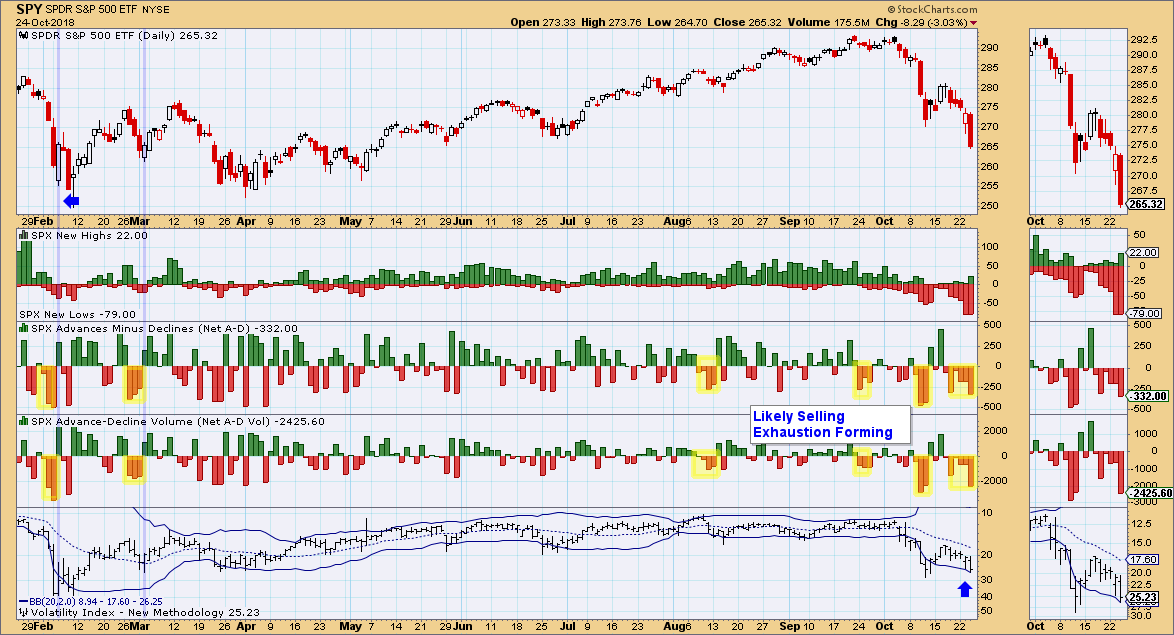
Climactic Market Indicators: With the high breadth readings, a selling exhaustion is ripening. We've seen more negative readings previously. If we see the VIX close below its Bollinger Band in the coming days, I'd look for a very short-lived bounce like we saw after the last exhaustion readings.
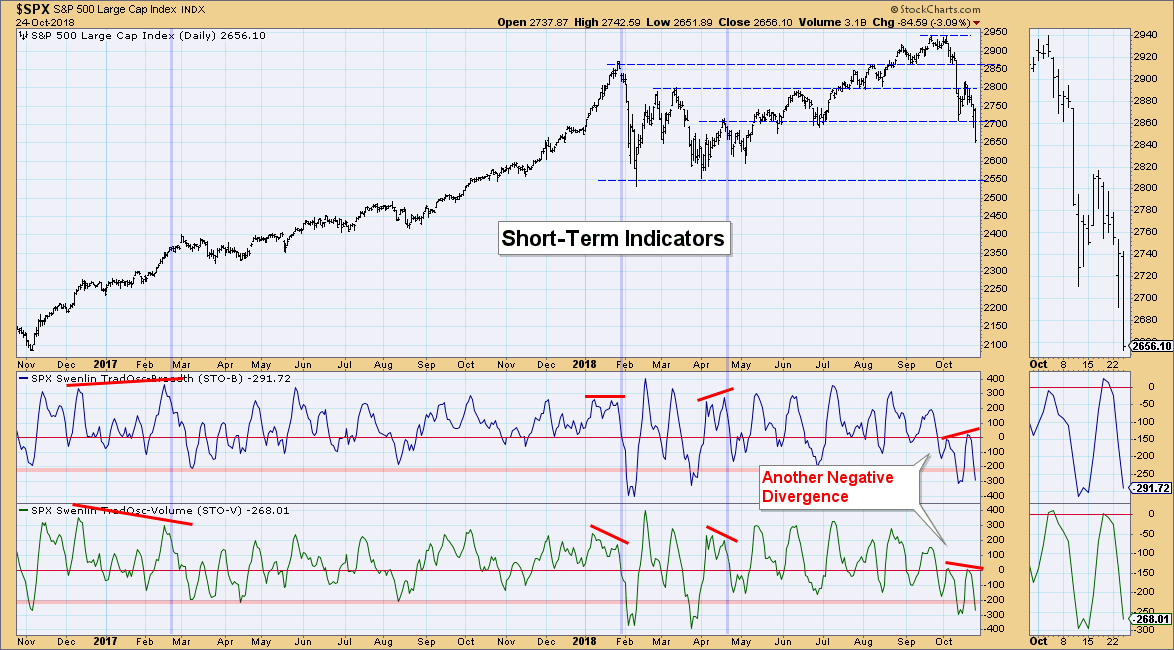
Short-Term Market Indicators: We only got one day to spot the negative divergence on the STO tops and unfortunately I didn't spot it until today. Normally I would look at the oversold readings on this chart and look for a higher prices, but we saw readings well-below today's after the last correction. That tells me we are vulnerable for more downside in the short-term.
Intermediate-Term Market Indicators: These indicators are very oversold, but not at extremes. They are also accelerating lower.
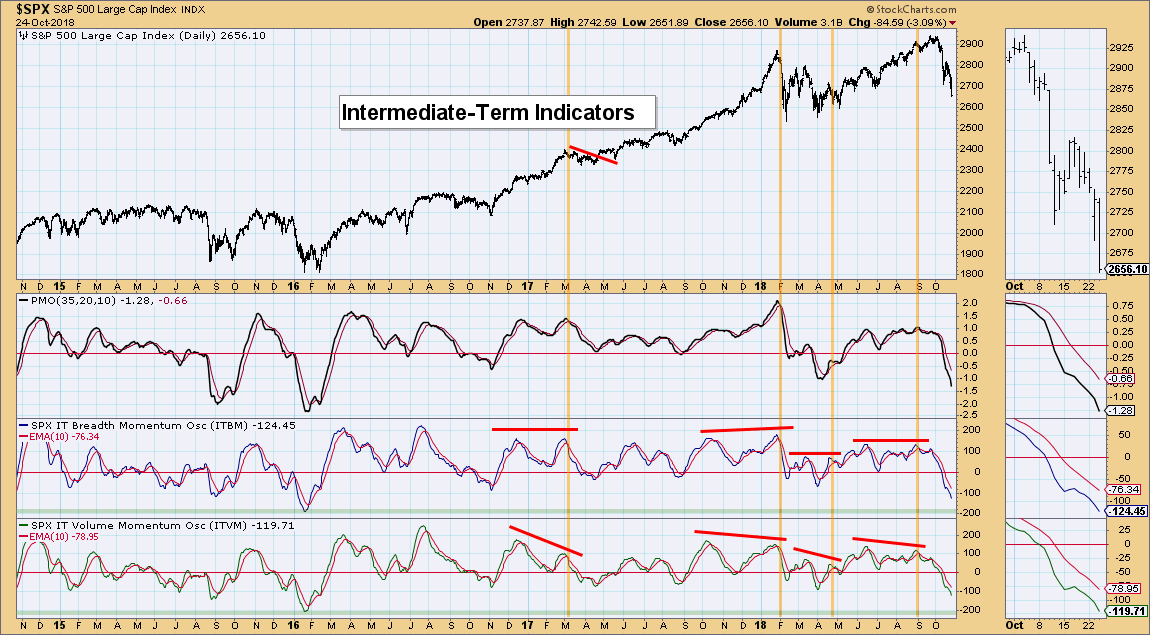
Conclusion: Normally I would be excited to see so many oversold indicators, but looking at the last correction in Jan/Feb, I note that they reached lower levels with the exception of the intermediate-term indicators. They have reached past the last correction's readings, but not past 2016 extremes. They can accommodate more downside.
DOLLAR (UUP)
IT Trend Model: BUY as of 4/24/2018
LT Trend Model: BUY as of 5/25/2018
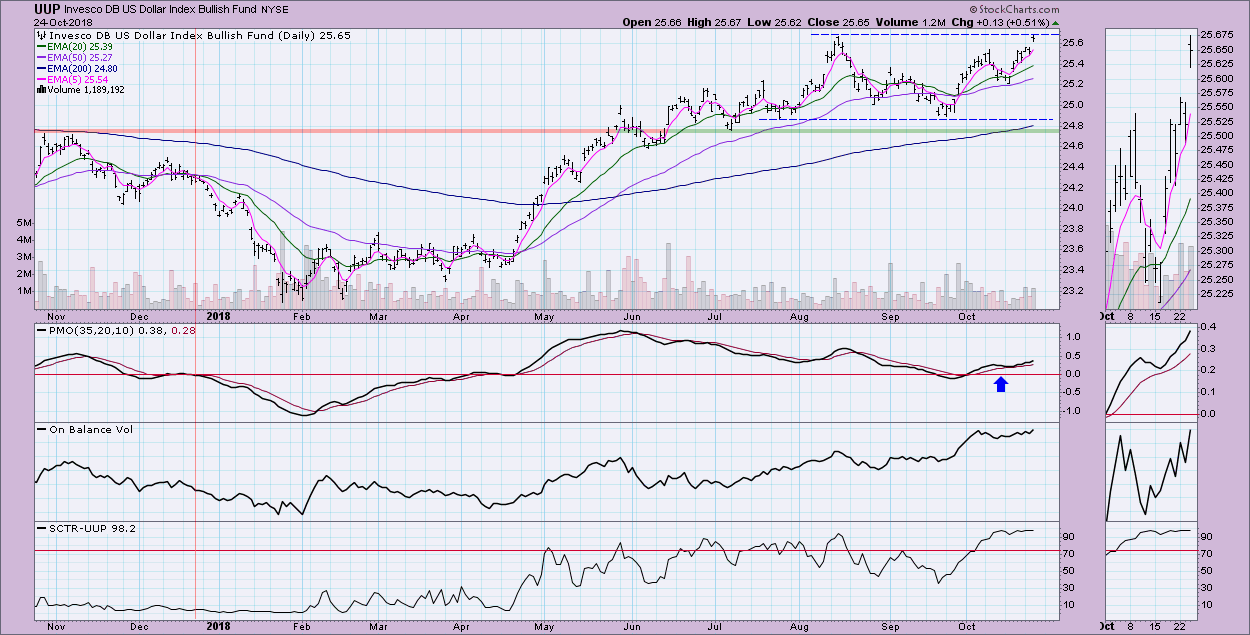
UUP Daily Chart: The Dollar tested overhead resistance today and wasn't able to push past. UUP is poised for that breakout. The PMO looks healthy and isn't overbought and the OBV is traveling higher, confirming the rally. I remain bullish on the Dollar.
GOLD
IT Trend Model: BUY as of 10/19/2018
LT Trend Model: SELL as of 6/22/2018
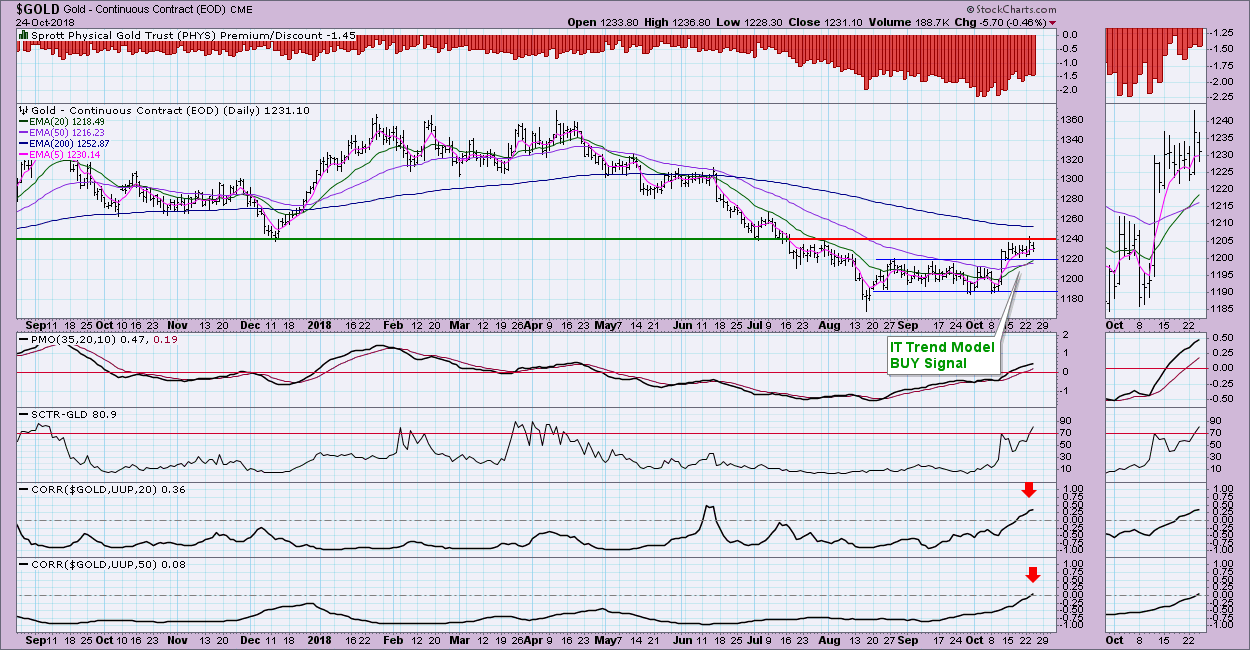
GOLD Daily Chart: I'm also bullish on Gold. For those familiar with the strong reverse correlation with the Dollar may question how I can be bullish on both UUP and Gold. Look at the current correlation readings. In the short term, Gold is positively correlated with the Dollar. In the longer term, there is no correlation. The SCTR and PMO are rising nicely. I'm looking for price to break above 1240. Also in Gold's favor is an uncertain and volatile market. Gold is generally considered a safe-haven against volatile markets.
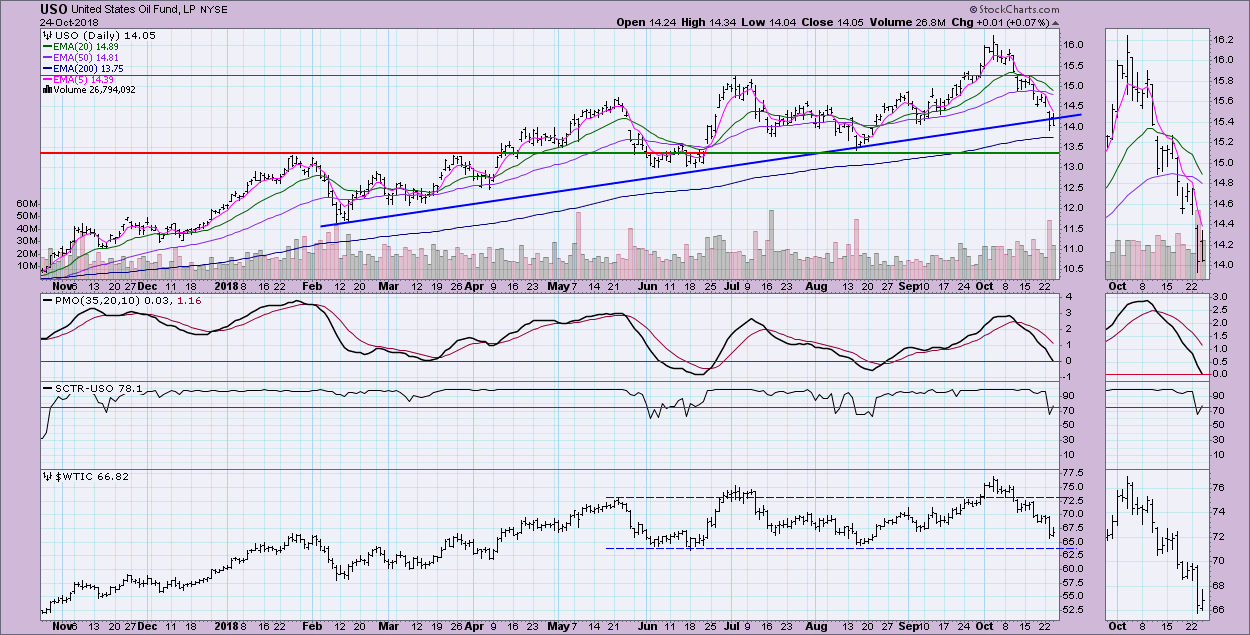
CRUDE OIL (USO)
IT Trend Model: BUY as of 8/24/2018
LT Trend Model: BUY as of 11/2/2017
USO Daily Chart: Weakness continues on Oil. The PMO has nearly reached negative territory and is accelerating lower. I don't think USO is done declining given the second close beneath the rising bottoms trendline. I'm looking for USO to move to $13.25.
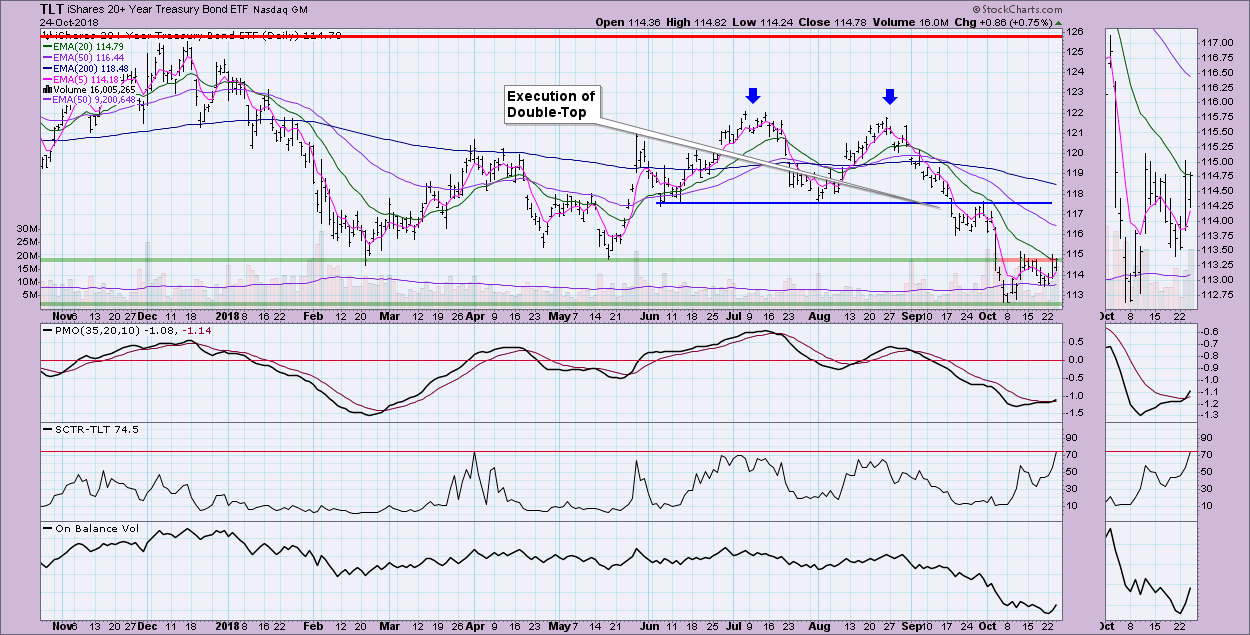
BONDS (TLT)
IT Trend Model: Neutral as of 9/13/2018
LT Trend Model: SELL as of 9/18/2018
TLT Daily Chart: TLT logged a new PMO buy signal as it tests overhead resistance. If it's going to rally, this is the set-up. Look for a pop and close above resistance and the 20-EMA. If TLT can't muster that on a new PMO BUY signal, I'll be looking for a test of this month's low.
Technical Analysis is a windsock, not a crystal ball.
Happy Charting!
- Erin
**Don't miss any of the DecisionPoint commentaries! Go to the "Notify Me" box toward the end of this blog page to be notified as soon as they are published.**
NOTE: The signal status reported herein is based upon mechanical trading model signals, specifically, the DecisionPoint Trend Model. They define the implied bias of the price index based upon moving average relationships, but they do not necessarily call for a specific action. They are information flags that should prompt chart review. Further, they do not call for continuous buying or selling during the life of the signal. For example, a BUY signal will probably (but not necessarily) return the best results if action is taken soon after the signal is generated. Additional opportunities for buying may be found as price zigzags higher, but the trader must look for optimum entry points. Conversely, exit points to preserve gains (or minimize losses) may be evident before the model mechanically closes the signal.
Helpful DecisionPoint Links:
DecisionPoint Shared ChartList and DecisionPoint Chart Gallery
Price Momentum Oscillator (PMO)
Swenlin Trading Oscillators (STO-B and STO-V)


