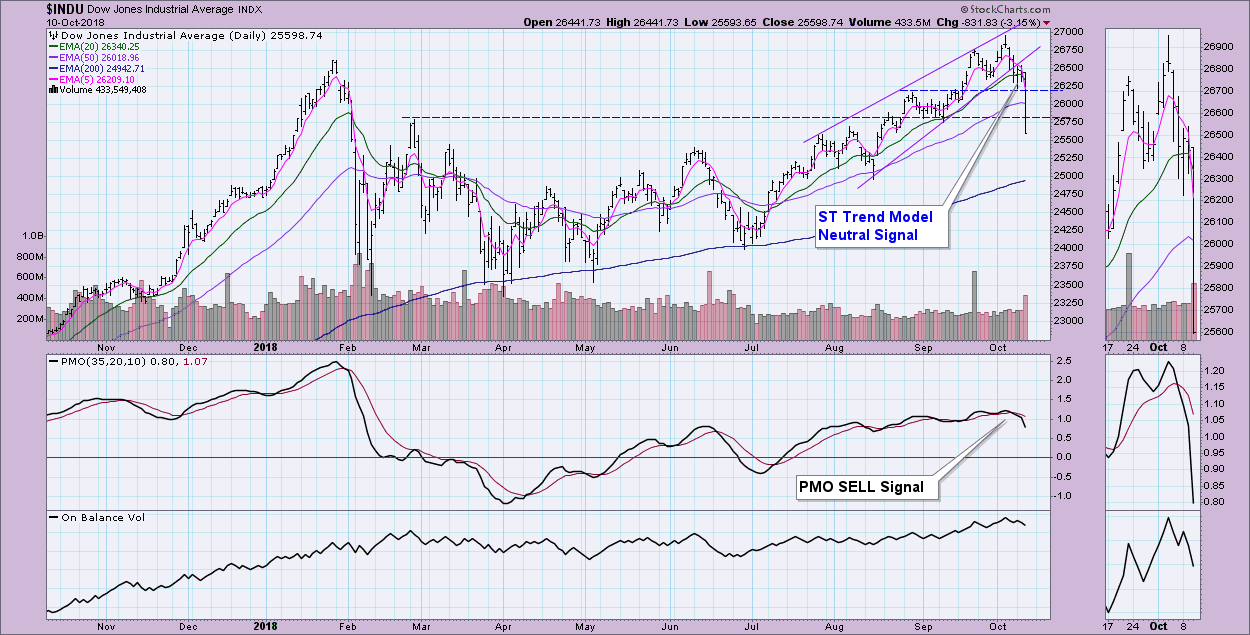
 We had another change to the DecisionPoint Scoreboards today. The Short-Term Trend Model initiated a Neutral signal on the Dow (chart is below Scoreboards) when the 5-EMA crossed below the 20-EMA while above the 50-EMA. Weakness and fear abound, but there could be some relief on the way given the very climactic breadth readings I'm seeing today in combination with the $VIX.
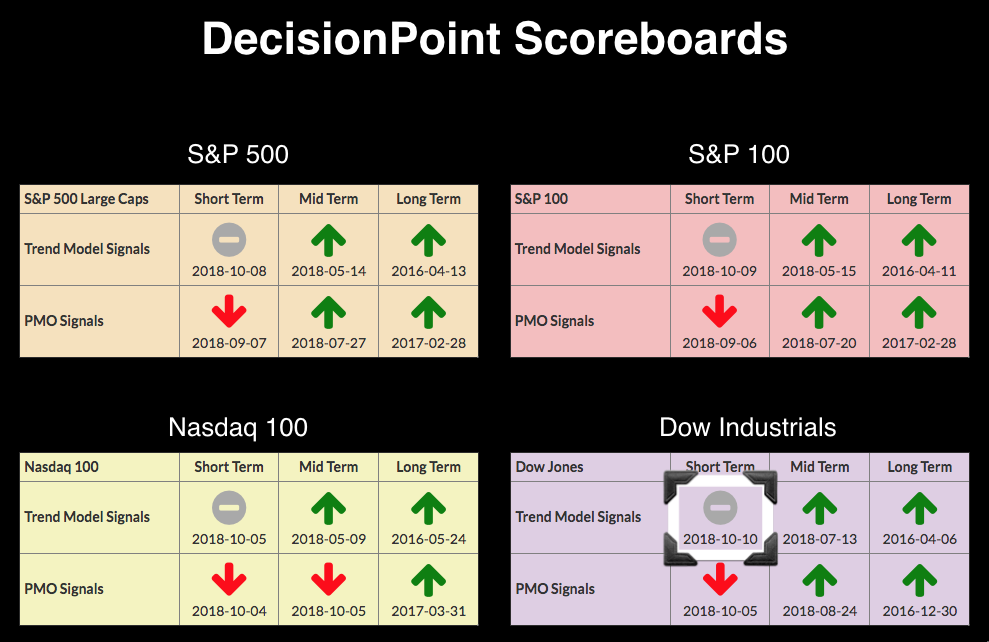
The DecisionPoint Alert presents an mid-week assessment of the trend and condition of the stock market (S&P 500), the U.S. Dollar, Gold, Crude Oil, and Bonds.
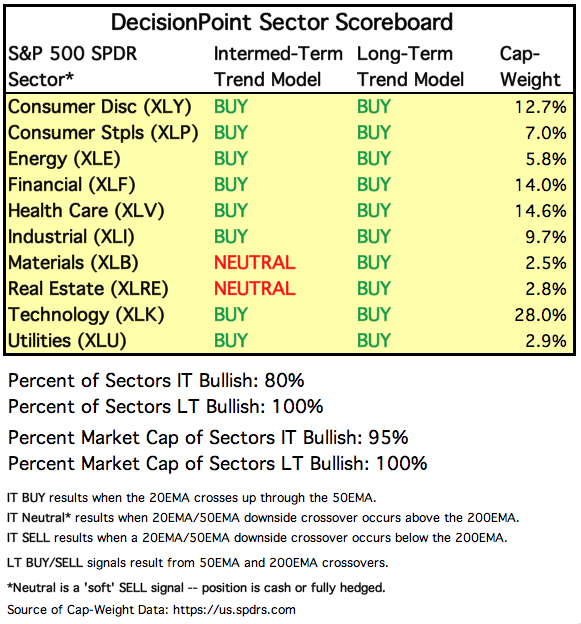
SECTORS
Each S&P 500 Index component stock is assigned to one, and only one, of 10 major sectors. This is a snapshot of the Intermediate-Term and Long-Term Trend Model signal status for those sectors.
STOCKS
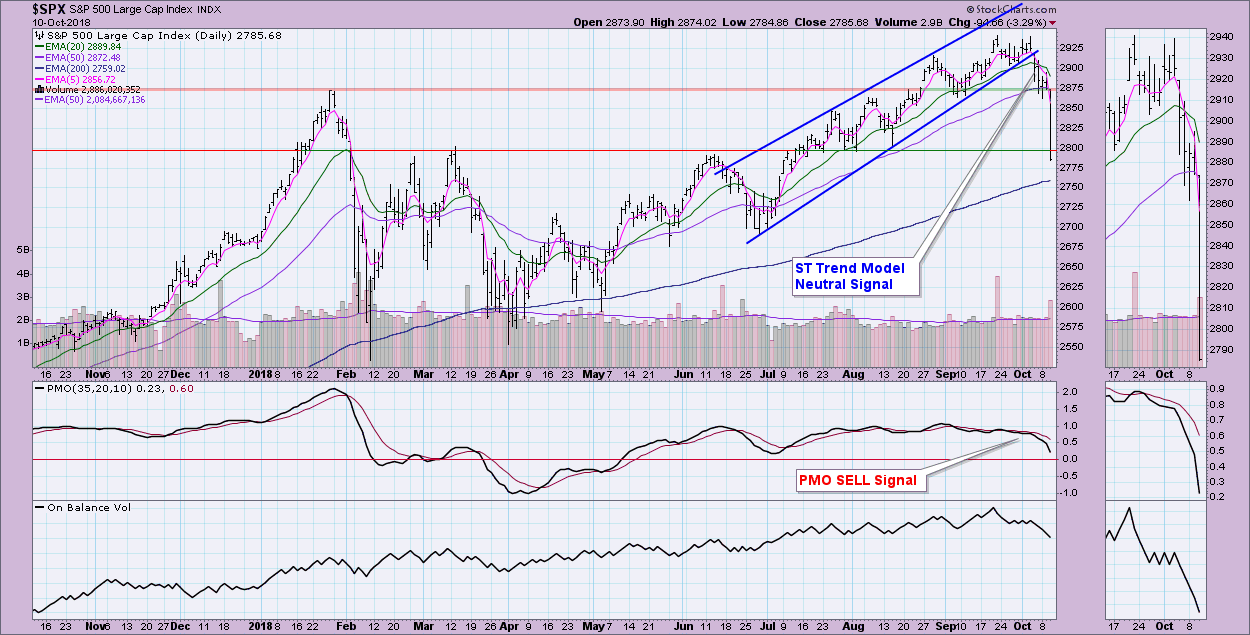
IT Trend Model: BUY as of 5/11/2018
LT Trend Model: BUY as of 4/1/2016
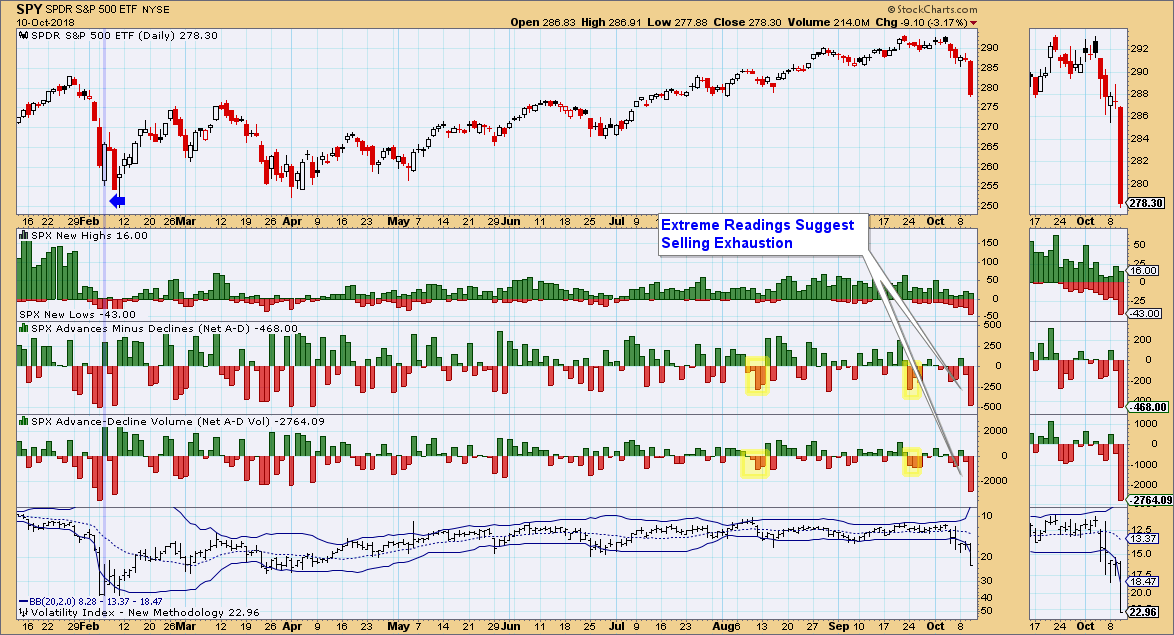
SPX Daily Chart: Today's correction was quick and painful. There are certainly some serious concerns when you look at the Dow chart above as well as the SPX chart below. Today's very long bar and close below significant support along the Feb/Mar tops as well as the June high and bottoms in July. I had hoped to see the close above that support line. The next area of serious support is the 200-EMA. The PMO is still in positive territory but stretching to reach past the zero line. Unfortunately with the PMO having 'room to fall', there could be more downside to endure. Frankly I don't see a bear market in the wings, but a decline like this does make one consider the possibility.
Climactic Market Indicators: This is the chart of the day! Click and share! Look at the extremes that the Advances-Declines logged today. The VIX also logged an extreme reading, well outside the Bollinger Band. Seeing these in concert, I have to read this as a selling exhaustion. Back in February after the hard and heavy decline, we saw similar readings. We certainly could see more panic tomorrow, but the VIX has spent far more time below the Bollinger Band than is typical. I'll go out on a limb and suggest that we will see a rally before the end of the week.
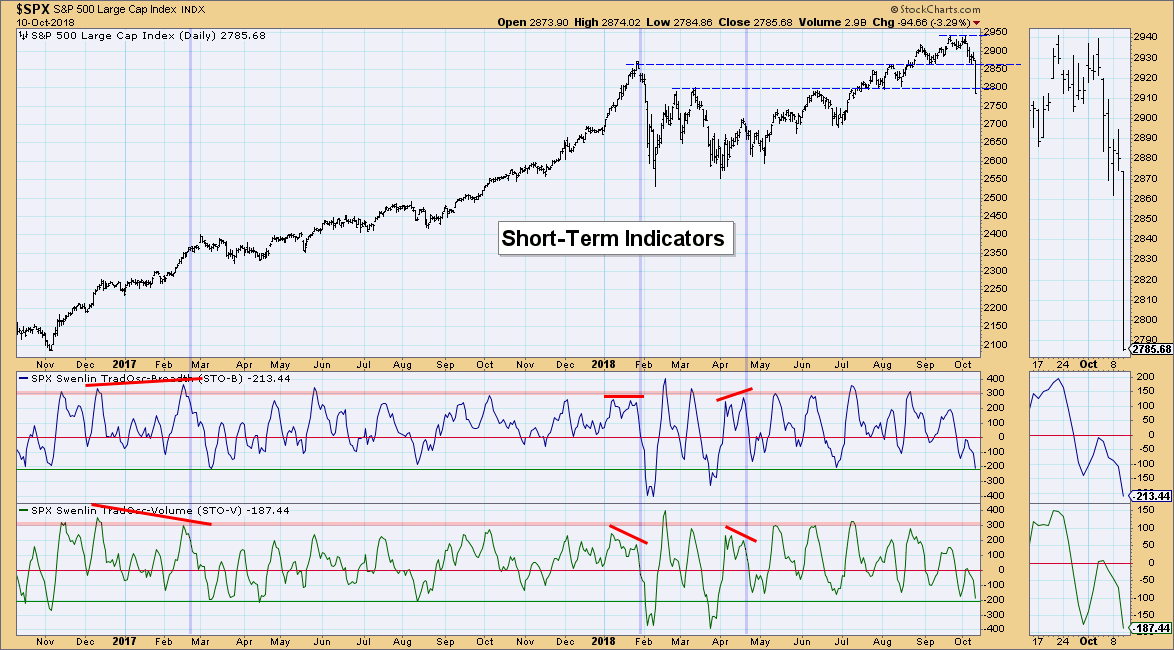
Short-Term Market Indicators: These indicators have reached oversold territory. It's time for them to turn back around. We did see more extreme readings back after the corrective moves at the beginning of the year, but I'd be looking for a turn back up soon. Now, oscillators must oscillate, so they could turn back up without a big rally, but typically a rally follows oversold readings like this. We just need a bottom.
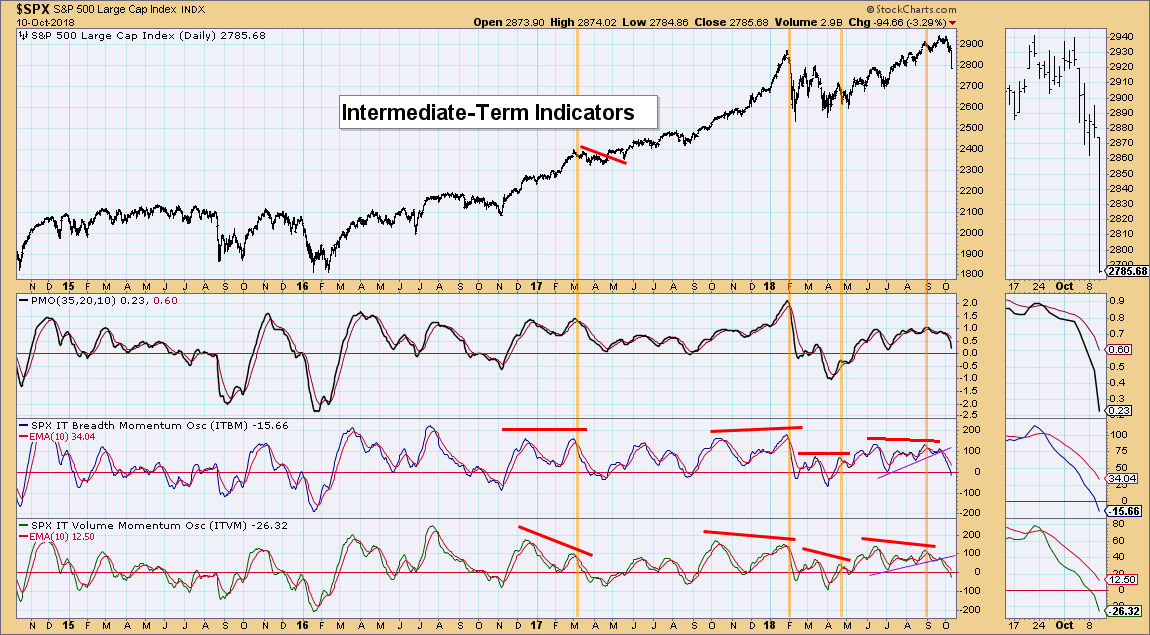
Intermediate-Term Market Indicators: These indicators have reached near-term oversold territory, but clearly they have spent time below the zero line. My real concern is that we will see these indicators continue lower toward the bottom of their typical range that can reach down to -200. Notice where they turned around earlier this year after that correction. It didn't have to travel all the way down to -200.
Conclusion: I'm not a "perma-bull". There are concerning characteristics on the short- and intermediate-term indicator charts, but we've seen the market bounce when these indicators are reading at these current oversold lows. At least in the very short term, we can look for a relief rally based on the $VIX and breadth numbers.
DOLLAR (UUP)
IT Trend Model: BUY as of 4/24/2018
LT Trend Model: BUY as of 5/25/2018
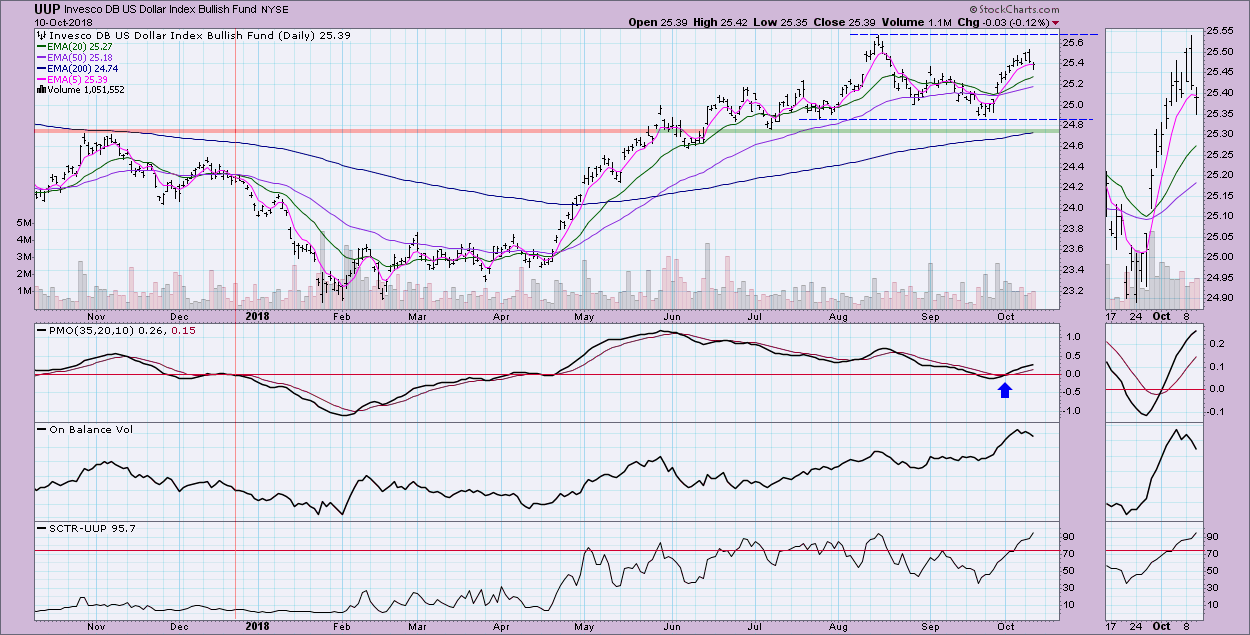
UUP Daily Chart: The Dollar is slowly turning over, but the PMO is still rising nicely and is not overbought. I'm bullish the Dollar, but it does need a pause. As long as it stays above the 20-EMA, I'll be looking for a bounce back to test resistance at the August top.
GOLD
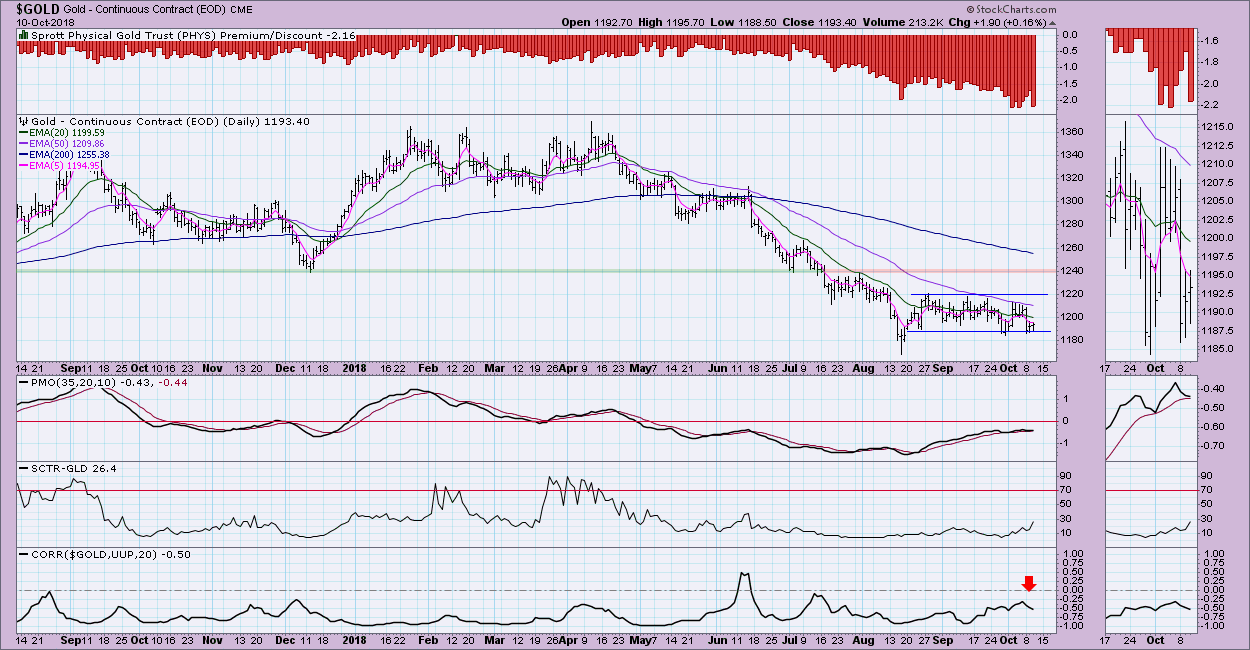
IT Trend Model: Neutral as of 5/2/2018
LT Trend Model: SELL as of 6/22/2018
GOLD Daily Chart: Gold is not performing the way it should given the indicators. The best news is that it has at least remained in a safe trading channel and it is at the bottom again. The PMO could be ready for that SELL signal, but my sense is that it'll whipsaw back up. Volatile equity markets generally mean Gold increases its attractiveness. In the short term, Gold has decoupled from the Dollar so a rising Dollar might not depress Gold prices. Sentiment remains very bearish based on the discount levels. Sentiment being contrarian, I continue to expect a rally. At this point, I suspect there will be another test of overhead resistance at the top of the channel. If price breaks down, that'll trigger the PMO SELL signal and the apple cart will be turned over. I remain bullish until I see the breakdown. I could deal with a PMO SELL signal, but not if price is falling below 1180.
CRUDE OIL (USO)
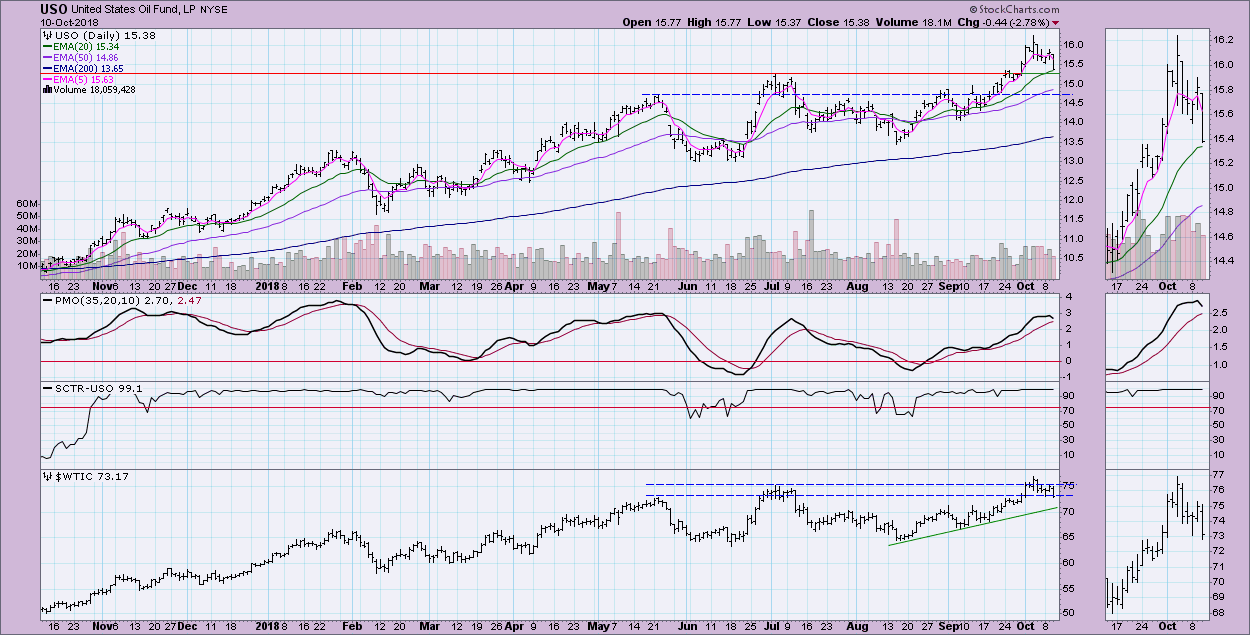
IT Trend Model: BUY as of 8/24/2018
LT Trend Model: BUY as of 11/2/2017
USO Daily Chart: The PMO is topping, but price has reached support. The SCTR remains positive. I'm looking for a bounce off support. This looks very much like a flag formation.
BONDS (TLT)
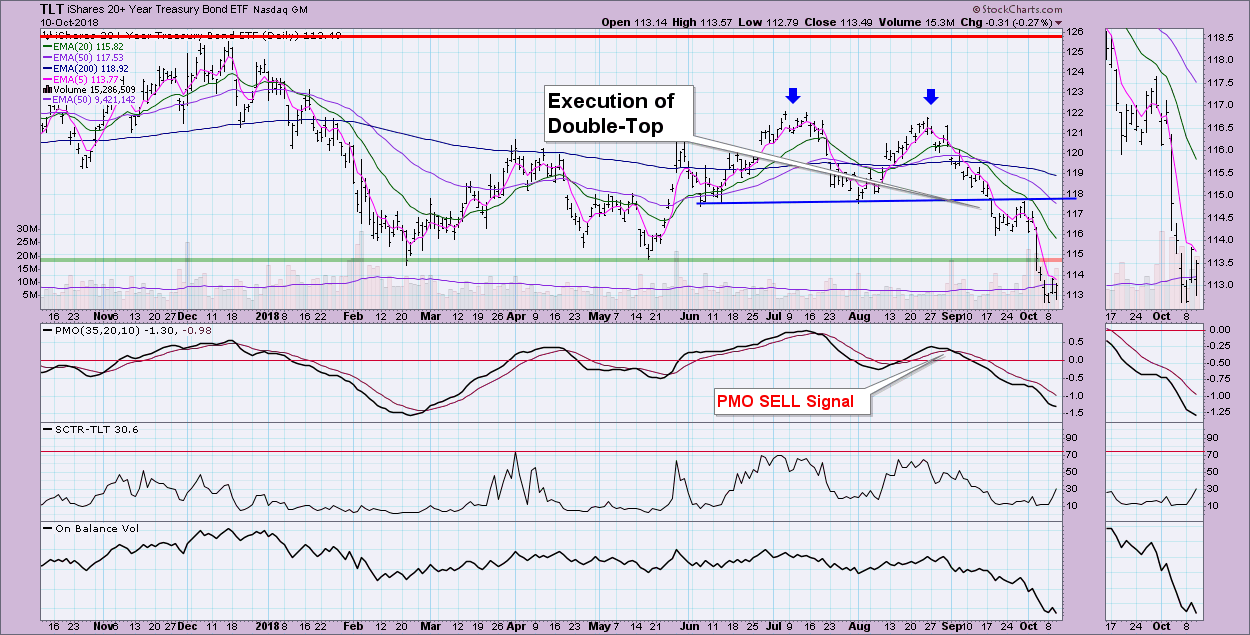
IT Trend Model: Neutral as of 9/13/2018
LT Trend Model: SELL as of 9/18/2018
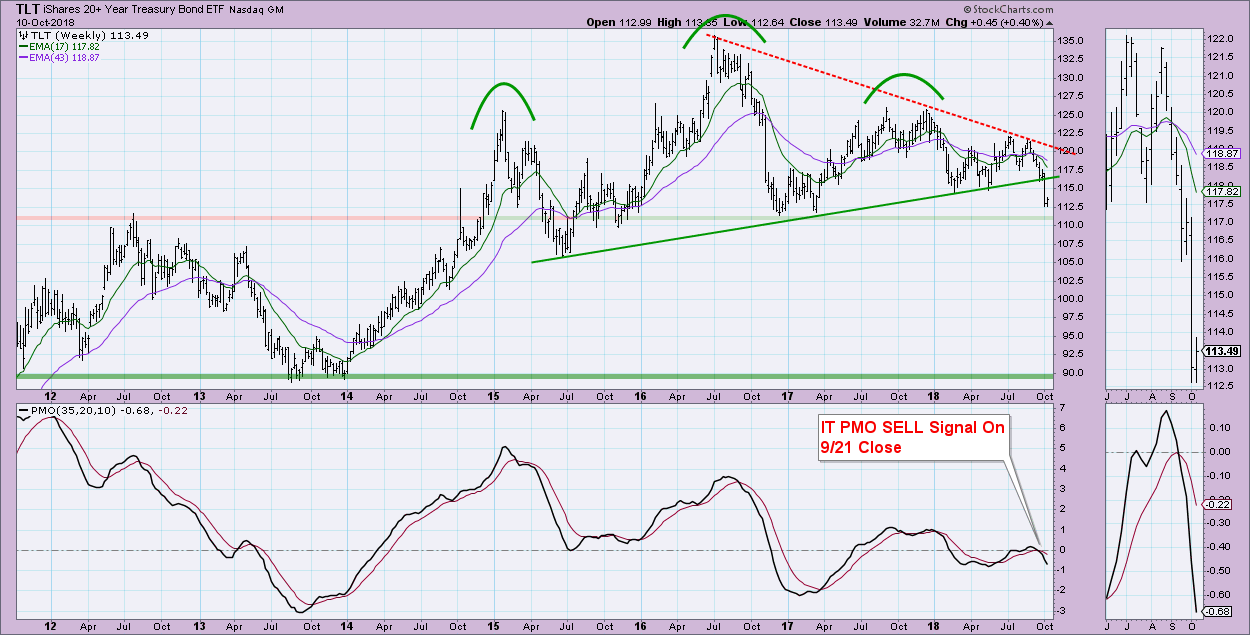
TLT Daily Chart: Bonds are catching their breath after a deep decline. I'm looking at this as a possible reverse flag in the making. The Double-Top minimum downside target has been reached, but based on the head and shoulders pattern on the weekly chart, I believe it is the "minimum" downside target. More decline is ahead.
Technical Analysis is a windsock, not a crystal ball.
Happy Charting!
- Erin
**Don't miss any of the DecisionPoint commentaries! Go to the "Notify Me" box toward the end of this blog page to be notified as soon as they are published.**
NOTE: The signal status reported herein is based upon mechanical trading model signals, specifically, the DecisionPoint Trend Model. They define the implied bias of the price index based upon moving average relationships, but they do not necessarily call for a specific action. They are information flags that should prompt chart review. Further, they do not call for continuous buying or selling during the life of the signal. For example, a BUY signal will probably (but not necessarily) return the best results if action is taken soon after the signal is generated. Additional opportunities for buying may be found as price zigzags higher, but the trader must look for optimum entry points. Conversely, exit points to preserve gains (or minimize losses) may be evident before the model mechanically closes the signal.
Helpful DecisionPoint Links:
DecisionPoint Shared ChartList and DecisionPoint Chart Gallery
Price Momentum Oscillator (PMO)
Swenlin Trading Oscillators (STO-B and STO-V)


