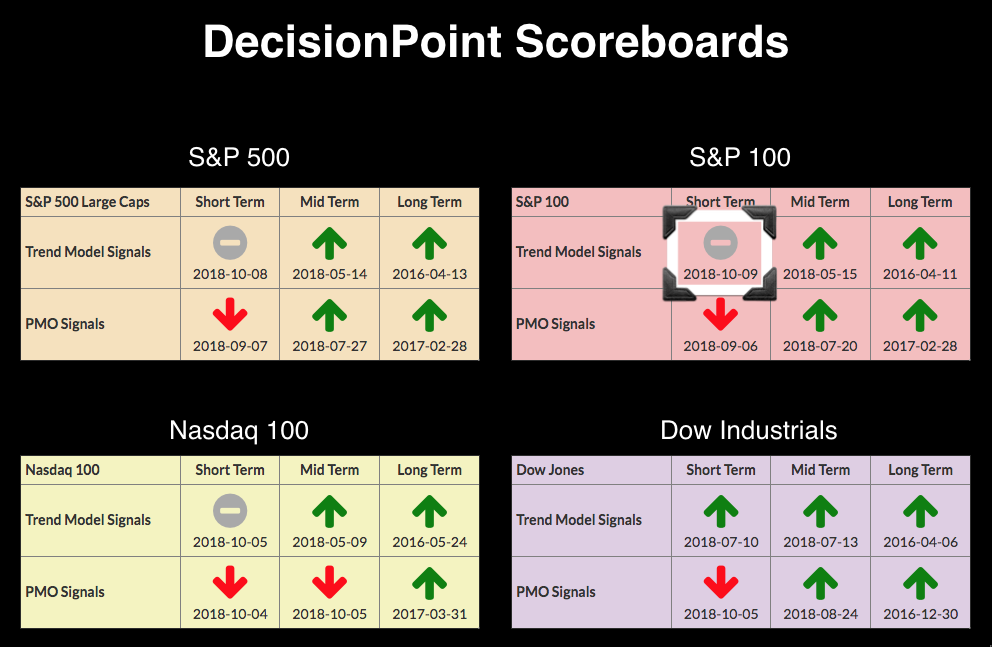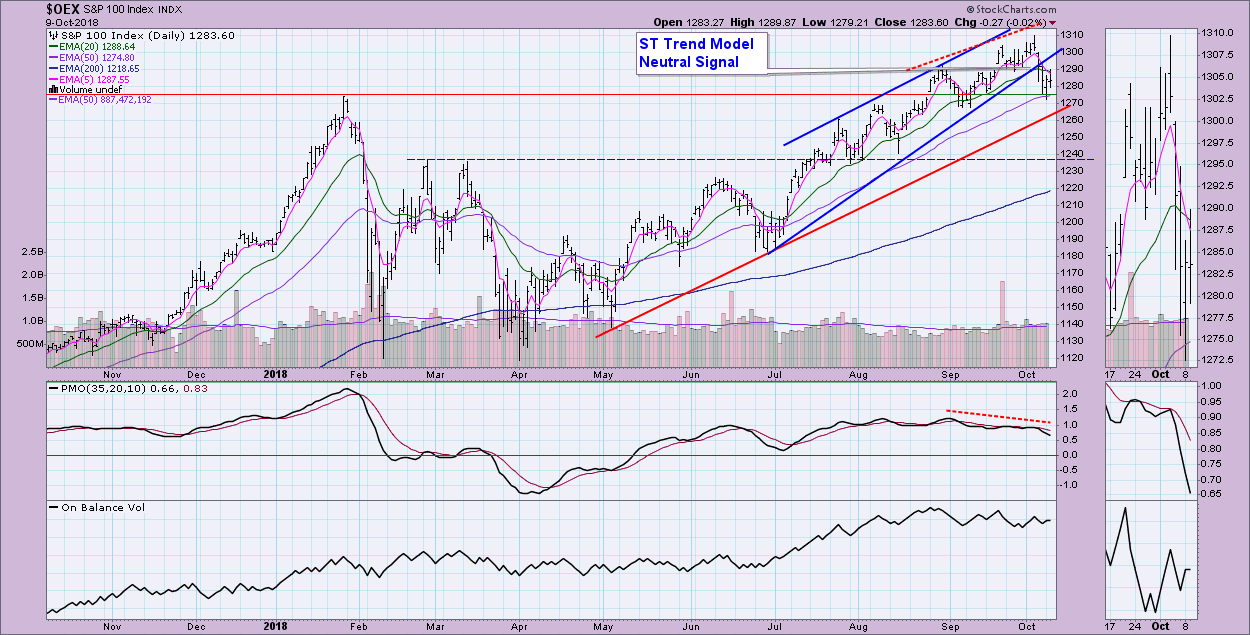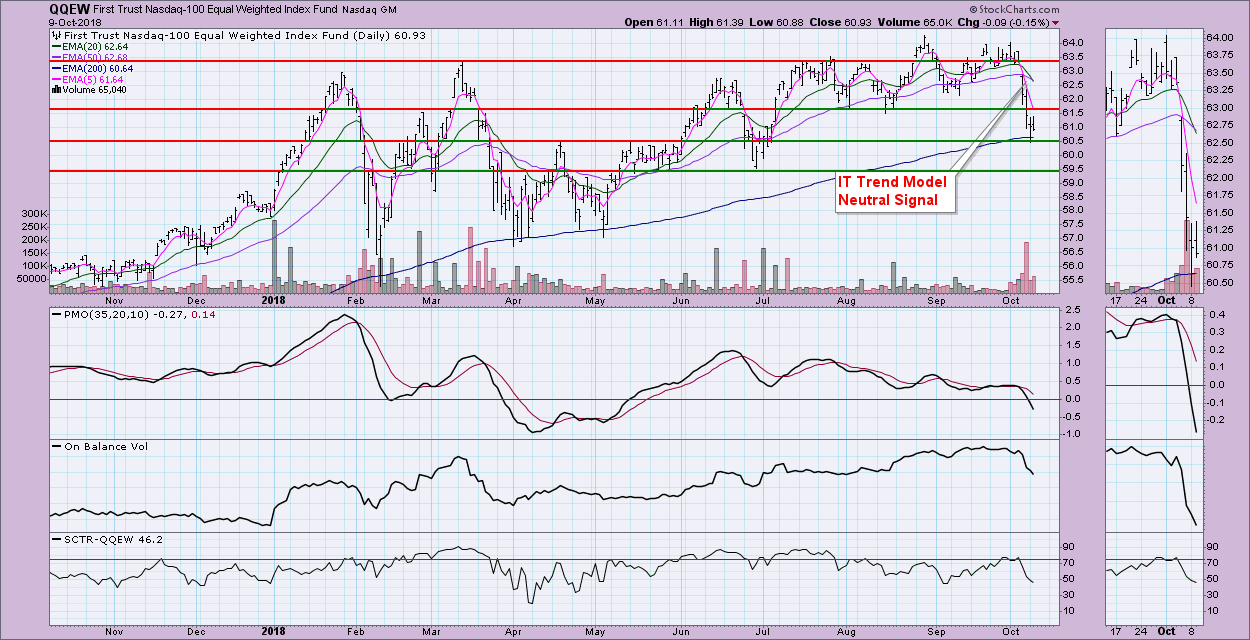
Another BUY signal is lost on the DP Scoreboard Summary. The OEX joins the SPX and NDX with a new ST Trend Model Neutral Signal. Interestingly, today the equal-weight Nasdaq 100 ETF (QQEW) logged a new IT Trend Model Neutral signal. Does this portend the same for the NDX?

The STTM Neutral signal was generated when the 5-EMA crossed below the 20-EMA while both were above the 50-EMA. Had the crossover occurred below the 50-EMA it would've been a SELL signal. Neutral is the same as being fully hedged or in cash rather than a short position which is implied by a SELL signal. The rising wedge executed on the OEX. Good news is that it is holding support at the January top as well as the 50-EMA. The negative divergence on the PMO may've already played out with this week's decline, but I wouldn't be so sure. If price begin to dip below the red rising bottoms trendline, this could get messy.
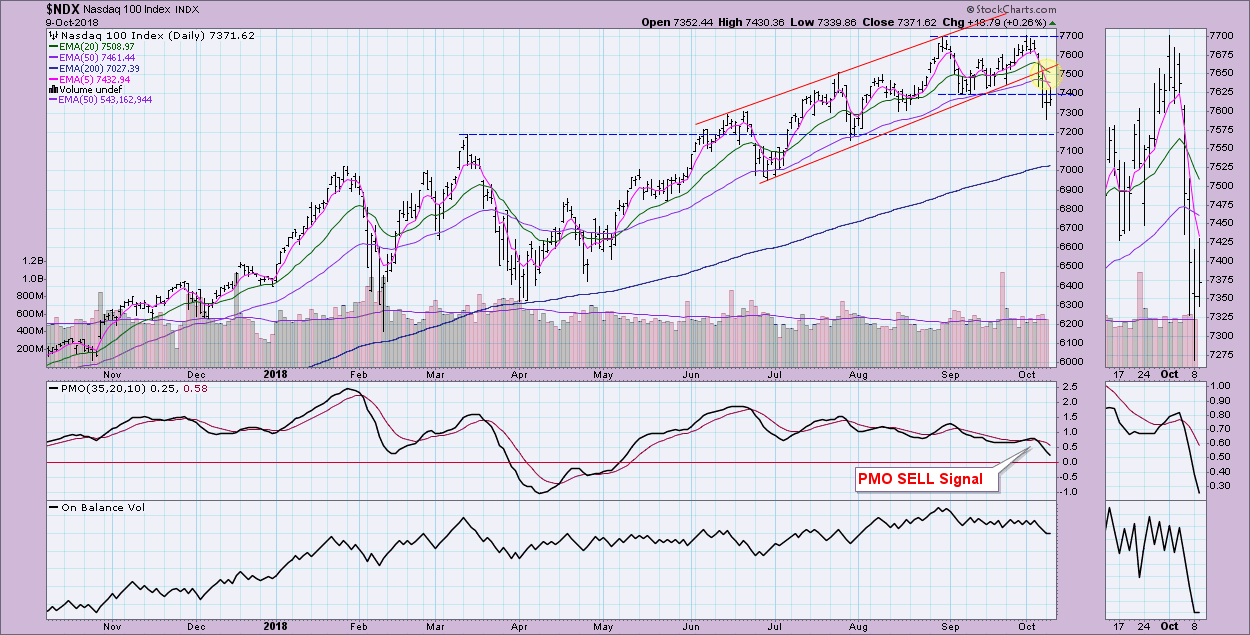
The equal-weight version of the NDX, QQEW, logged a new IT Trend Model Neutral signal. I've added both the QQEW and NDX charts below. Notice that QQEW has been consolidating sideways along the March top. The NDX was in a rising trend and outpaced its sister QQEW. Seeing the NDX perform so much better than the QQEW suggests that the big name, large-cap stocks were responsible for much of the rising trend. Price is testing the 200-EMA on QQEW while the NDX is still very comfortably above it. I believe the NDX is still vulnerable to a test of the March top as well as its 200-EMA given the negative configuration of the PMO and OBV. If price remains below the 50-EMA for much longer, the NDX could see that ITTM Neutral signal sooner rather than later.
Technical Analysis is a windsock, not a crystal ball.
Happy Charting!
- Erin
Helpful DecisionPoint Links:
DecisionPoint Shared ChartList and DecisionPoint Chart Gallery
Price Momentum Oscillator (PMO)
Swenlin Trading Oscillators (STO-B and STO-V)
**Don't miss DecisionPoint Commentary! Add your email below to be notified of new updates"**


