"The road to trading glory is littered with the bodies of those who tried to pick bottoms."
-- Carl Swenlin (once upon a bad day)
To use an expression made popular by the late Kennedy Gammage, bottom picking is for "swingin' riverboat gamblers." To be sure, it is a risky endeavor, but after Wednesday's bloodbath I suggested: For those who want to try to pick a bottom, the first short-term indication that a price bottom may be near will be when the daily PMO turns up. I wouldn't jump in until that happens. A daily PMO bottom is not a foolproof signal (see this for yourself by studying PMO bottoms on the charts), but it is at least one way to avoid pure guesswork, and waiting for it gives you an excuse to not act prematurely. Of course, tight stops and a commitment to execute them are part of the equation.
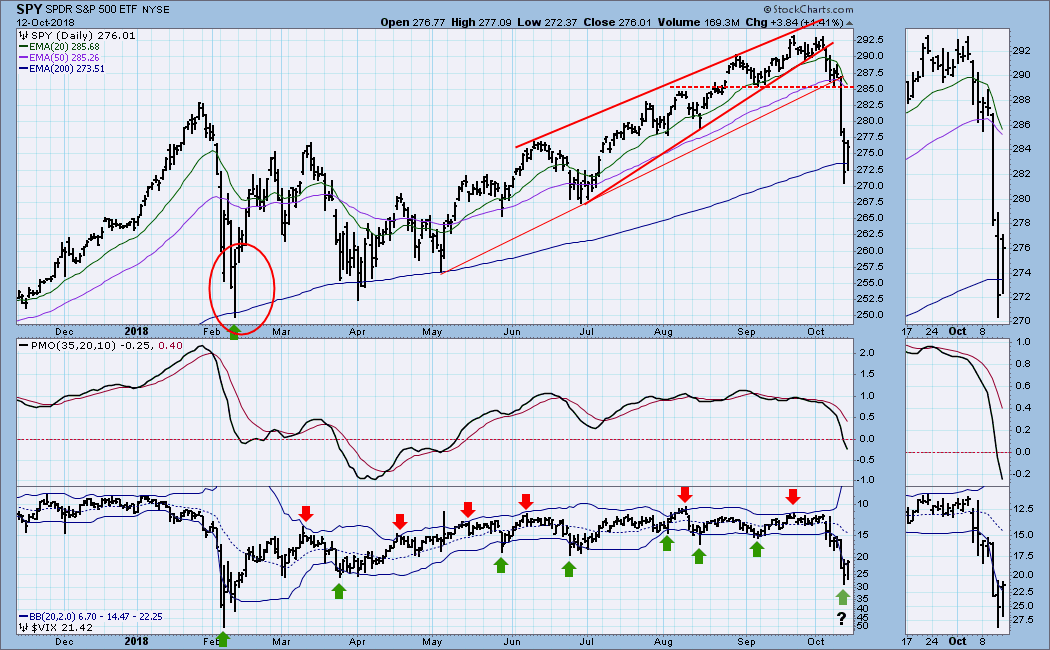
As you can see on the chart above, the daily PMO is not even hinting at a possible upturn. I think the price bottom in February is probably an example of what we might expect. It was a small but complex affair with the VIX climax occurring four days ahead of the price low.
The DecisionPoint Weekly Wrap presents an end-of-week assessment of the trend and condition of the stock market (S&P 500), the U.S. Dollar, Gold, Crude Oil, and Bonds.
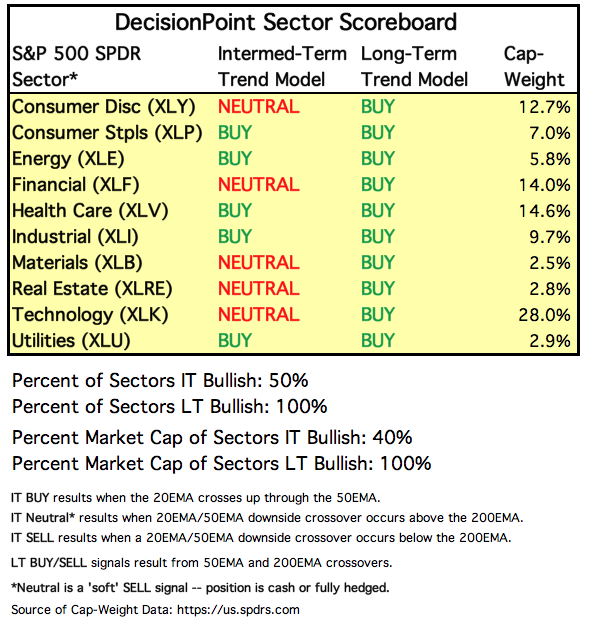
SECTORS
Each S&P 500 Index component stock is assigned to one, and only one, of 10 major sectors. This is a snapshot of the Intermediate-Term and Long-Term Trend Model signal status for those sectors.
STOCKS
IT Trend Model: BUY as of 5/11/2018
LT Trend Model: BUY as of 4/1/2016
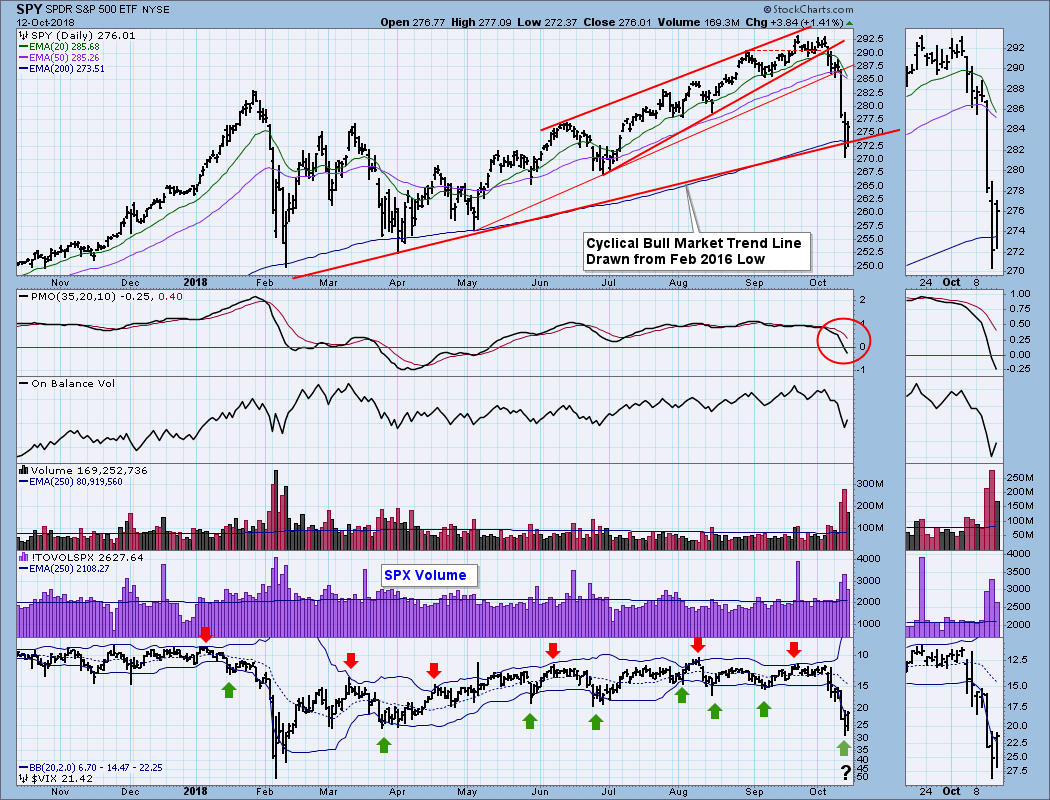
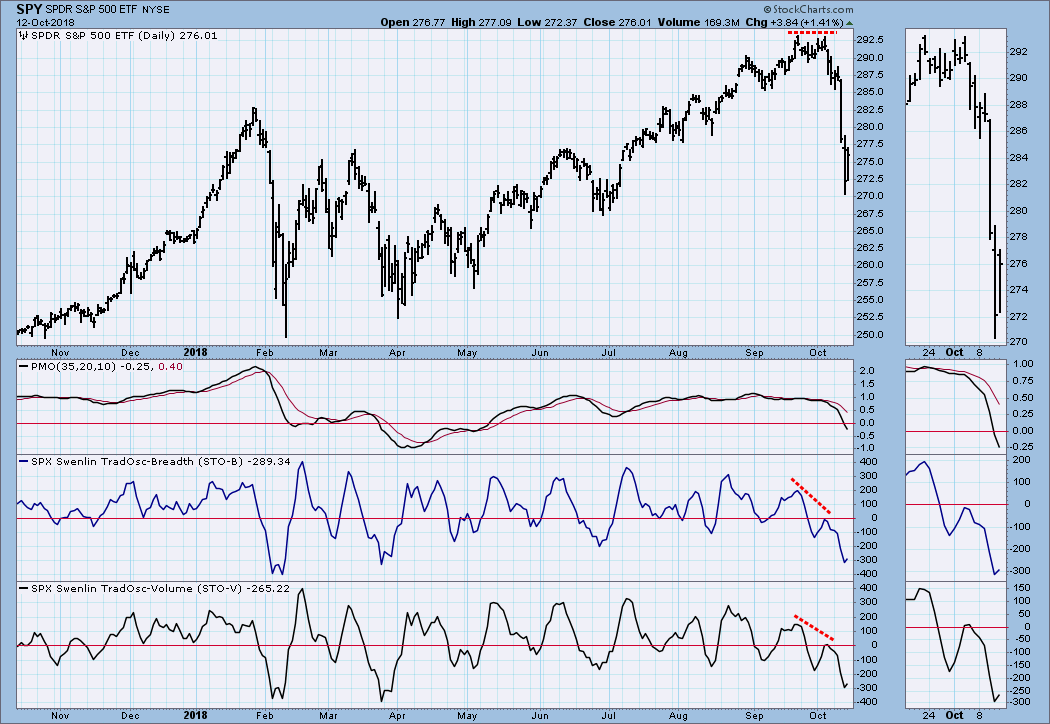
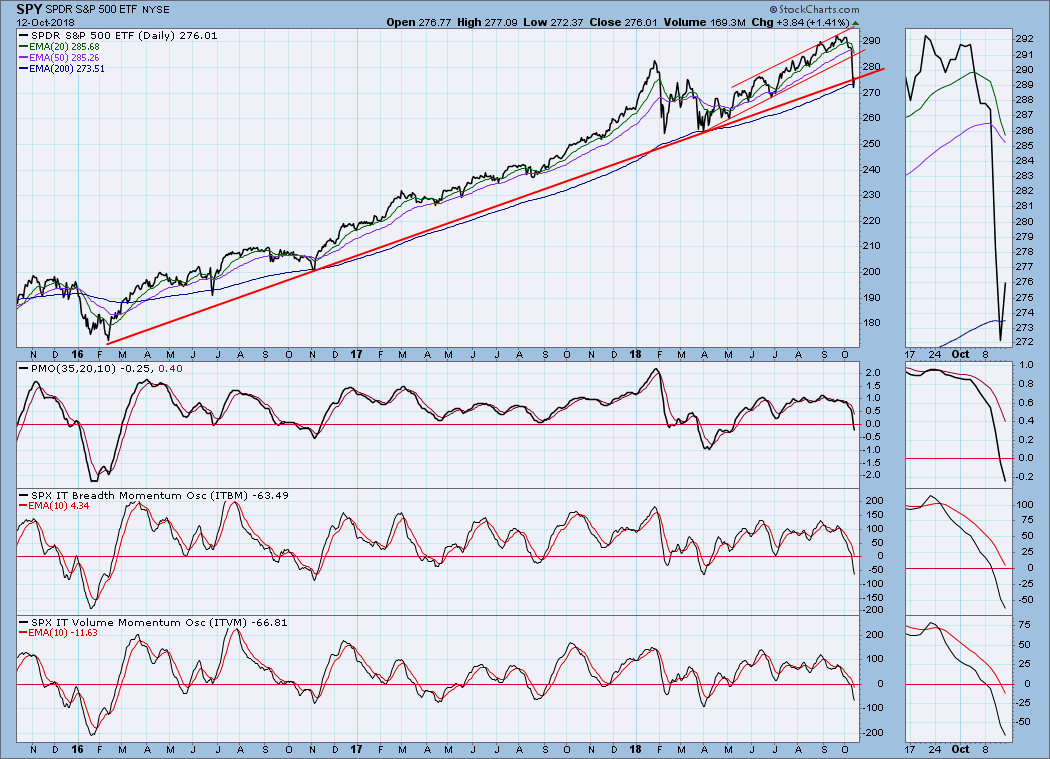
SPY Daily Chart: It's hard to believe, but last week the market was within a hair of all-time highs, and this week it declined almost -8% to challenge the cyclical bull market rising trend line. The VIX may have hit a selling climax on Thursday, signalling the approach of a price bottom, but we shall see. It is highly probable that the 20EMA will pass down through the 50EMA next week, which will change the IT Trend Model to NEUTRAL.
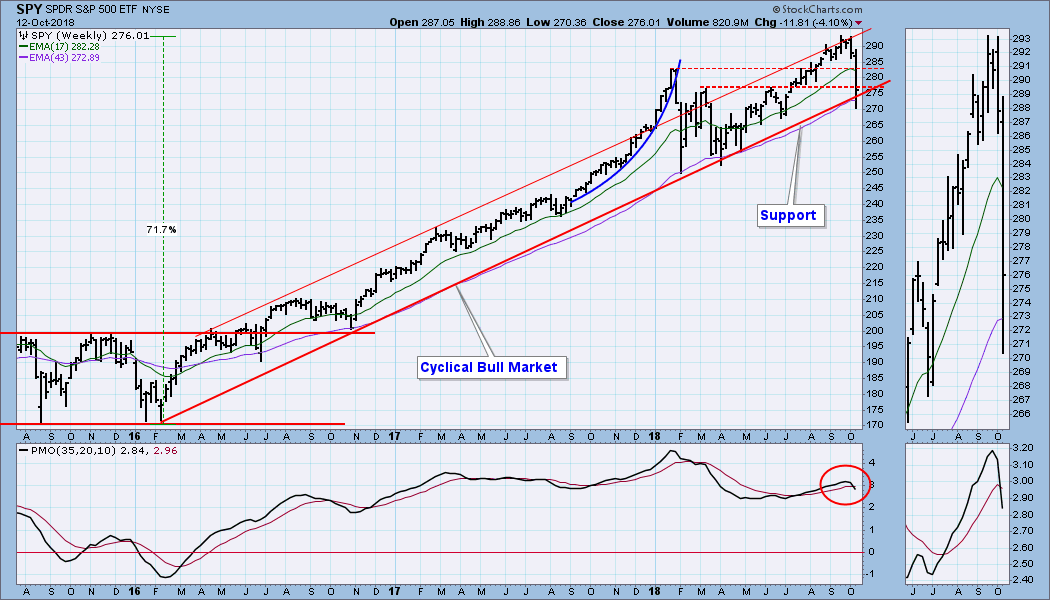
SPY Weekly Chart: The cyclical bull market rising trend line was violated on Wednesday, but the market managed to close on the line by Friday's close. The weekly PMO is below the signal line and falling.
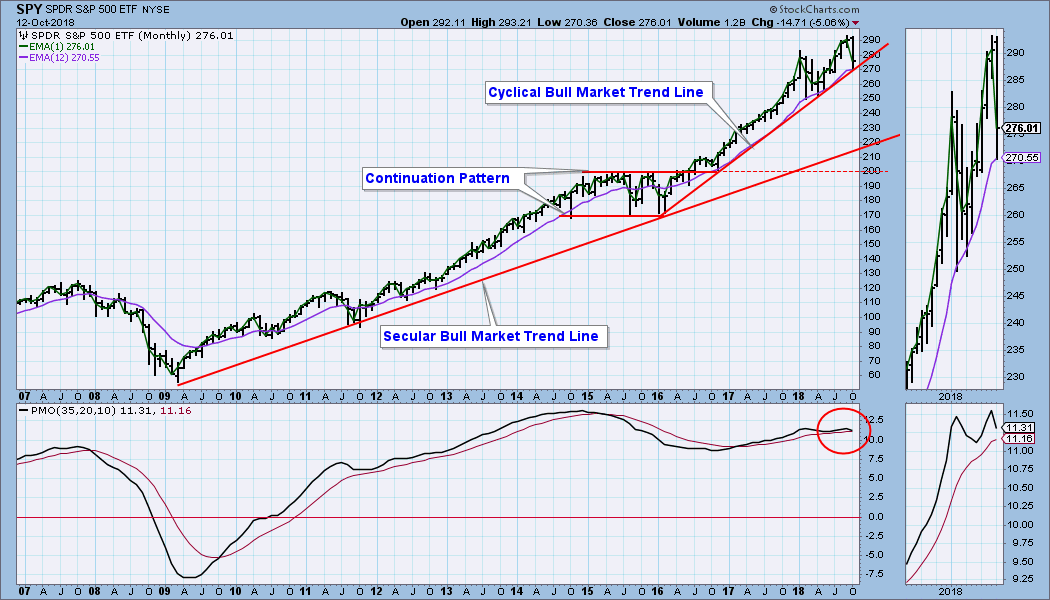
SPY Monthly Chart: I don't normally include a monthly chart, but, with the selling this week, a longer-term perspective will be useful. In this time frame the cyclical bull market rising trend line is intact. The reason I wanted to look at this chart is to see where longer-term support might be found, if we have entered a cyclical bear market -- (not saying we have, just "if"). The secular bull market rising trend line is about -25% below the all-time high. The horizontal support drawn across the 2015 tops is -32% below the top. Could happen, so don't be napping. The monthly PMO has topped, but that is not final until the end of the month.
Short-Term Market Indicators: The STO-B and STO-V are very oversold from very oversold levels. I consider this to be bullish.
Intermediate-Term Market Indicators: All three indicators are below the zero line and falling. There is plenty of room for them to go lower, so they are bearish.
CONCLUSION: A scary week of selling ended on a positive note, when SPY managed to close just above the cyclical bull market rising trend line. The line was actually penetrated, but not decisively. As I said above, the February bottom is a template for a likely outcome this time -- more chopping around for a few days, and a retest. A daily PMO bottom will be an early sign that we have a good short-term bottom. Intermediate-term, the probable IT Trend Model NEUTRAL signal due next week tells us to use any rally as an opportunity to raise cash.
Next Friday is the day before options expiration, so I'll be expecting low volatility toward the end of the week.
DOLLAR (UUP)
IT Trend Model: BUY as of 4/24/2018
LT Trend Model: BUY as of 5/25/2018
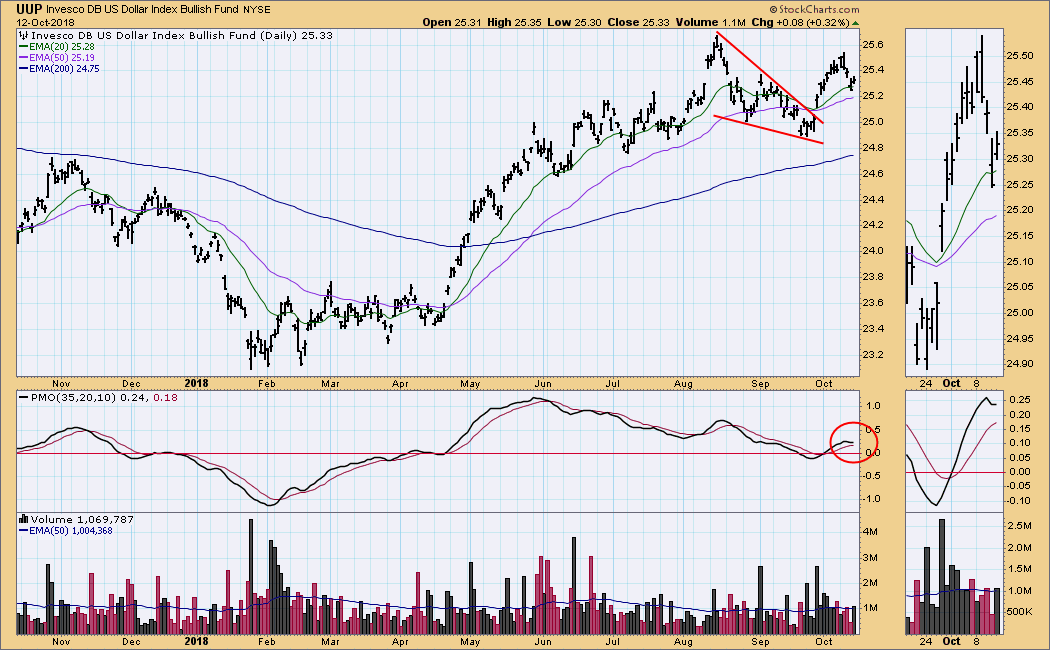
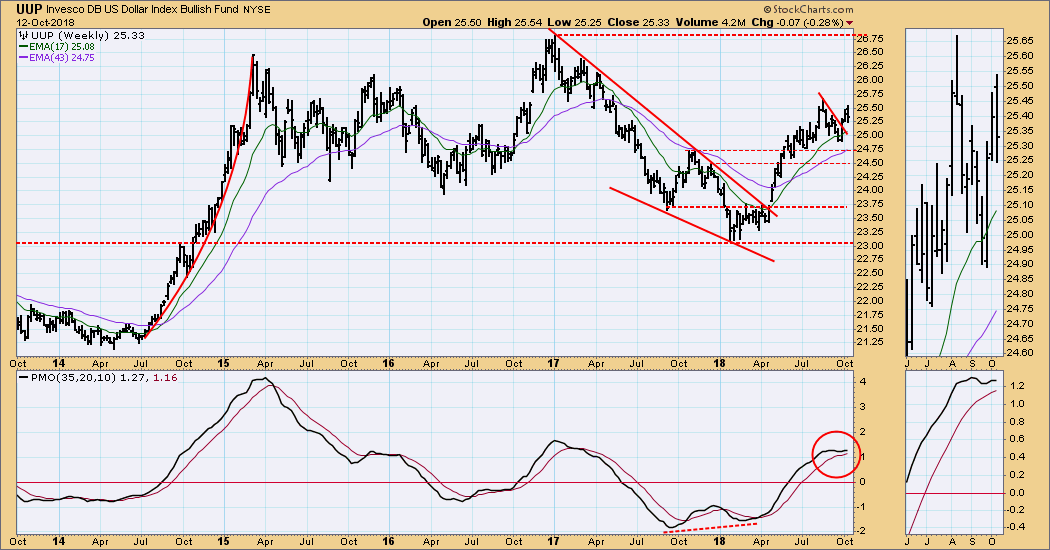
UUP Daily Chart: It was a bad week for the dollar. The rally from the September low finally stalled, and the daily PMO has topped.
UUP Weekly Chart: The weekly PMO is looking indecisive, and it is possible that the rally is finished.
GOLD
IT Trend Model: NEUTRAL as of 5/2/2018
LT Trend Model: SELL as of 6/22/2018
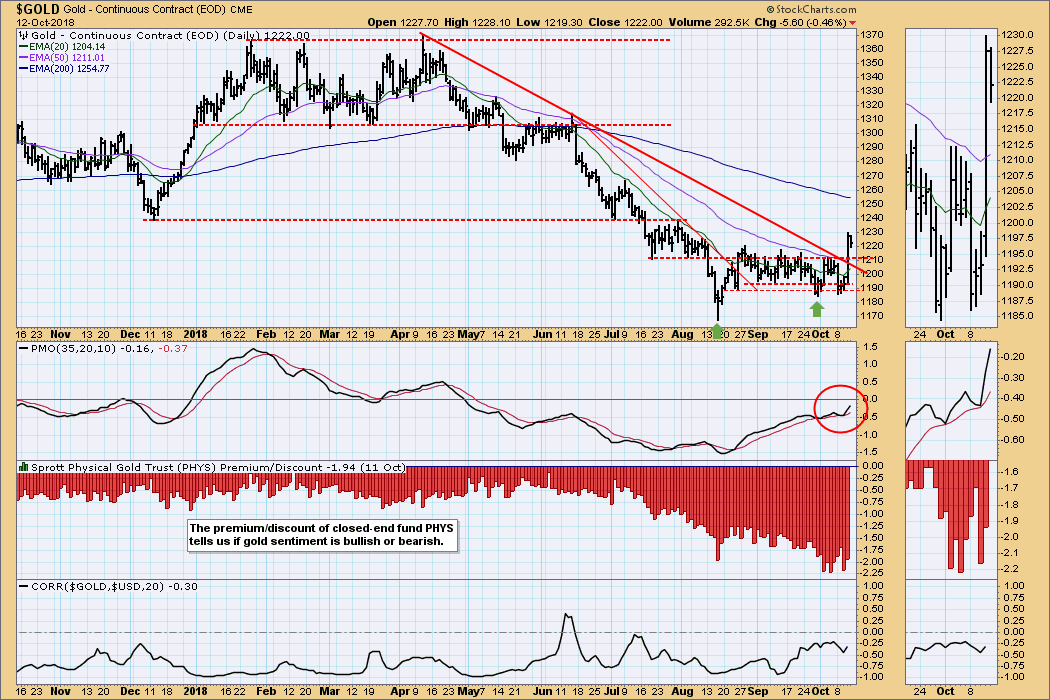
GOLD Daily Chart: On Thursday gold had a strong breakout above horizontal resistance and a longer-term declining tops line. It consolidated on Friday. Sentiment is still negative, and I'd like to see that turn positive as assurance that the rally has some legs.
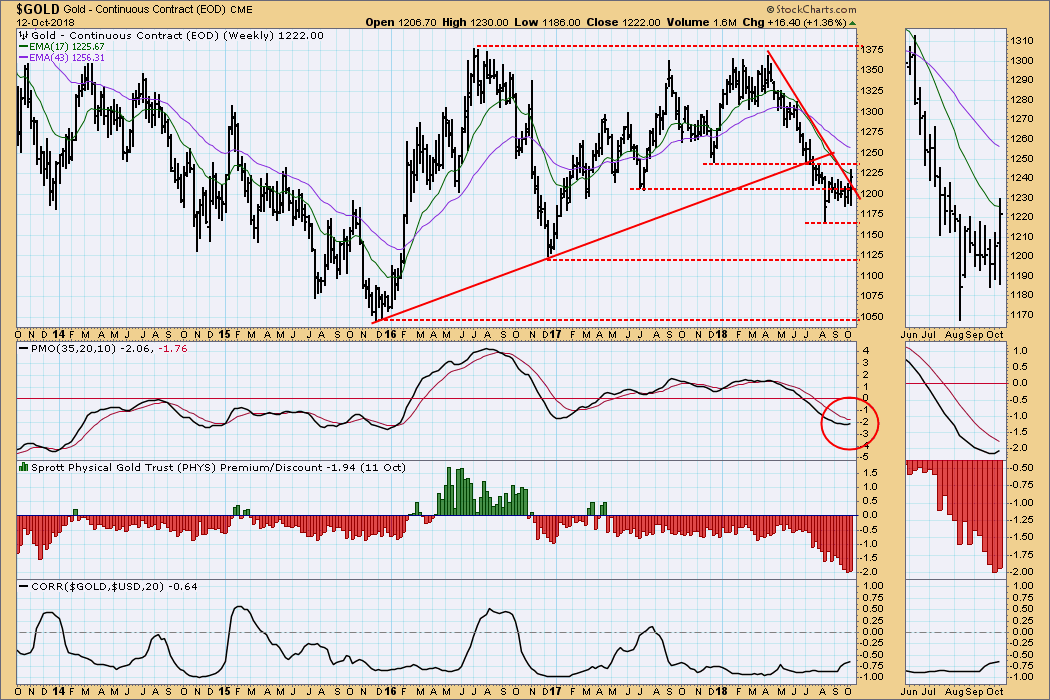
GOLD Weekly Chart: The weekly PMO has turned up, an important confirmation that a rally could be in progress.
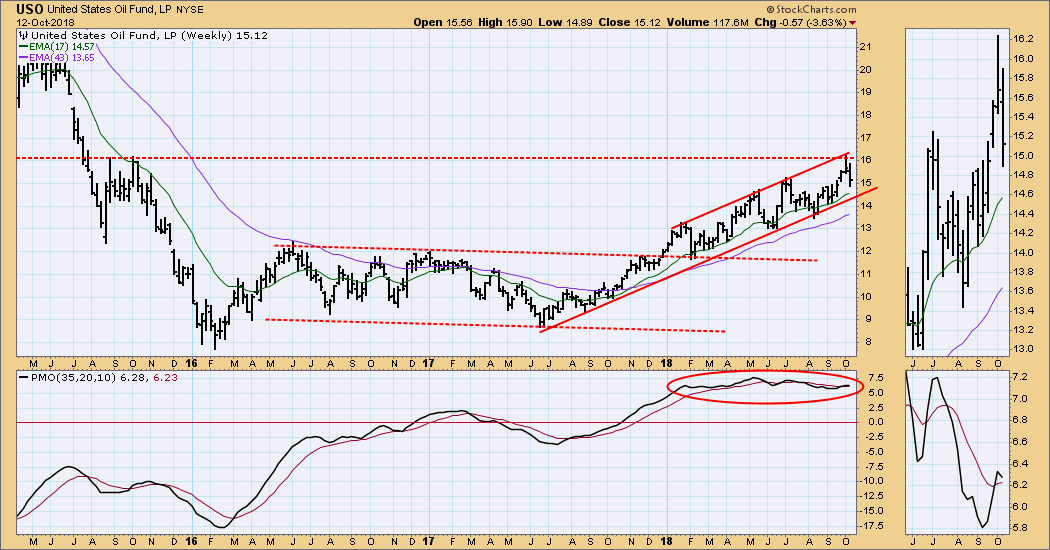
CRUDE OIL (USO)
IT Trend Model: BUY as of 8/24/2018
LT Trend Model: BUY as of 11/2/2017
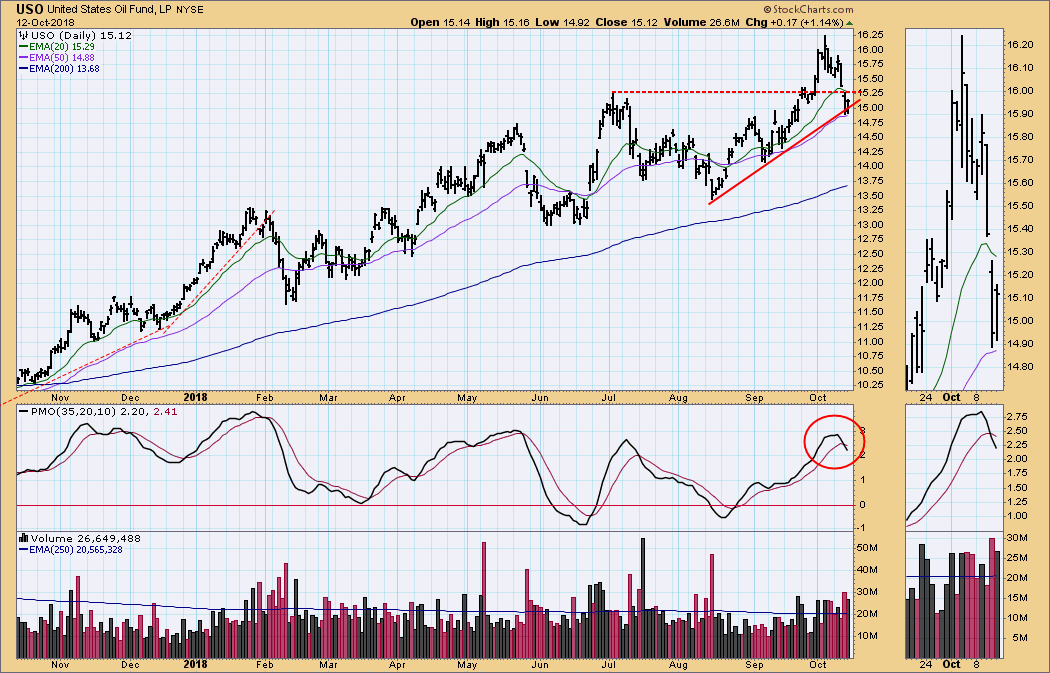
USO Daily Chart: Horizontal support was broken last week, and the rising trend line support is being challenged this week. The daily PMO has topped and crossed down through the signal line, so the implication is that more price decline should be expected.
USO Weekly Chart: USO has retreated from the top of the rising trend channel (and horizontal resistance) and seems headed for the bottom of the channel.
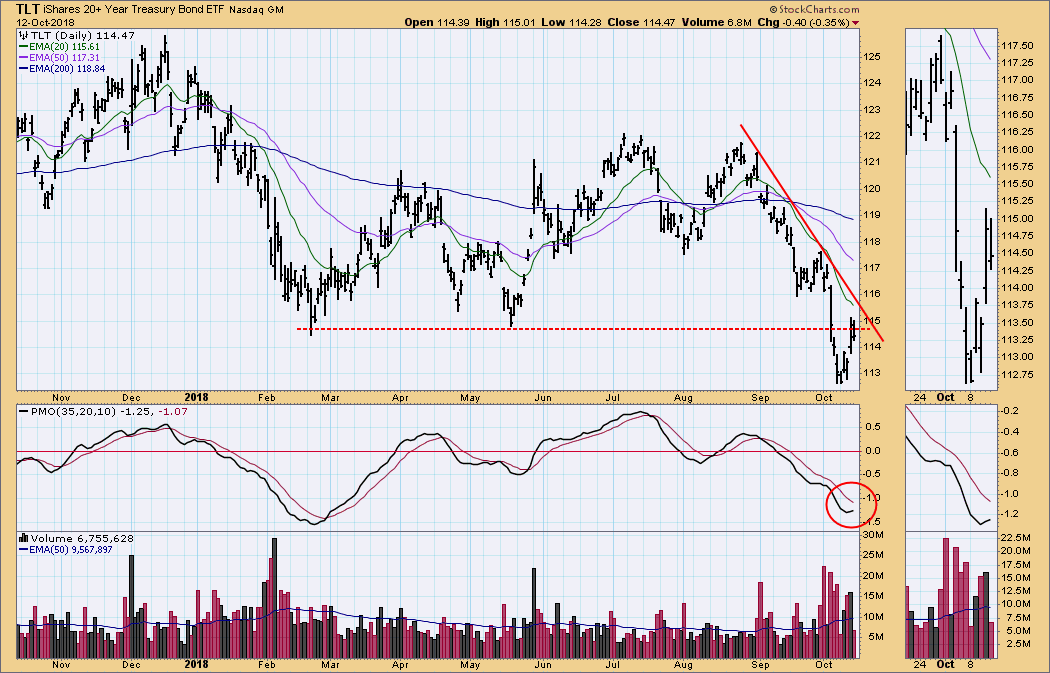
BONDS (TLT)
IT Trend Model: NEUTRAL as of 9/13/2018
LT Trend Model: SELL as of 9/18/2018
TLT Daily Chart: TLT tried unsuccessfully to recapture the horizontal support it violated last week.
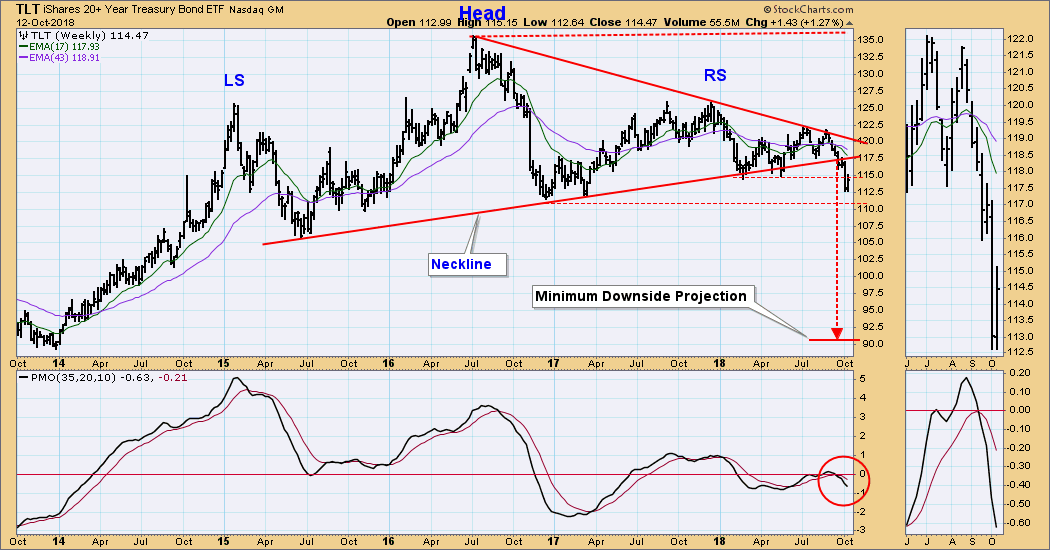
TLT Weekly Chart: The neckline of the head and shoulders pattern has been violated, and a minimum downside target has been noted. Horizontal support was violated last week, and this week there was a reaction rally. Unless some major fundamental element changes, I think bonds are in for a long-term (years) decline.
**Don't miss any of the DecisionPoint commentaries! Go to the "Notify Me" box toward the end of this blog page to be notified as soon as they are published.**
Technical Analysis is a windsock, not a crystal ball.
Happy Charting!
- Carl
NOTE: The signal status reported herein is based upon mechanical trading model signals, specifically, the DecisionPoint Trend Model. They define the implied bias of the price index based upon moving average relationships, but they do not necessarily call for a specific action. They are information flags that should prompt chart review. Further, they do not call for continuous buying or selling during the life of the signal. For example, a BUY signal will probably (but not necessarily) return the best results if action is taken soon after the signal is generated. Additional opportunities for buying may be found as price zigzags higher, but the trader must look for optimum entry points. Conversely, exit points to preserve gains (or minimize losses) may be evident before the model mechanically closes the signal.
Helpful DecisionPoint Links:
DecisionPoint Shared ChartList and DecisionPoint Chart Gallery
Price Momentum Oscillator (PMO)
Swenlin Trading Oscillators (STO-B and STO-V)


