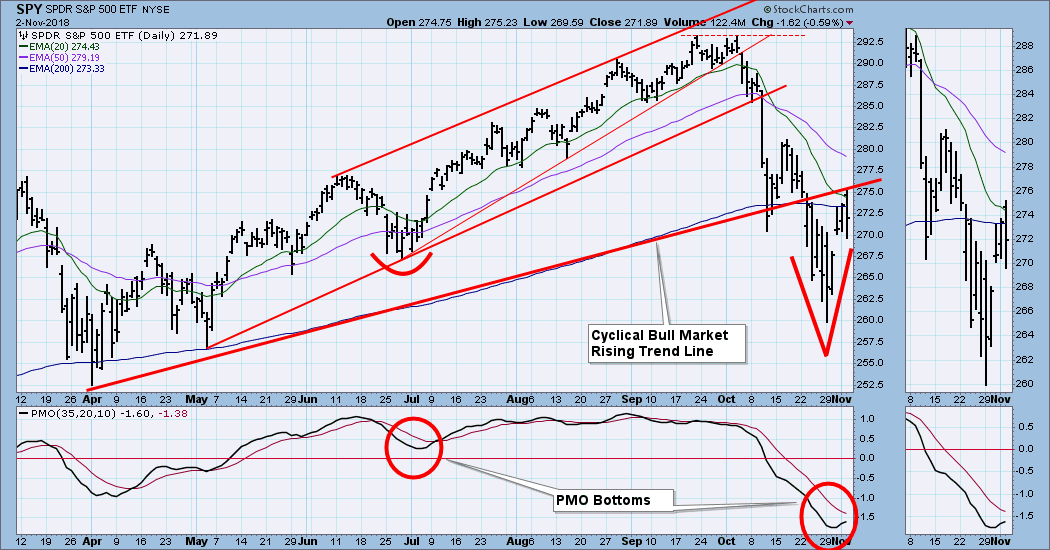
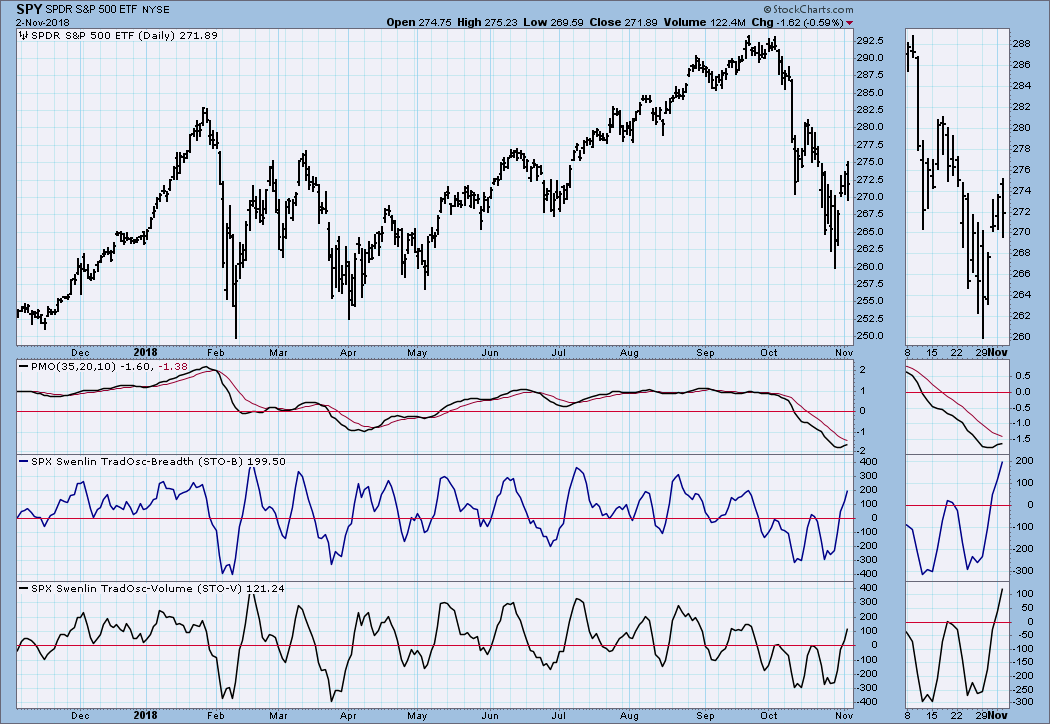
In the Weekly Wrap I have been saying that a short-term buy of SPY should not be considered until the daily PMO turns up. As it happens, the PMO turned up on Thursday, but I must confess that I wasn't thrilled. When the Price Momentum Oscillator (PMO) turns up, we should view it as a possible short-term BUY signal; however, there are plenty of caveats to that statement. For one thing, we want to see the PMO make a smooth bottom after a nice, smooth decline. I have highlighted two of what I consider to be the best looking PMO bottoms on the chart. The problem with the most recent one is that the corresponding price bottom presents as a sharp "V" compared to the more gradual, rounded price bottom in June/July. Bottom line is that the July PMO bottom came a day before the price breakout, whereas the most recent PMO bottom didn't materialize until after the price breakout. Not to mention the problems with the rising trend line, that has now become resistance. I will err on the side of caution and say that the current setup is less than ideal. Pass.
The DecisionPoint Weekly Wrap presents an end-of-week assessment of the trend and condition of the stock market (S&P 500), the U.S. Dollar, Gold, Crude Oil, and Bonds.
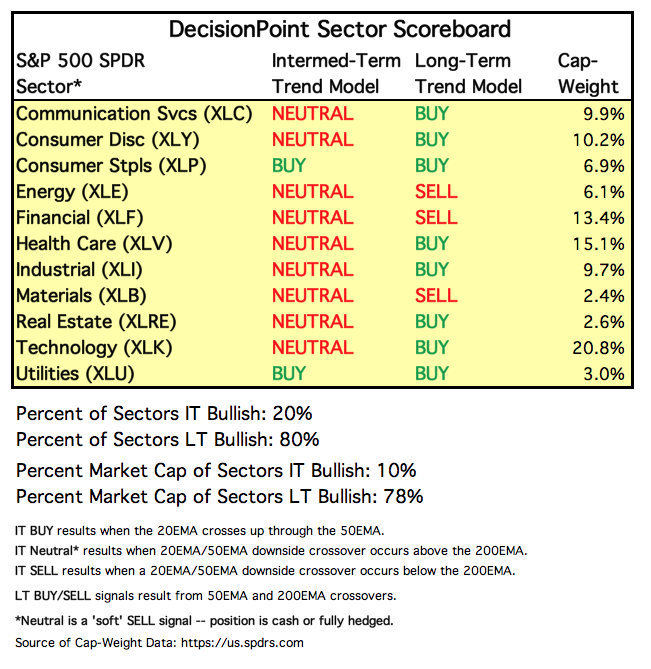
SECTORS
Each S&P 500 Index component stock is assigned to one, and only one, of 11 major sectors. This is a snapshot of the Intermediate-Term and Long-Term Trend Model signal status for those sectors.
STOCKS
IT Trend Model: NEUTRAL as of 10/15/2018
LT Trend Model: BUY as of 4/1/2016
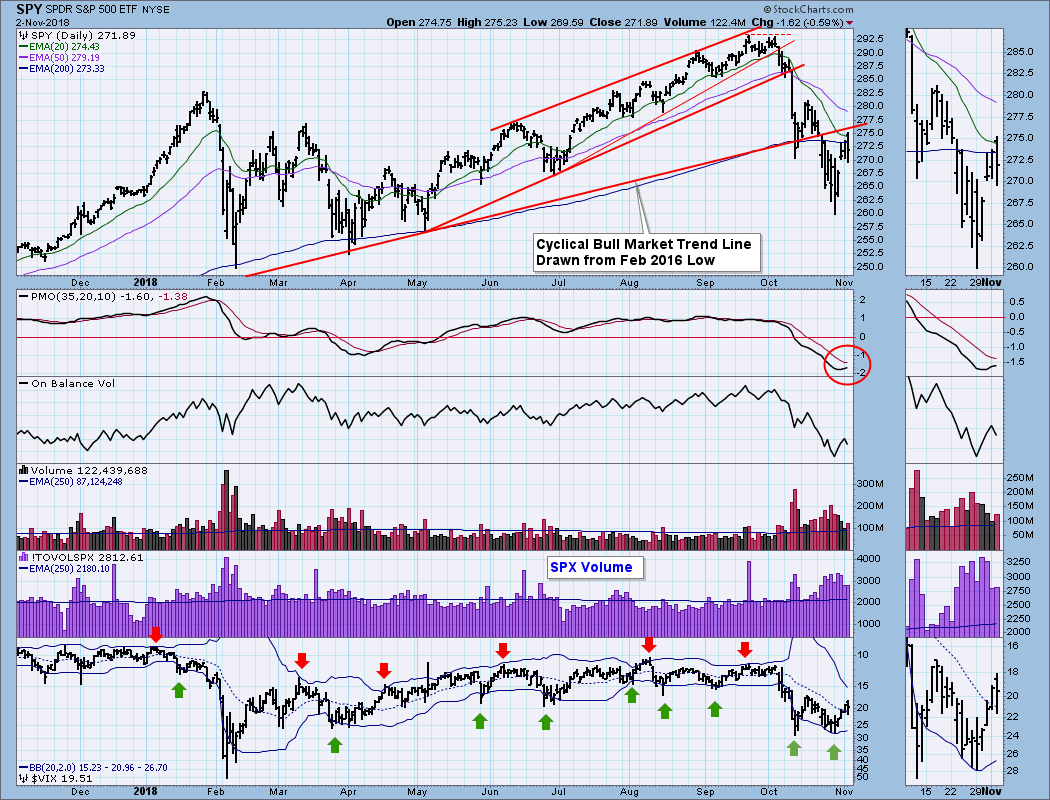
SPY Daily Chart: Last week the cyclical bull market rising trend line support was broken. This week the decline was extended, then the market rallied back toward the trend line, which is now overhead resistance.
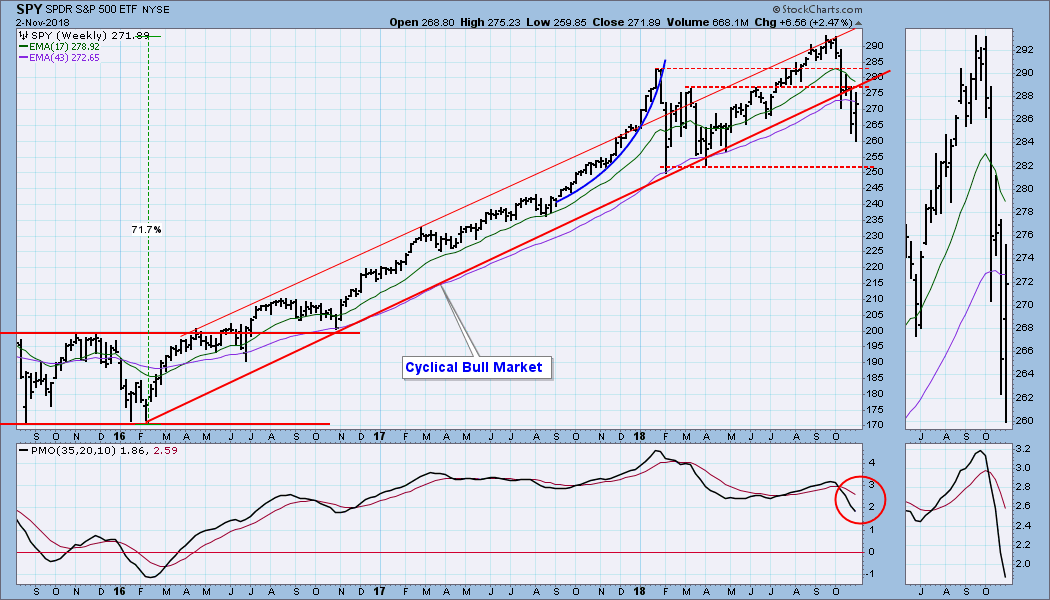
SPY Weekly Chart: In this time frame we really experience the dramatic effect of the cyclical bull market trend line violation. It is not too difficult to believe that we have entered a bear market.
Short-Term Market Indicators: The STO-B and STO-V are becoming overbought.
Intermediate-Term Market Indicators: All these indicators have turned up from very oversold readings. If I am right about the bear market, they'll be turning down again soon.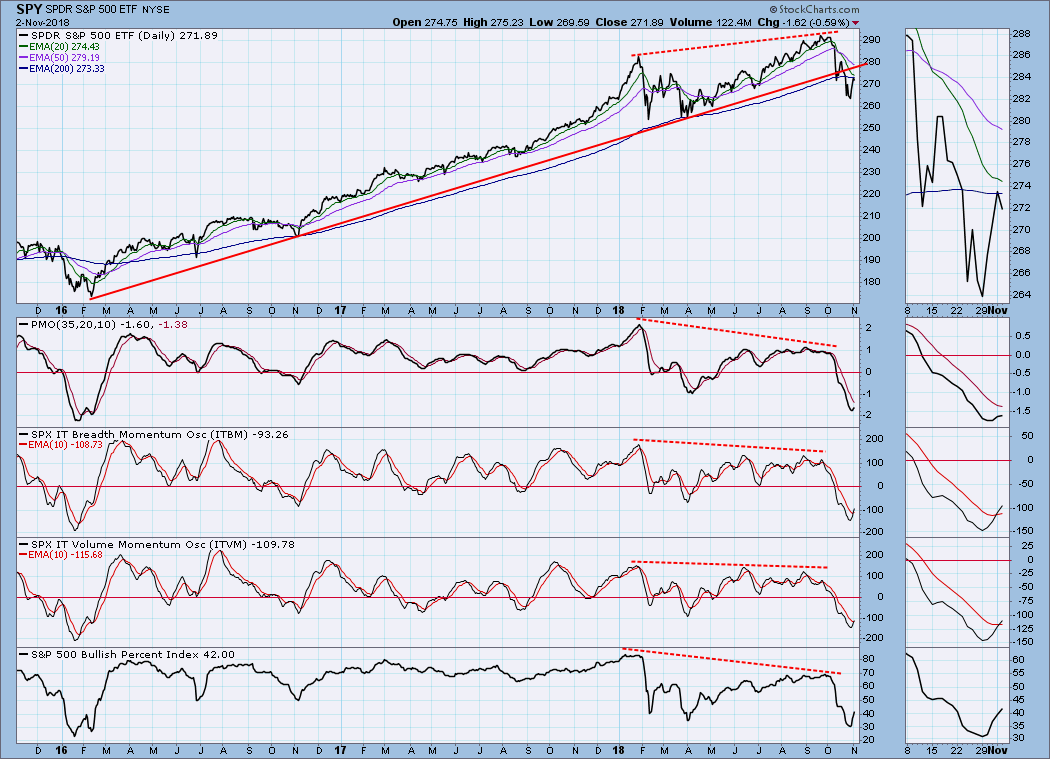
CONCLUSION: We have a lot of oversold indicators that have turned up, and the market (SPY) has had a strong rally off an oversold low. If the bull still lives, we're on our way higher, but, if the bear in in residence, we'll be headed lower very soon. I think the bear is in charge now.
DOLLAR (UUP)
IT Trend Model: BUY as of 4/24/2018
LT Trend Model: BUY as of 5/25/2018
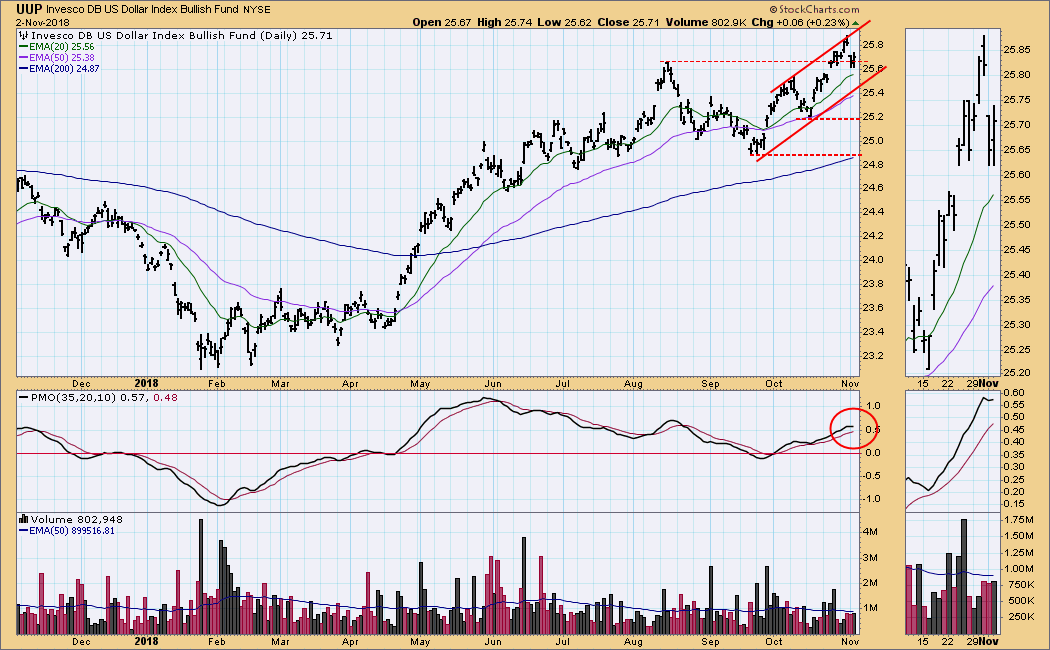
UUP Daily Chart: UUP has turned down from the top of a rising trend channel, so the next expectation is for it to move to the bottom of the channel.
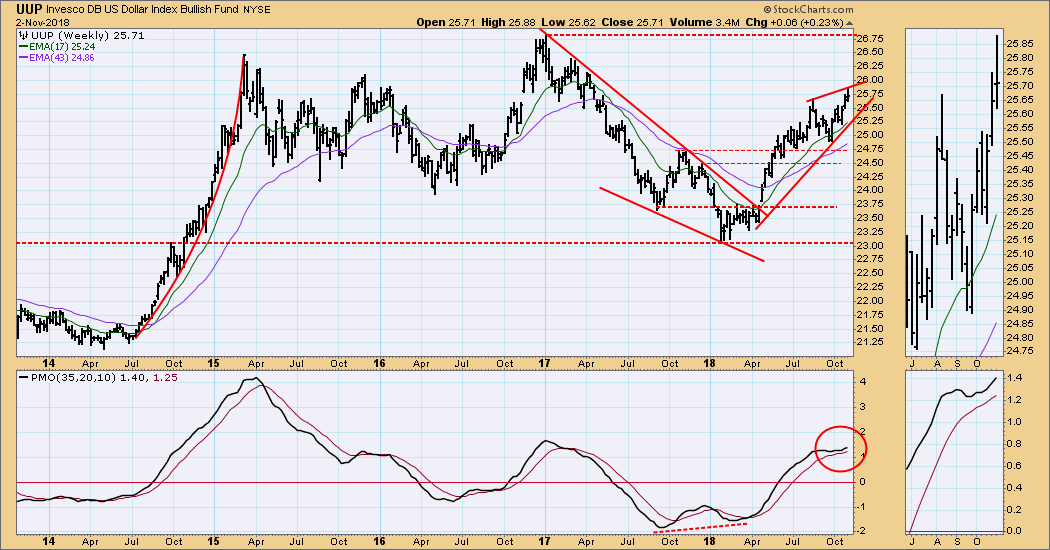
UUP Weekly Chart: Since we're expecting a pullback on the daily chart, I have tentatively drawn the top of a rising wedge in this time frame. If that proves to be accurate, we should then look for the wedge to resolve downward.
GOLD
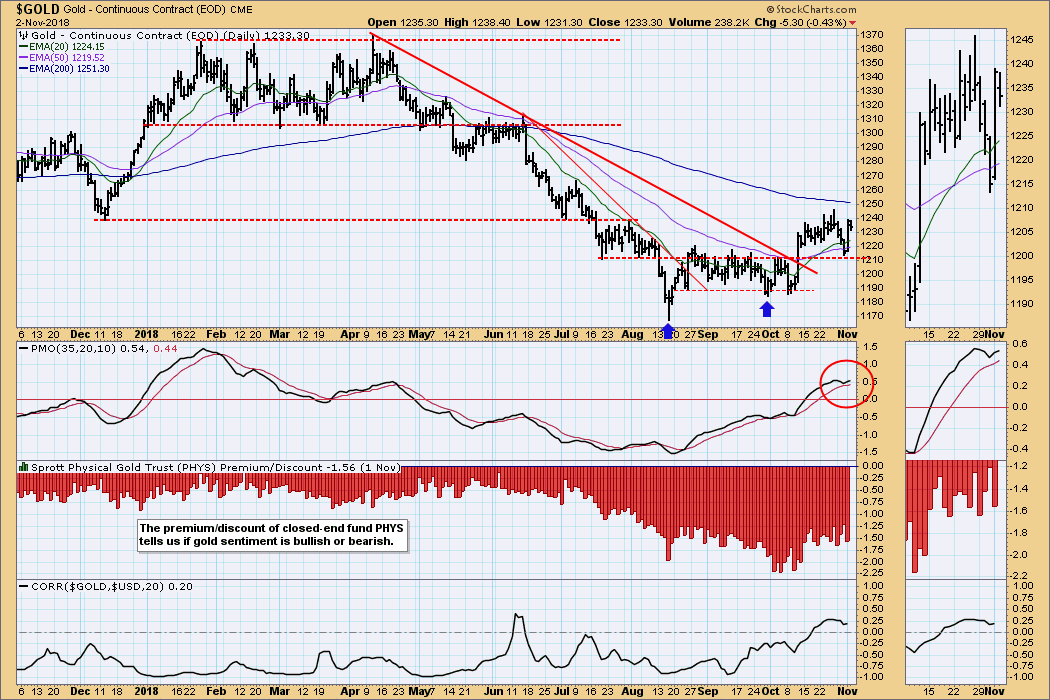
IT Trend Model: BUY as of 10/19/2018
LT Trend Model: SELL as of 6/22/2018
GOLD Daily Chart: This week there was a technical pullback to the point of breakout earlier in October. Price rebounded on Thursday, and the daily PMO turned back up. Gold is positively correlated with the dollar, which is good since the dollar continues to rally.
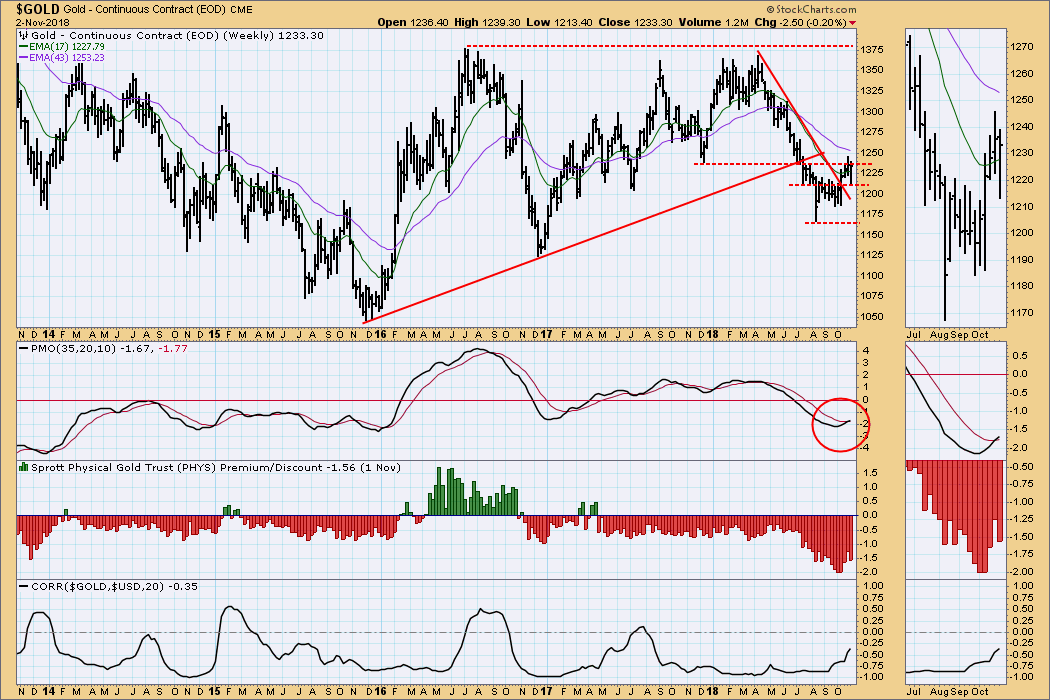
GOLD Weekly Chart: The weekly PMO has a solid looking bottom, and it has crossed up through the signal line. The picture is bullish, but negative sentiment is still a drag on the advance.
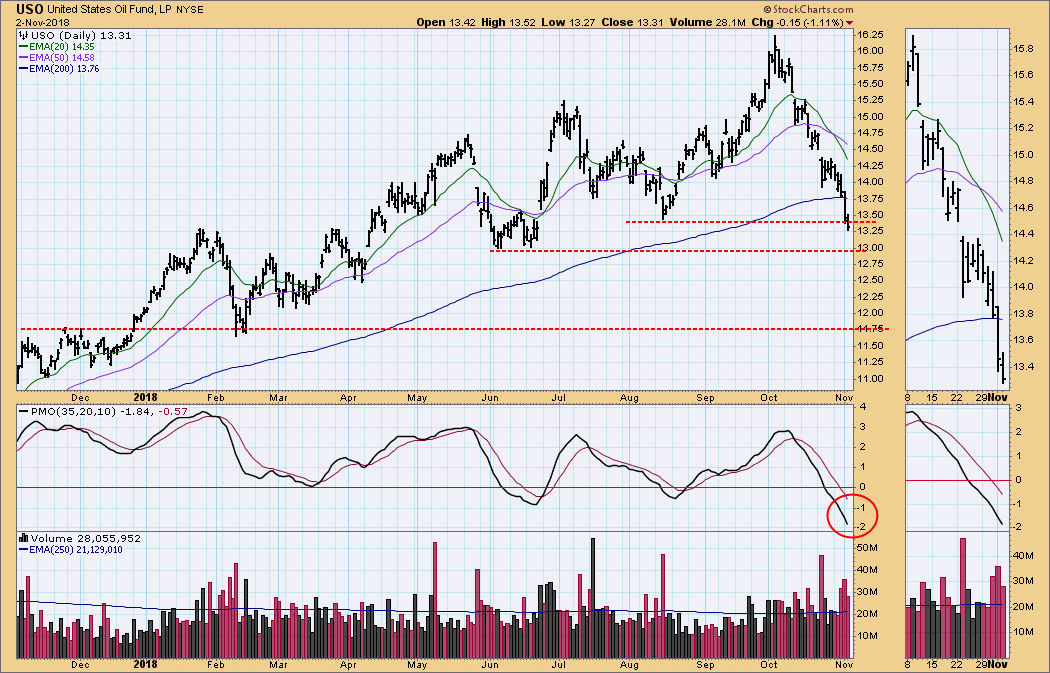
CRUDE OIL (USO)
IT Trend Model: NEUTRAL as of 10/29/2018
LT Trend Model: BUY as of 11/2/2017
USO Daily Chart: On Tuesday the IT Trend Model for USO switched from BUY to NEUTRAL. Price is still breaking down, and I have drawn some potential levels of support.
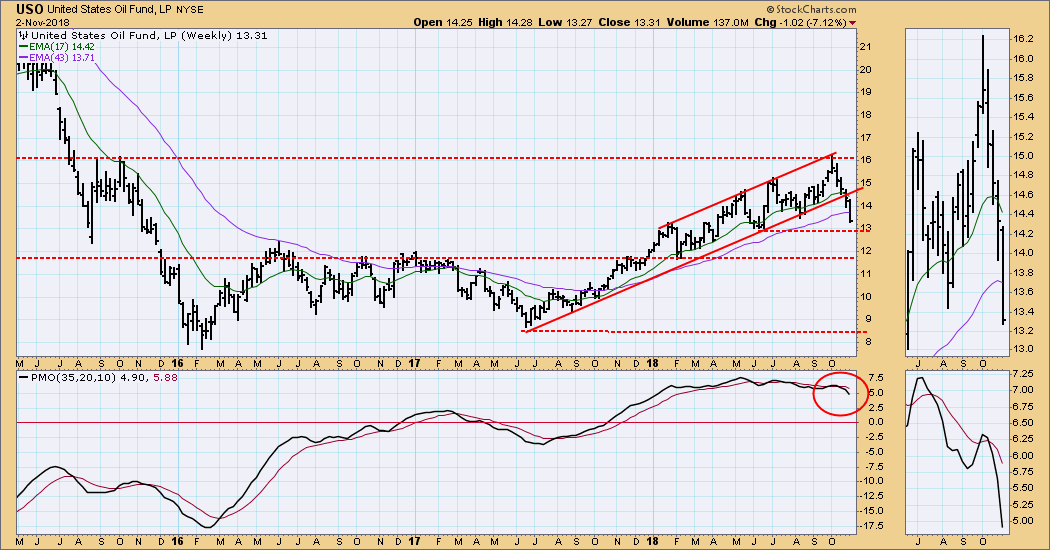
USO Weekly Chart: Longer-term the most convincing level of support, in my opinion, is at about 11.75.
BONDS (TLT)
IT Trend Model: NEUTRAL as of 9/13/2018
LT Trend Model: SELL as of 9/18/2018
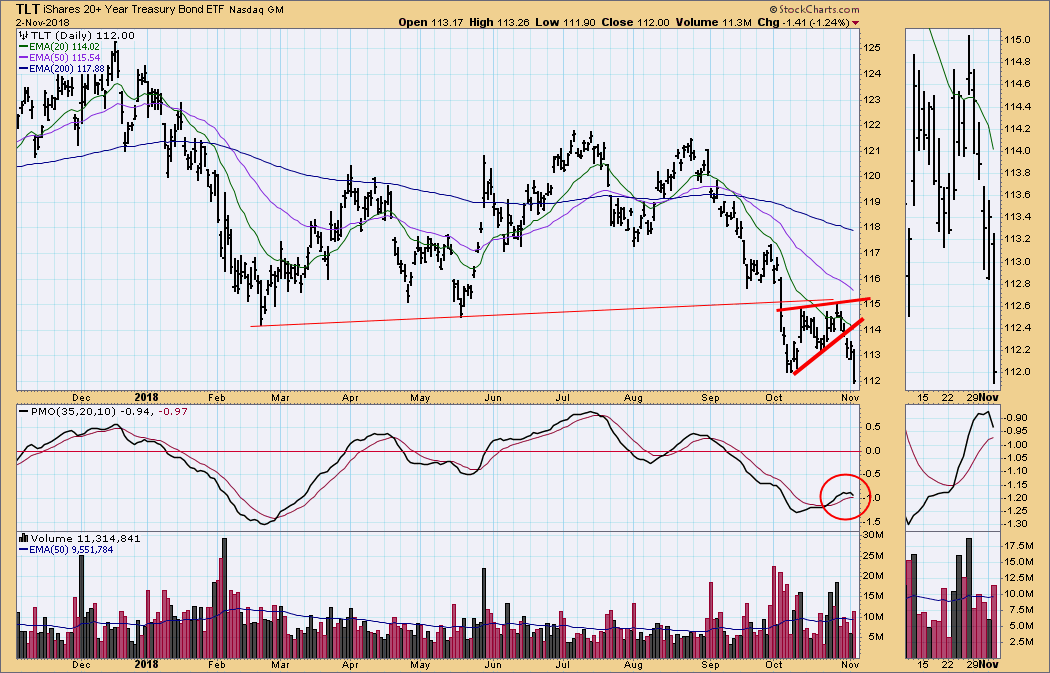
TLT Daily Chart: TLT broke down through support in early-October. The consolidation/snapback that took place after the breakdown formed a rising wedge, which would be expected to resolve downward. It did, and the daily PMO topped well below the zero line -- a very negative picture.
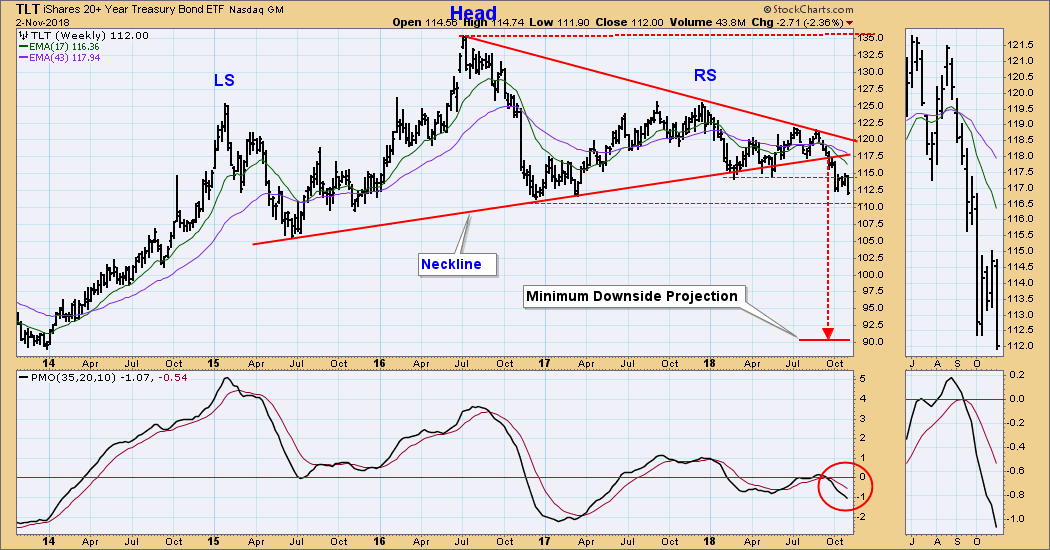
TLT Weekly Chart: In the longer-term view we can see the breakdown of a head and shoulders pattern, and TLT seems to be headed toward the minimum downside projection.
**Don't miss any of the DecisionPoint commentaries! Go to the "Notify Me" box toward the end of this blog page to be notified as soon as they are published.**
Technical Analysis is a windsock, not a crystal ball.
Happy Charting!
- Carl
NOTE: The signal status reported herein is based upon mechanical trading model signals, specifically, the DecisionPoint Trend Model. They define the implied bias of the price index based upon moving average relationships, but they do not necessarily call for a specific action. They are information flags that should prompt chart review. Further, they do not call for continuous buying or selling during the life of the signal. For example, a BUY signal will probably (but not necessarily) return the best results if action is taken soon after the signal is generated. Additional opportunities for buying may be found as price zigzags higher, but the trader must look for optimum entry points. Conversely, exit points to preserve gains (or minimize losses) may be evident before the model mechanically closes the signal.
Helpful DecisionPoint Links:
DecisionPoint Shared ChartList and DecisionPoint Chart Gallery
Price Momentum Oscillator (PMO)
Swenlin Trading Oscillators (STO-B and STO-V)


