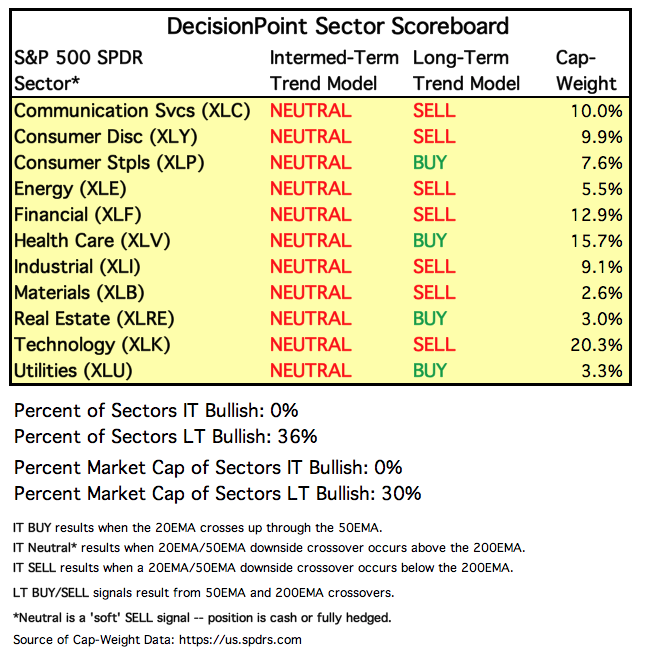
On Friday the signal for the Utilities sector changed from BUY to NEUTRAL, making it the last of the 11 S&P 500 sectors to lose its bullish stance. NEUTRAL sounds kind of, well, neutral, but it is really a 'soft' SELL signal because the position changes from long to cash or fully hedged. Seven of those 11 sectors now have Long-Term Trend Model SELL signals (50EMA is below the 200EMA).
The DecisionPoint Weekly Wrap presents an end-of-week assessment of the trend and condition of the stock market (S&P 500), the U.S. Dollar, Gold, Crude Oil, and Bonds.
MONTHLY CHART EXCEPTION: There is only one trading day left in the month, so I decided to include the monthly charts in this issue. If Monday's market action significantly changes any of the monthly outlooks, Erin will cover it.
STOCKS
IT Trend Model: NEUTRAL as of 10/15/2018
LT Trend Model: SELL as of 12/14/2018
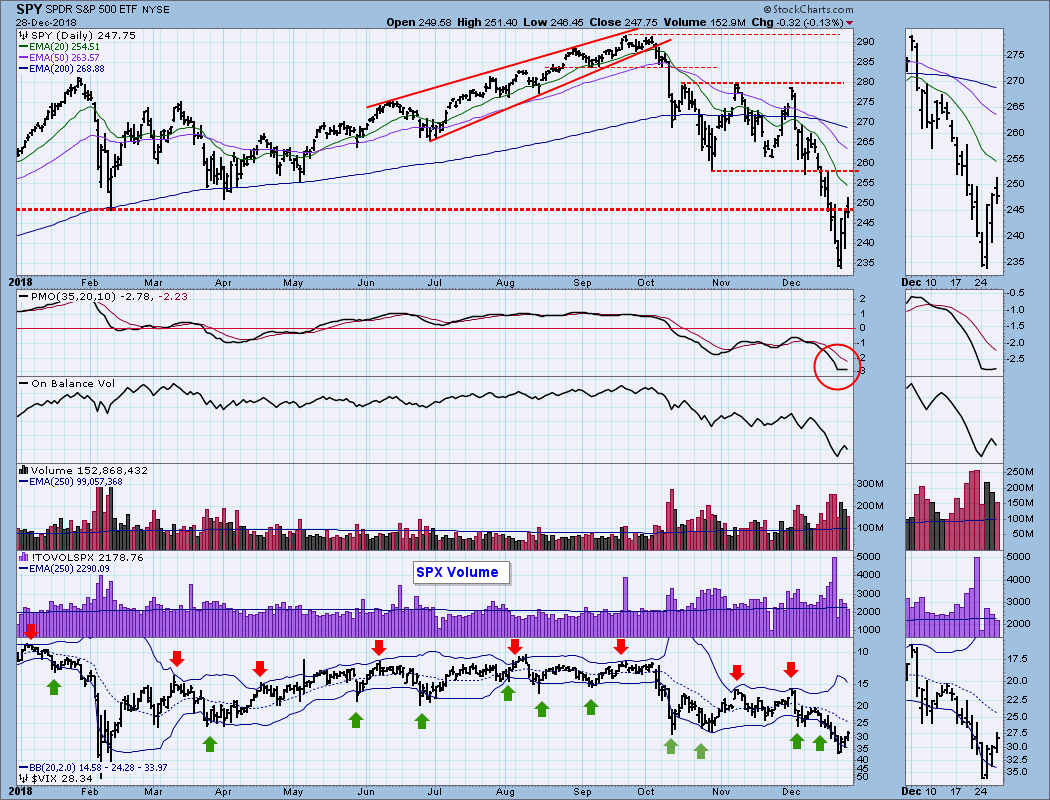
SPY Daily Chart: This week's advance was basically a short-covering rally. Things were really black on Monday, probably sucking in the last of the shorts. While Wednesday's huge rally caught our attention, volume on that day wasn't as exciting. Yes, it was above the 250EMA of volume, it should have been a lot higher if the move truly was a turning point. The daily PMO has turned up, but just barely.
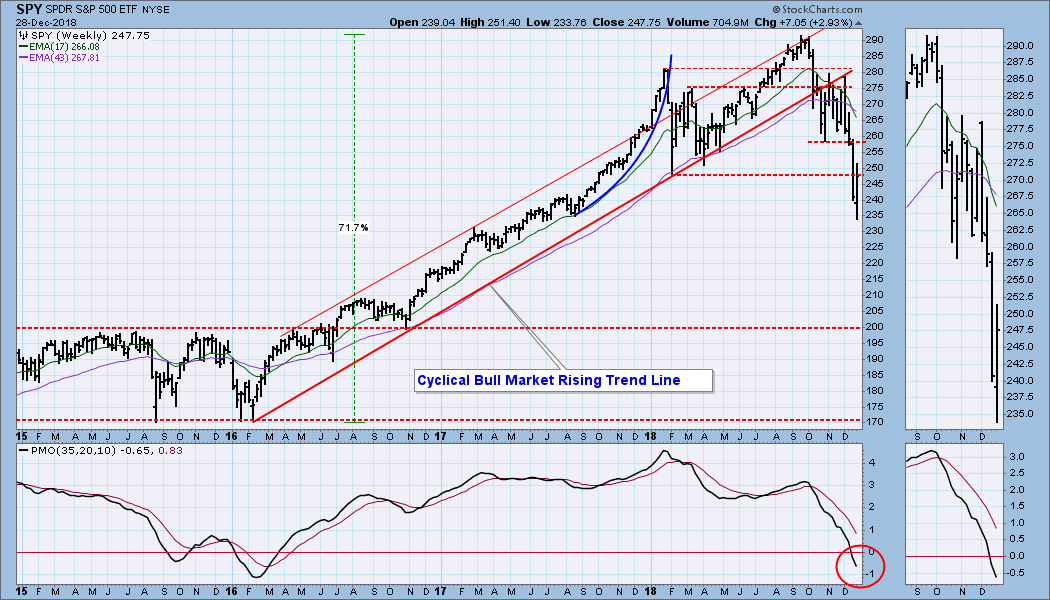
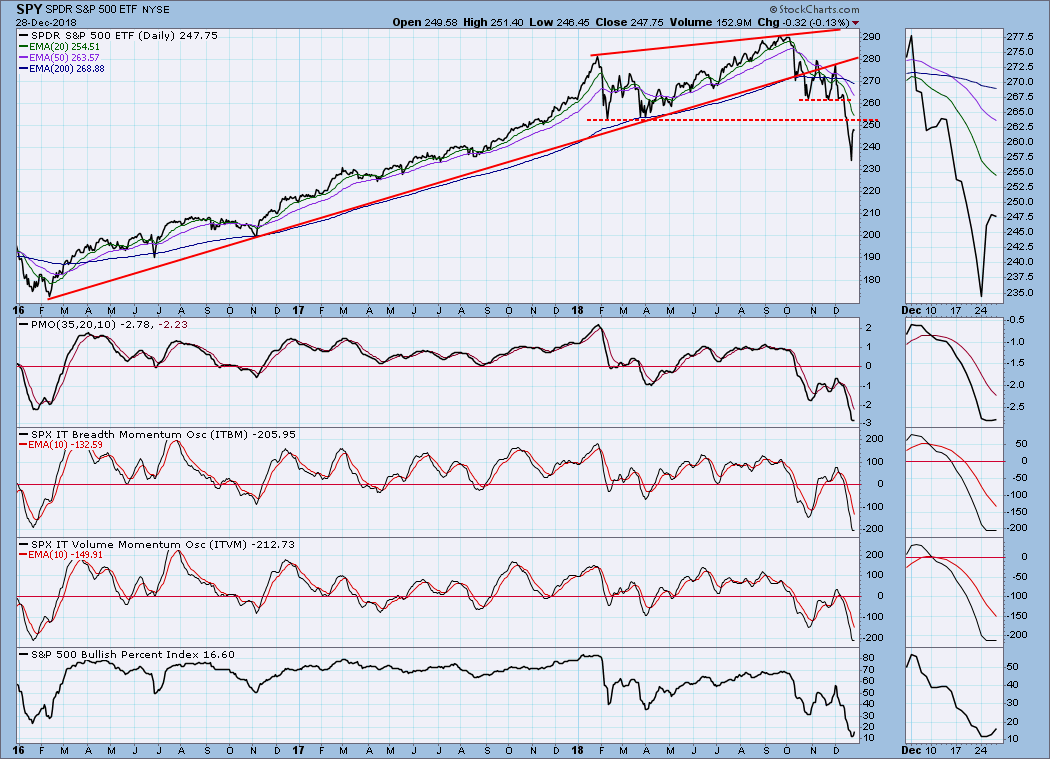
SPY Weekly Chart: The net gain for the week was just under +3%, and the weekly PMO was barely affected.
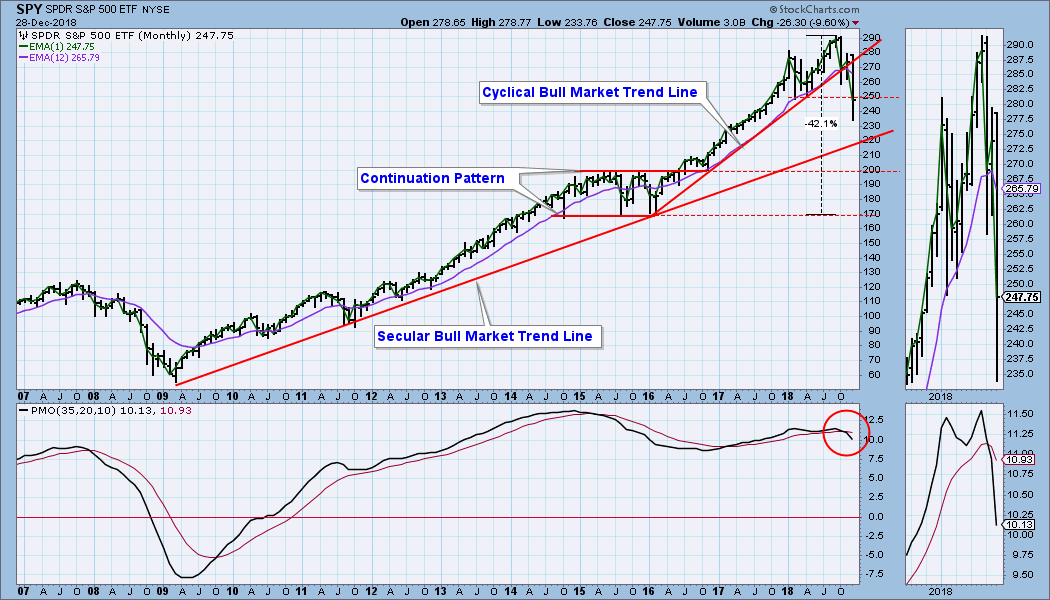
SPY Monthly Chart: The line drawn across the February low represents the most immediate overhead resistance. The next important support is on the secular bull market rising trend line; however, I favor the top and bottom of the 2015 consolidation pattern as a more credible zone of support. The monthly PMO is below the signal line and falling. This is very bearish.
Short-Term Market Indicators: While we need to be wary of oversold readings in a bear market, deeply oversold readings have a high probability of sparking a rally. On Monday the STO-B and STO-V had the lowest readings seen in almost three years.
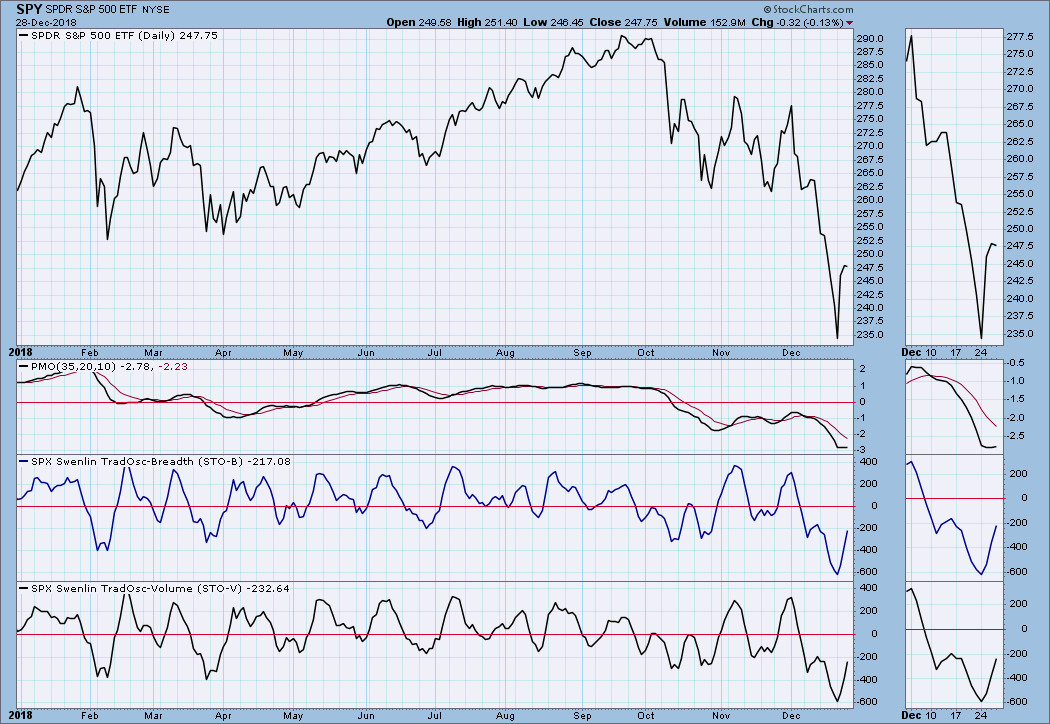
Intermediate-Term Market Indicators: These indicators have reached the low side of their normal range, so, as with the short-term indicators, it is not surprising that prices rallied this week.
CONCLUSION: I continue to believe that we are in a bear market. In a bull market an oversold, short-covering rally would mark the end of whatever correction may have been taking place; however, in a bear market oversold readings, as we have just witnessed, are more than likely initiation markers, showing the end of the first downside impulse. As I look at the marked deceleration that took place on Thursday and Friday, it is not hard to imagine seeing a resumption of the selling next week. That is not a prediction, but I'll bet most people are not expecting it. It being another holiday week could mean a continuation of the wackiness.
ADDITIONAL COMMENT RE CRUDE OIL: Realizing that many may not follow crude oil that closely and won't see my comments below, I want to express my concern for the recent crash in crude prices -- down over -40% in less than three months. This is good news for us at the gas pump, but we should keep in mind that the rapid collapse of crude prices has got to be causing major dislocations within the industry, which will have a negative effect in other areas. This is a factor that goes on my list of concerns along with the anticipated weakness in real estate, and the debt bomb.
DOLLAR (UUP)
IT Trend Model: BUY as of 4/24/2018
LT Trend Model: BUY as of 5/25/2018
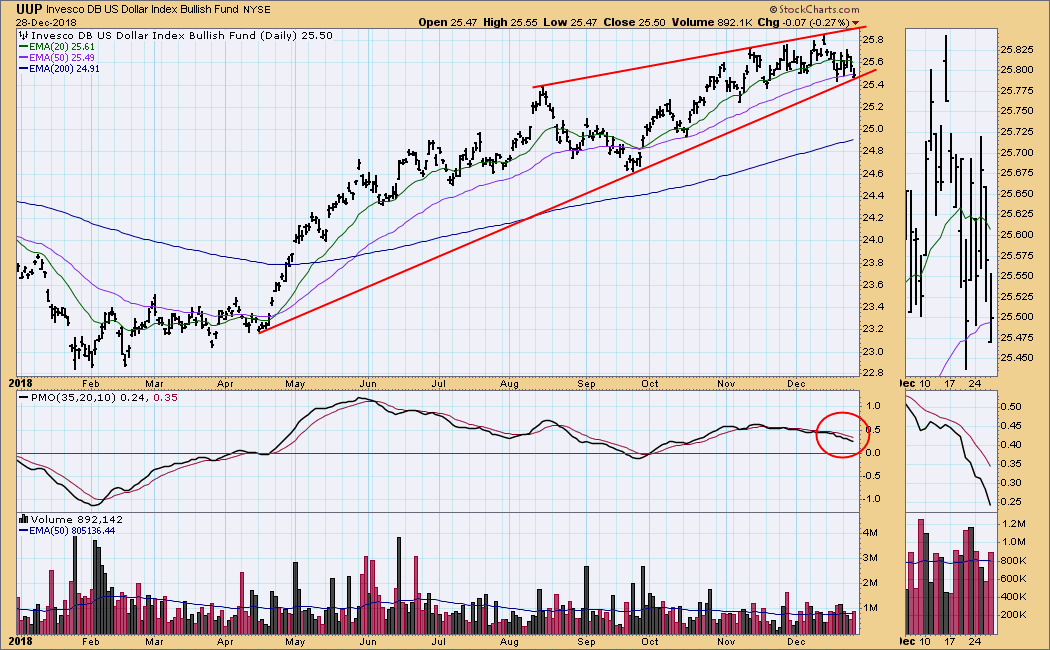
UUP Daily Chart: Price is testing the bottom of a rising wedge pattern. The technical expectation is a downside resolution.
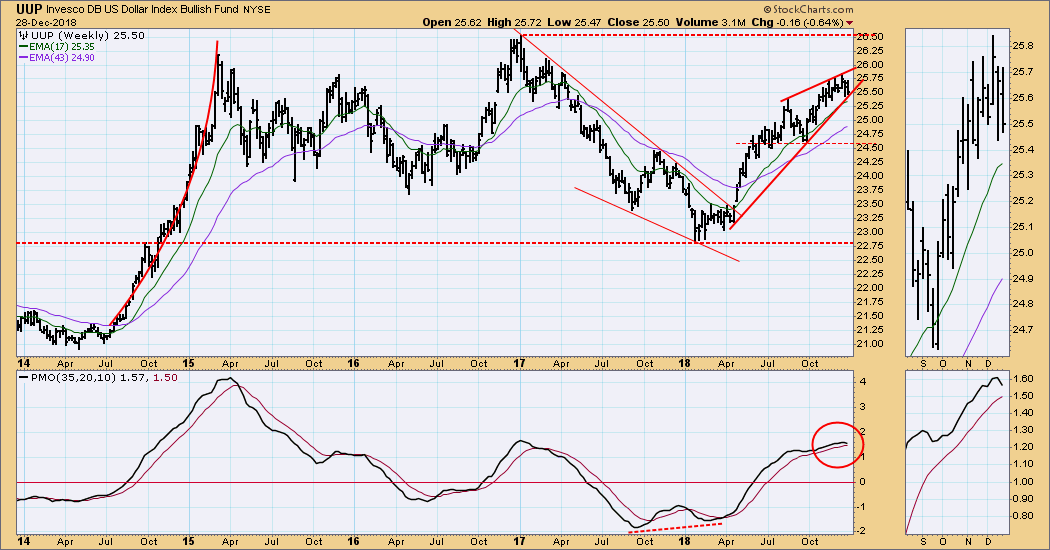
UUP Weekly Chart: The rising wedge is still prominent in this longer time frame. The weekly PMO has topped, favoring a bearish resolution.
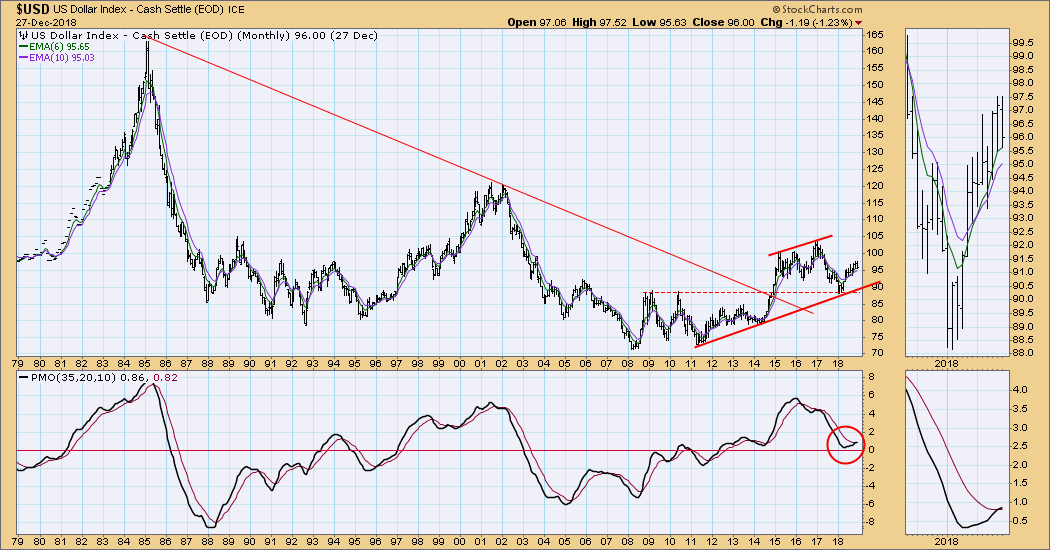
$USD Monthly Chart: The monthly PMO has crossed up through the signal line, but it has definitely decelerated. Correction probable.
GOLD
IT Trend Model: BUY as of 10/19/2018
LT Trend Model: SELL as of 6/22/2018
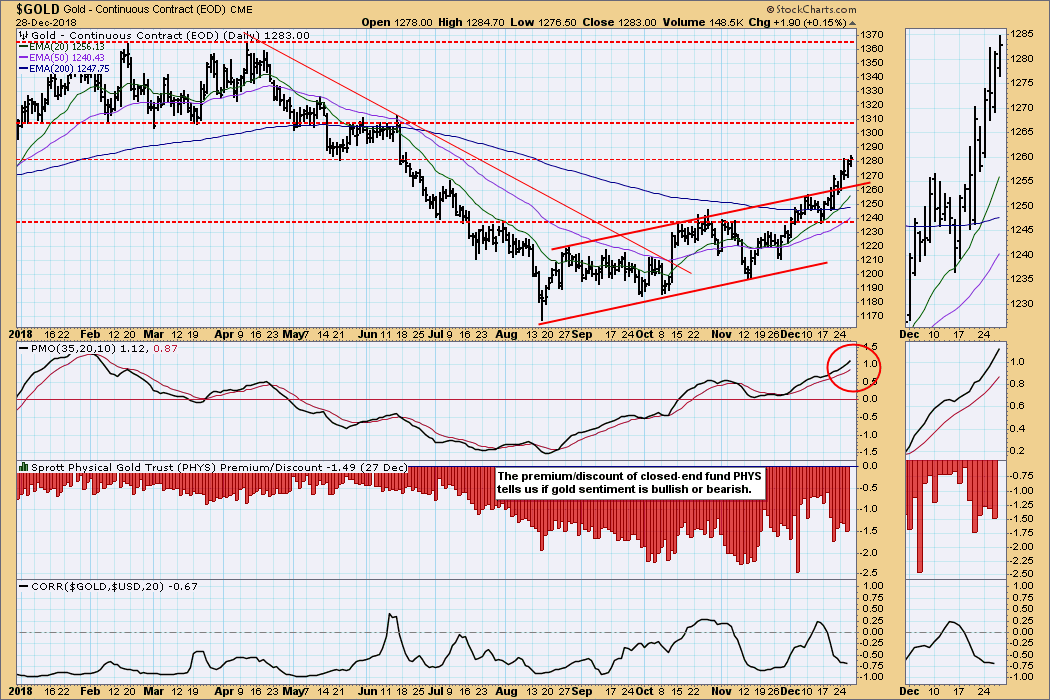
GOLD Daily Chart: Gold has broken out of a rising trend channel, and the daily PMO is positive in every way. The advance from the November low is a bit steeper than that to which we have become accustomed, so a small correction may be in the cards. However, the dollar is looking weak, and we can expect gold to benefit.
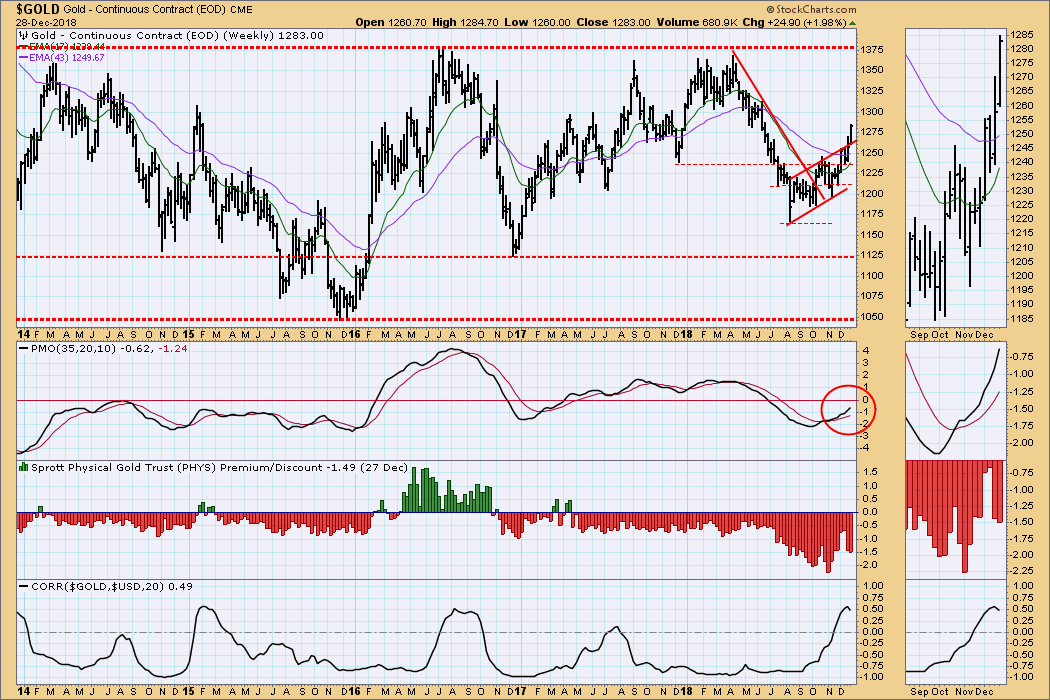
GOLD Weekly Chart: I have been tentatively interpreting the rising trend formation (from the August low) as a bearish reverse flag, but this week's breakout is quite bullish.
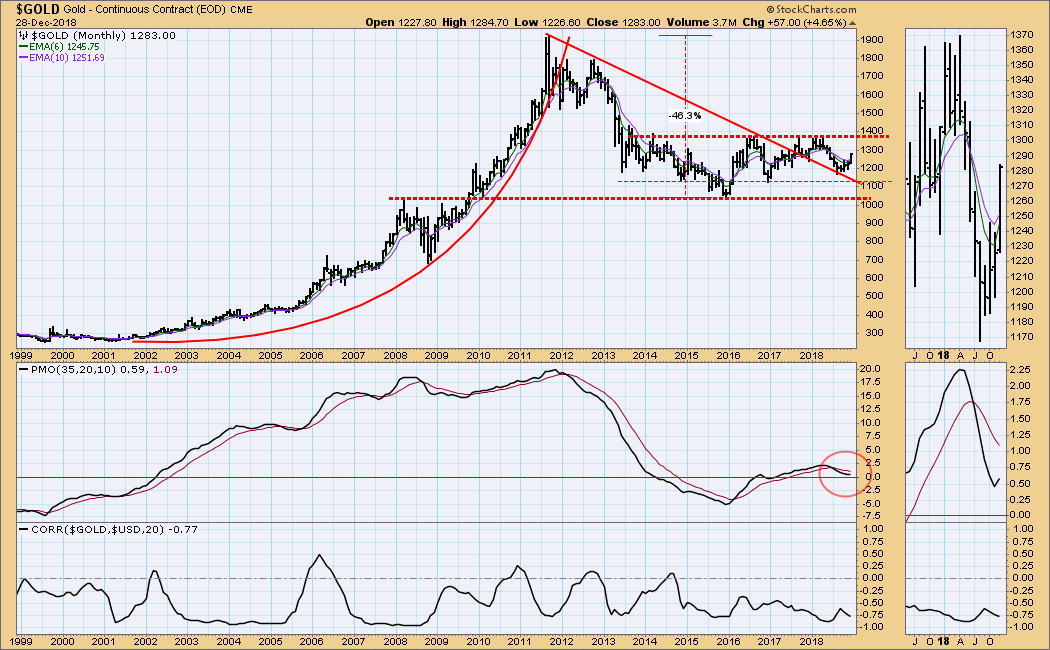
$GOLD Monthly Chart: Gold remains in a five year trading range. Note that it turned up before it reached the bottom of the range, which is bullish. The monthly PMO turned up this month, and that is a very good sign.
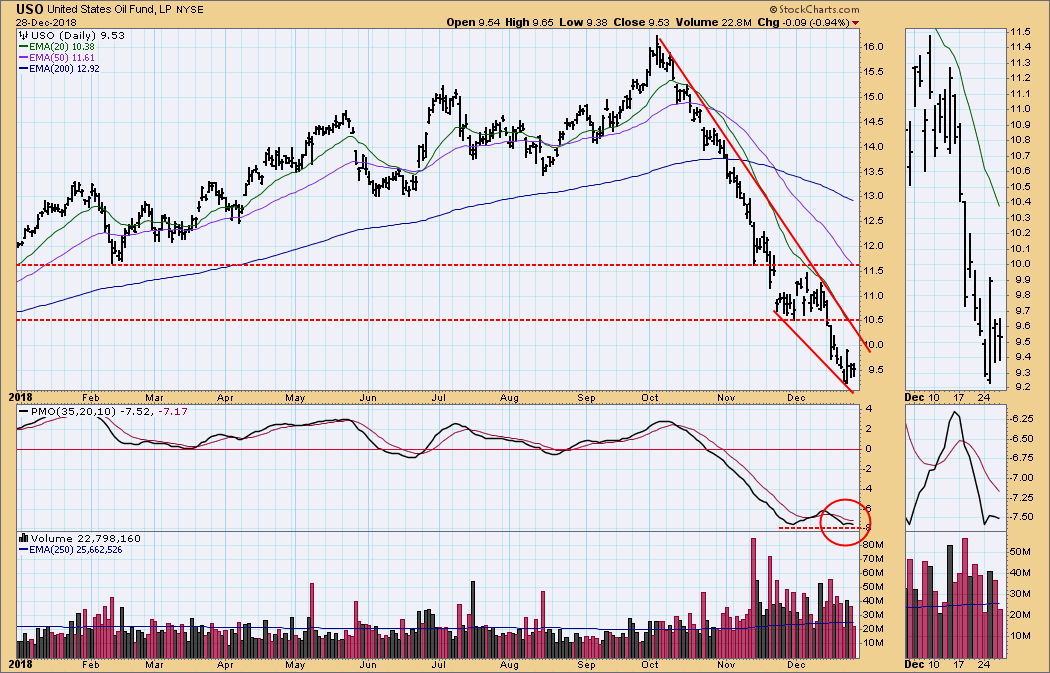
CRUDE OIL (USO)
IT Trend Model: NEUTRAL as of 10/29/2018
LT Trend Model: SELL as of 11/23/2018
USO Daily Chart: A falling wedge formation combined with a daily PMO positive divergence offers hope for a price bounce.
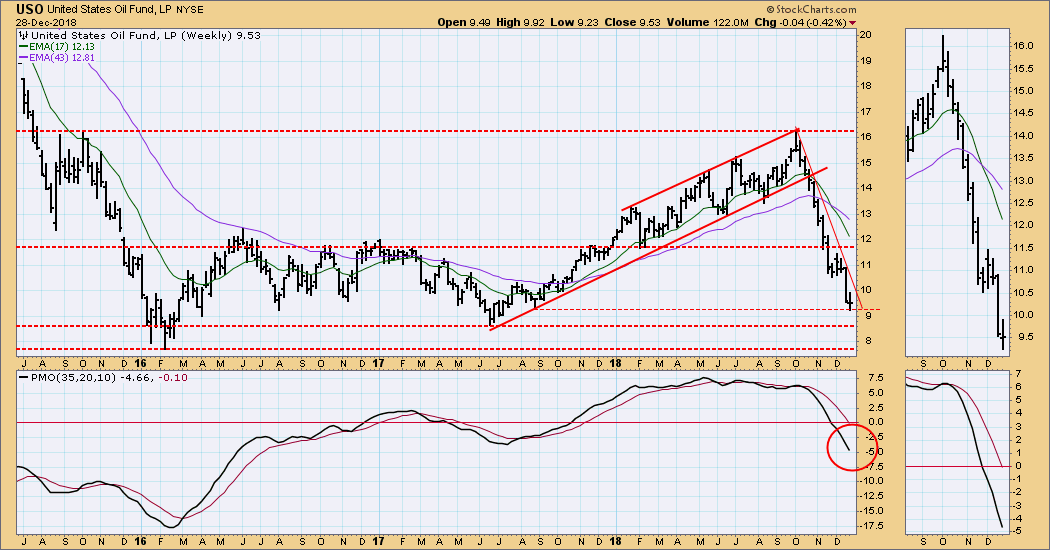
USO Weekly Chart: The next support for crude ($WTIC) is at 40.00, then 26.00, which is drawn across the 2016 low. For USO comparable levels are 8.50 and 7.75. I would not be surprised if the 2016 low is tested.
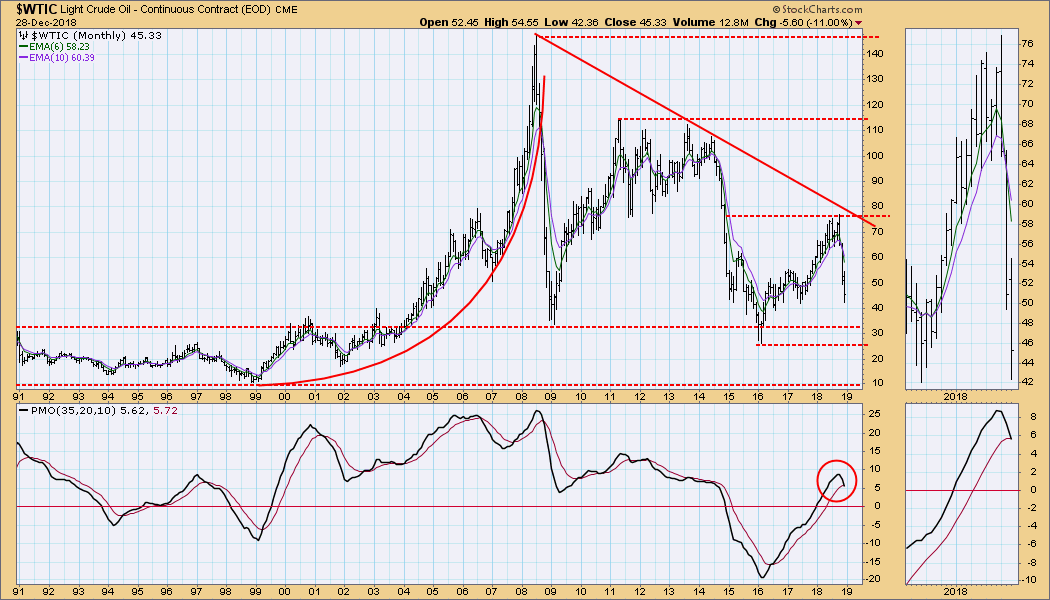
$WTIC Monthly Chart: The monthly PMO has topped and has crossed down through the signal line. The next long-term support line cuts through tops and bottoms, so it is hard to be precise. Based upon the weekly chart, I'll pick 26.00 as a favored target.
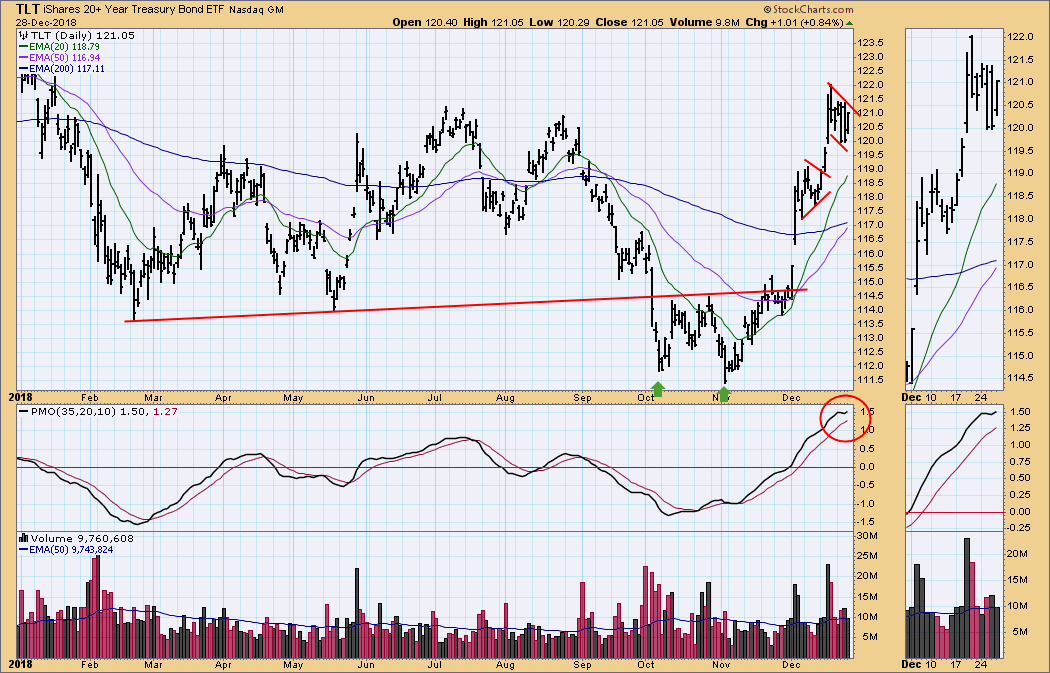
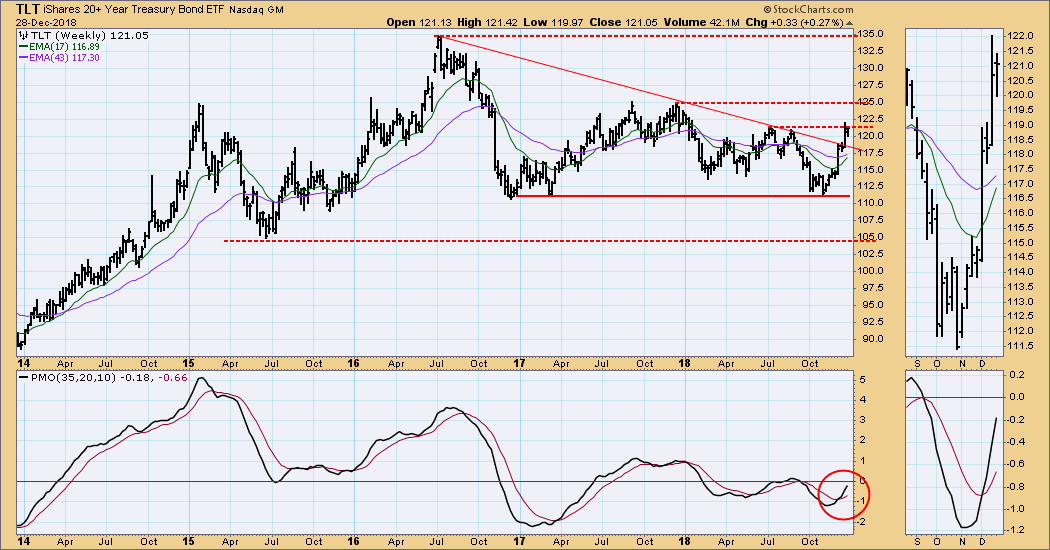
BONDS (TLT)
IT Trend Model: BUY as of 12/6/2018
LT Trend Model: SELL as of 9/18/2018
TLT Daily Chart: The break above the double bottom confirmation line has been followed by a sharp advance. There was a pennant formation, and now a flag. The daily PMO seems to be topping, so maybe the rally is near an end.
TLT Weekly Chart: The weekly PMO is positive (above the signal line and rising), but we can see obvious levels of resistance that must be overcome.
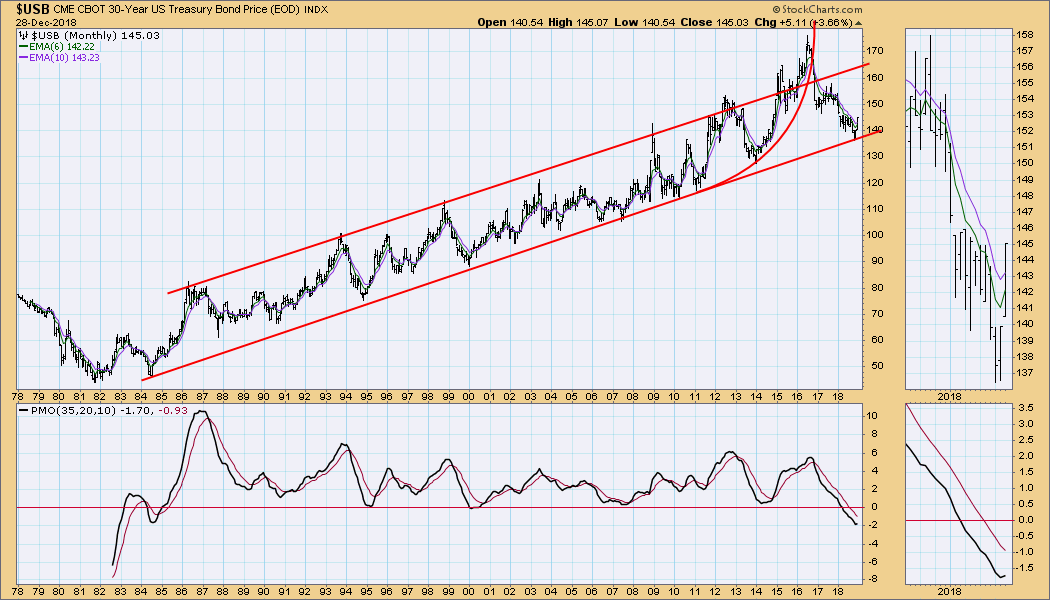
$USB Monthly Chart: Price has bounced off the long-term rising trend line, and the monthly PMO has bottomed. Although monthly PMO direction changes can sometimes be short-lived, I initially consider them to have long-term implications. In this case, I have to assume that bonds will be rallying for at least a couple of months. Best case, price could reach the top of the rising trend channel in a year or two.
**Don't miss any of the DecisionPoint commentaries! Go to the "Notify Me" box toward the end of this blog page to be notified as soon as they are published.**
Technical Analysis is a windsock, not a crystal ball.
Happy Charting!
- Carl
NOTE: The signal status reported herein is based upon mechanical trading model signals, specifically, the DecisionPoint Trend Model. They define the implied bias of the price index based upon moving average relationships, but they do not necessarily call for a specific action. They are information flags that should prompt chart review. Further, they do not call for continuous buying or selling during the life of the signal. For example, a BUY signal will probably (but not necessarily) return the best results if action is taken soon after the signal is generated. Additional opportunities for buying may be found as price zigzags higher, but the trader must look for optimum entry points. Conversely, exit points to preserve gains (or minimize losses) may be evident before the model mechanically closes the signal.
Helpful DecisionPoint Links:
DecisionPoint Shared ChartList and DecisionPoint Chart Gallery
Price Momentum Oscillator (PMO)
Swenlin Trading Oscillators (STO-B and STO-V)


