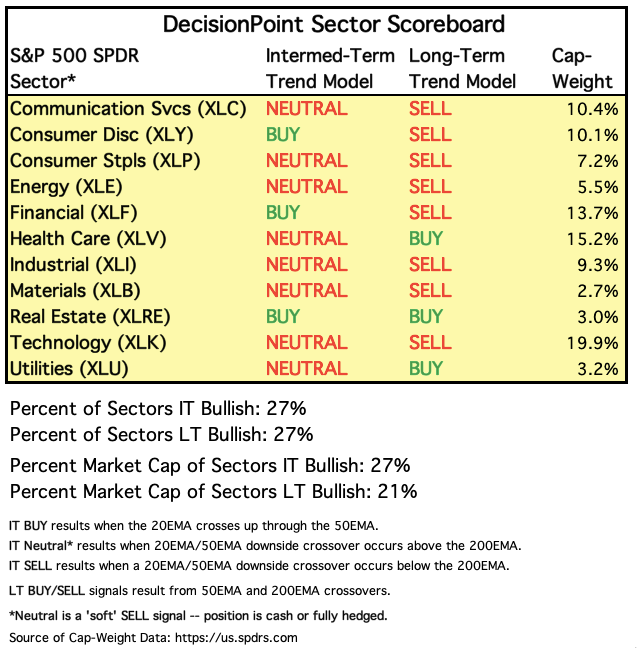
 The market rallied nicely this morning. It started by pulling back slightly, before the less hawkish announcement that came out of the FOMC resulted in the rally pushing higher. DecisionPoint Scoreboards point to short-term strength, with BUY signals in the short term. The IT Trend Model BUY signal became official on XLF.
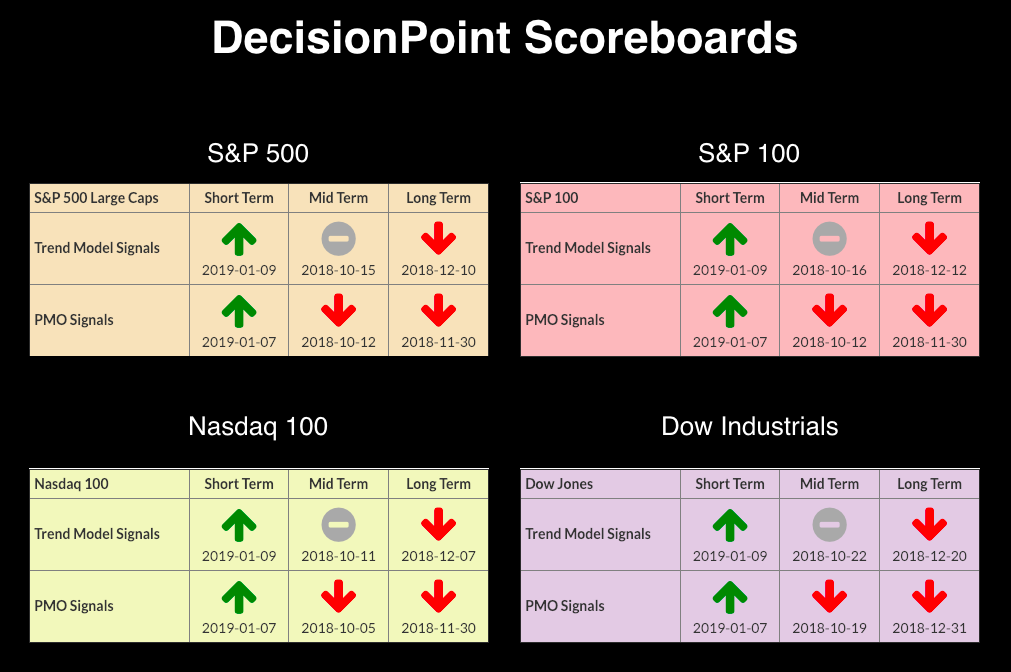
The DecisionPoint Alert presents a mid-week assessment of the trend and condition of the stock market (S&P 500), the U.S. Dollar, Gold, Crude Oil and Bonds.
Watch the latest episode of DecisionPoint on StockCharts TV's YouTube channel here!
SECTORS
Each S&P 500 Index component stock is assigned to one (and only one) of eleven major sectors. This is a snapshot of the Intermediate-Term and Long-Term Trend Model signal status for those sectors.
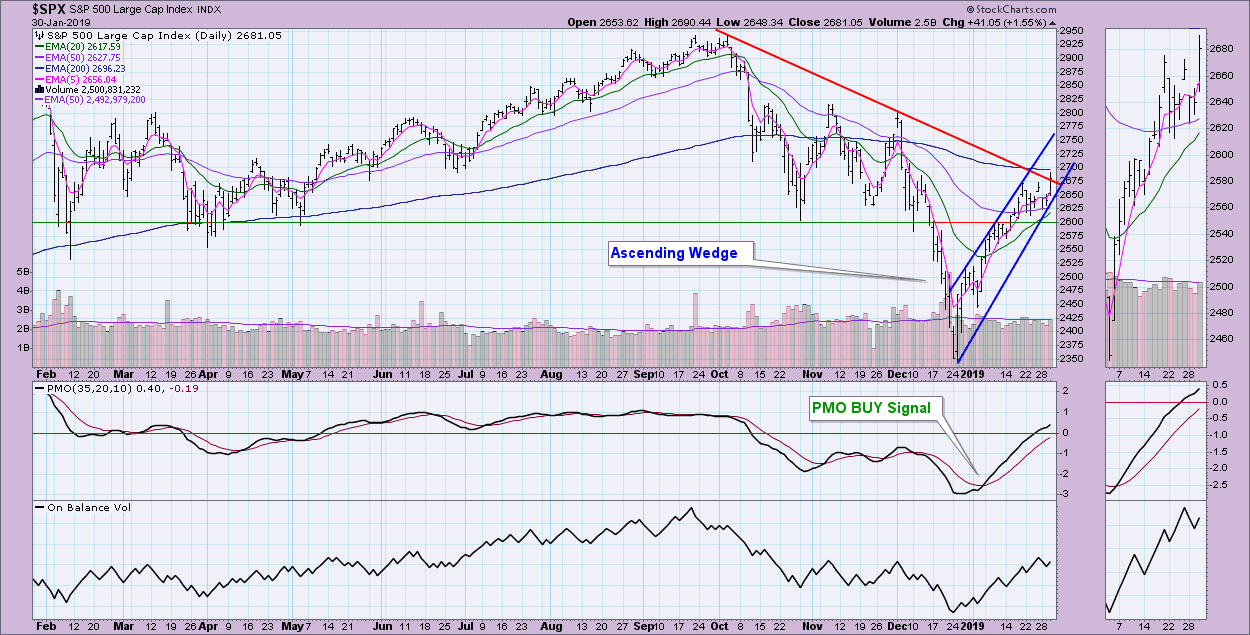
STOCKS
IT Trend Model: Neutral as of 10/15/2018
LT Trend Model: SELL as of 12/14/2018
SPY Daily Chart: I redrew the rising bottoms trend line yet again to capture this week's low. I nearly decided to copy that trend line and affix it to make it a rising trend channel, but ultimately I believe the wedge is the proper annotation. Price is just about ready to break the declining trend. I propose that overhead resistance at the 200-EMA and the declining trend line will likely be too much and the bearish rising wedge will execute.
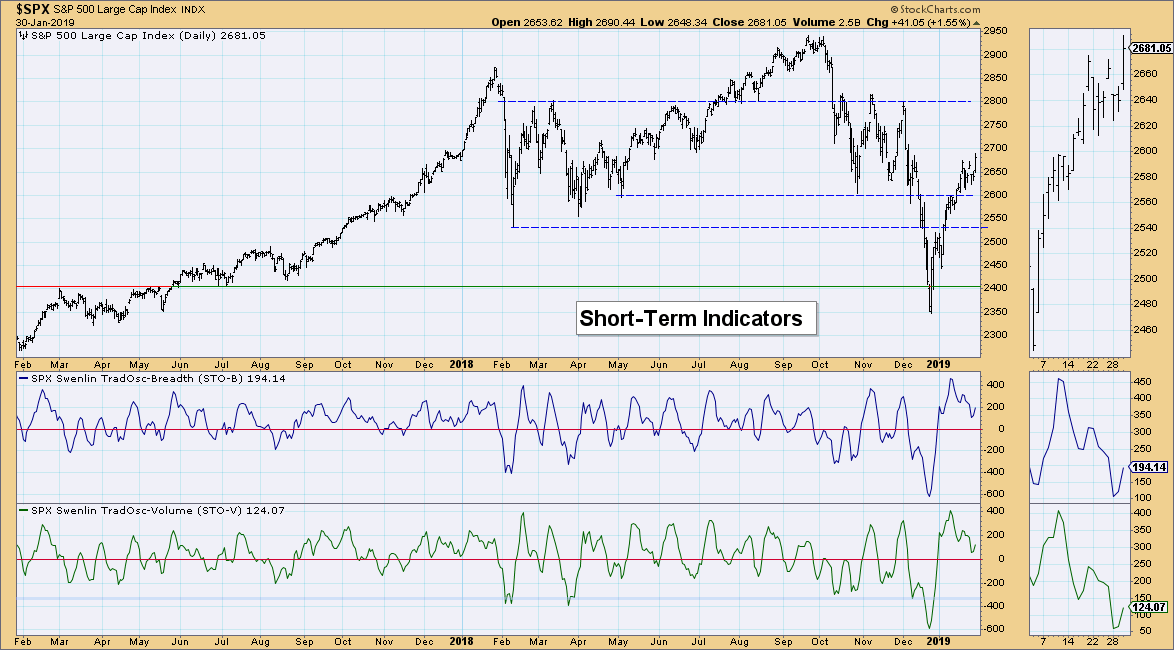
Climactic Market Indicators: We received climactic readings today to the upside. In the very short term, it does seem that we have a buying initiation. The VIX needs to see lower readings to puncture the upper Bollinger Band and this small initiation might just do the trick. Once we see that, I'll be looking for lower prices.
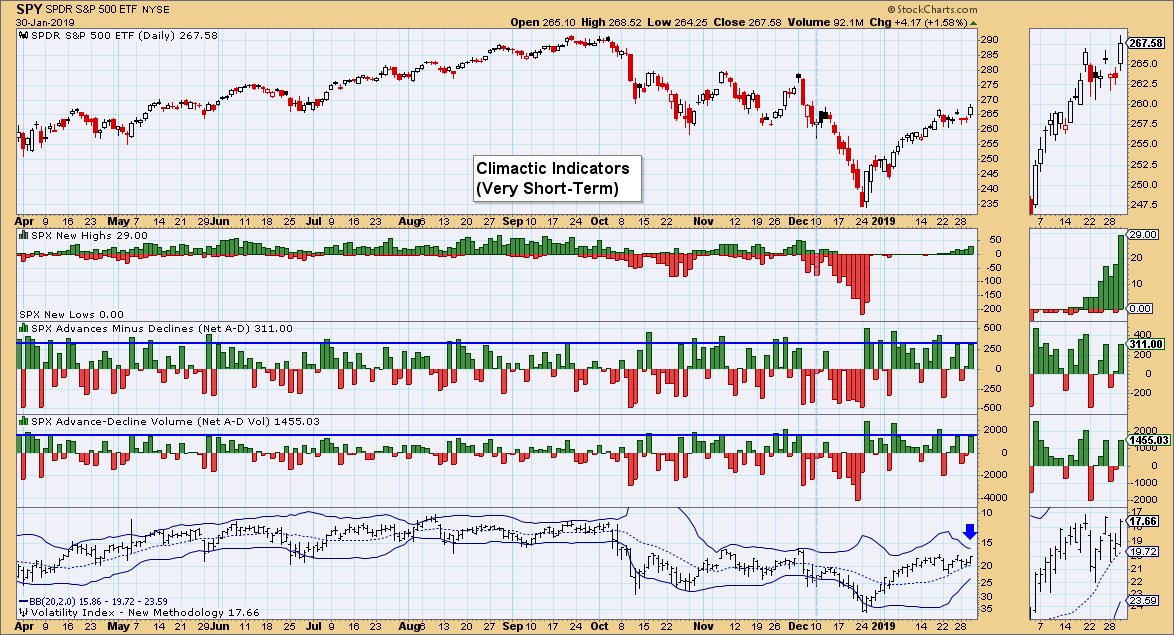
Short-Term Market Indicators: All of these have turned up above the zero line, which is bullish, but the declining trend remains in effect.
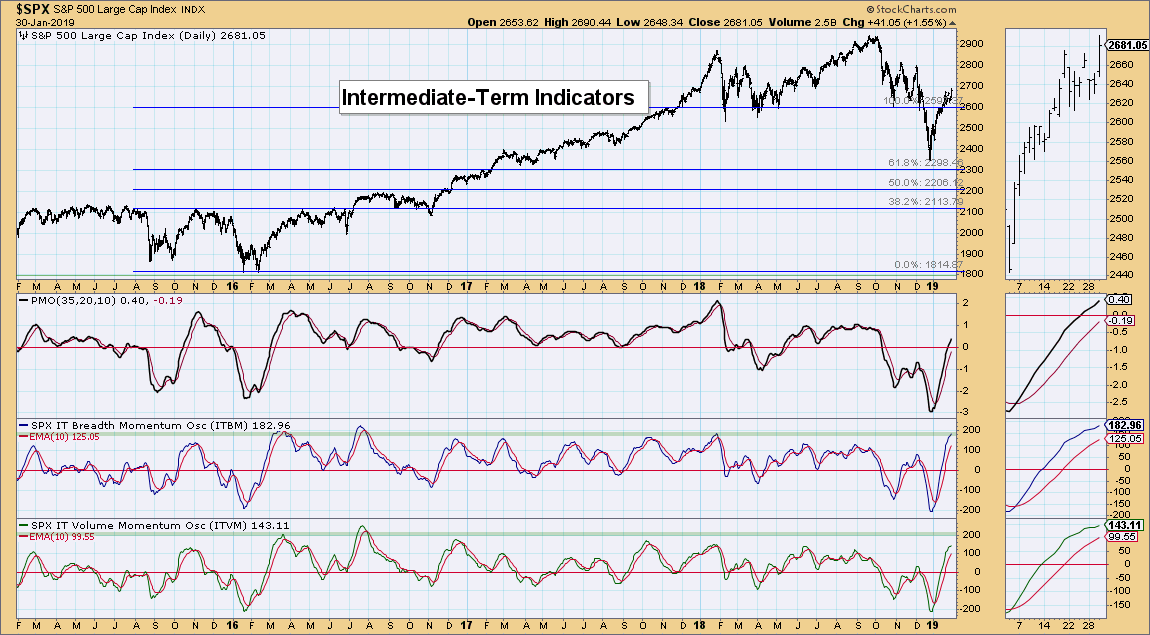
Intermediate-Term Market Indicators: These indicators are overbought and suggest lower prices could arrive soon.
Conclusion: It's still messy out there. I'm still not convinced the bear market is over. Tom Bowley mentioned on MarketWatchers LIVE that companies have been lowering the forecasts and expectations going into this quarter. I think that could be a precursor to lower prices in the intermediate term, which makes sense given the overbought IT indicators.
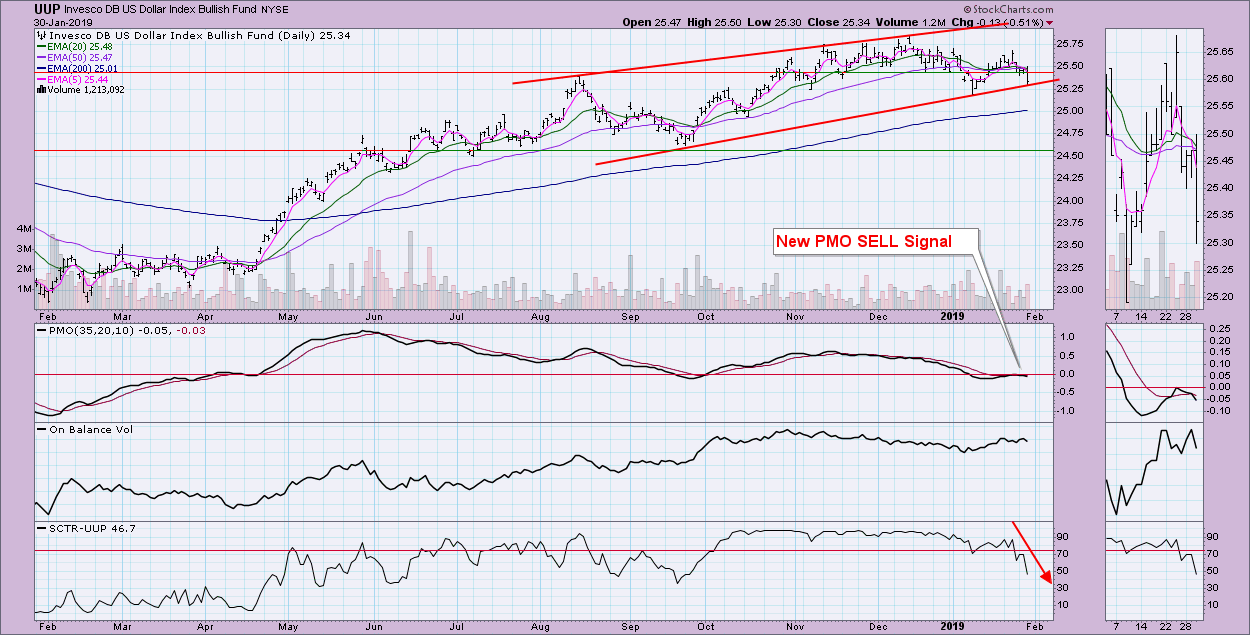
DOLLAR (UUP)
IT Trend Model: BUY as of 4/24/2018
LT Trend Model: BUY as of 5/25/2018
UUP Daily Chart: The Dollar managed a PMO BUY signal, but it whipsawed right back to a SELL today. The decline was deep, but the rising bottoms is holding. We are looking at a very large bearish rising wedge and the PMO turned down below the zero line. Look for a breakdown of the wedge.
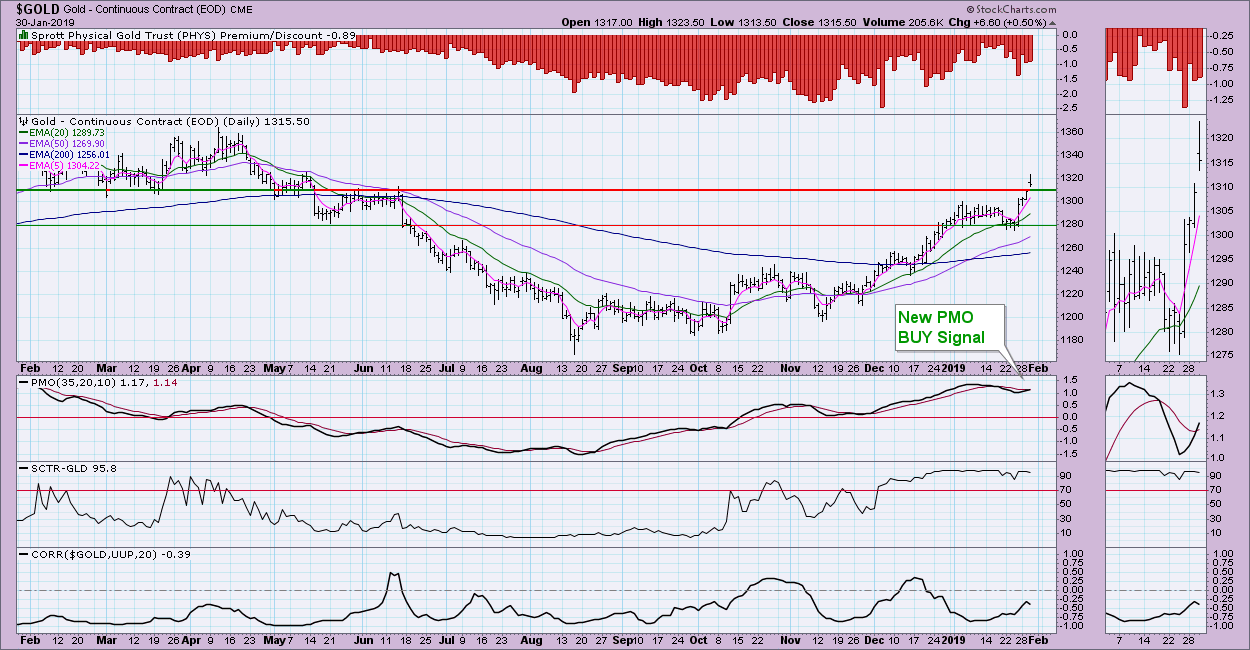
GOLD
IT Trend Model: BUY as of 10/19/2018
LT Trend Model: SELL as of 6/22/2018
GOLD Daily Chart: Gold has been on fire this week. Today, we saw a gap up that easily busted through overhead resistance. My only concern is a possible island, which would imply price will fall back down to close the gap and test 1280 once again.
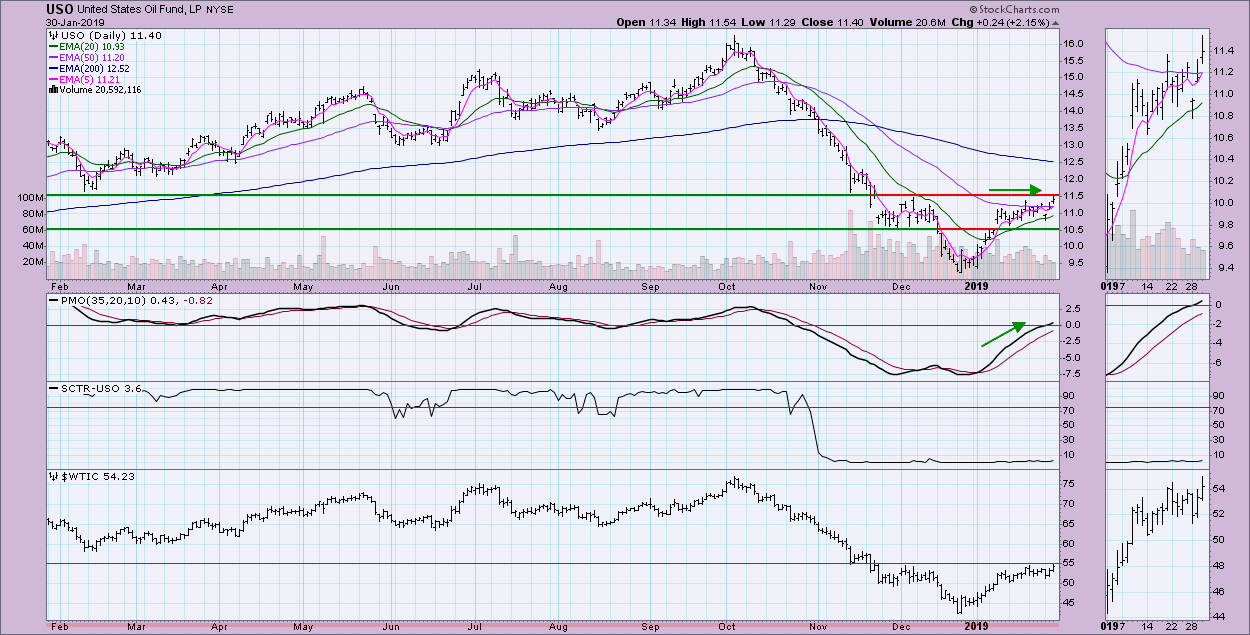
CRUDE OIL (USO)
IT Trend Model: Neutral as of 10/29/2018
LT Trend Model: SELL as of 11/23/2018
USO Daily Chart: Oil is working on a breakout. I have to say that, while it isn't textbook, I do see potential for a reverse head and shoulders. That suggests a breakout above $11.50 for USO and $55 for $WTIC. The PMO is now in positive territory. The SCTR is terrible but not surprising, given the steady decline that began in October.
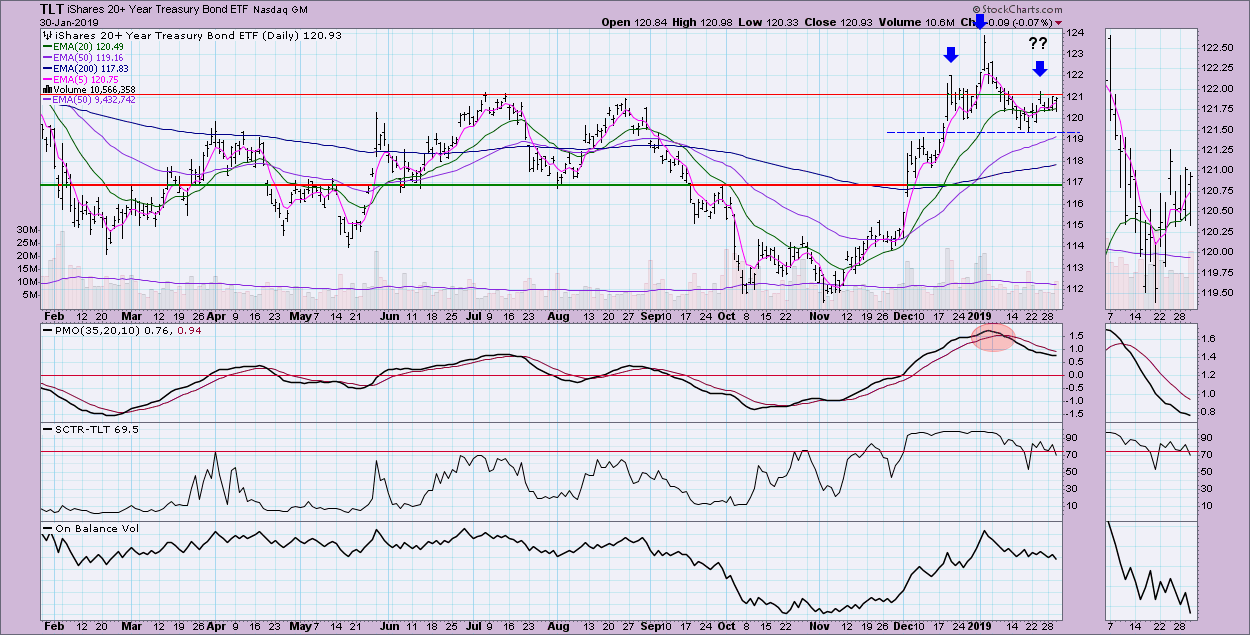
BONDS (TLT)
IT Trend Model: BUY as of 12/6/2018
LT Trend Model: BUY as of 1/2/2019
TLT Daily Chart: Today on MarketWatchers LIVE, Tom and I debated what we would do with TLT. Amazingly, we agreed(!) - both of us see lower prices for bonds. While they are generally a safe haven in troubled markets, the fact that yields are rising means bonds will likely break down. I see a possible head and shoulders coming together if price has a failed breakout.
Technical Analysis is a windsock, not a crystal ball.
Happy Charting!
- Erin
**Don't miss any of the DecisionPoint commentaries! Go to the "Notify Me" box toward the end of this blog page to be notified as soon as they are published.**
NOTE: The signal status reported herein is based upon mechanical trading model signals, specifically, the DecisionPoint Trend Model. These define the implied bias of the price index based upon moving average relationships, but they do not necessarily call for a specific action. They are information flags that should prompt chart review. Further, they do not call for continuous buying or selling during the life of the signal. For example, a BUY signal will probably (but not necessarily) return the best results if action is taken soon after the signal is generated. Additional opportunities for buying may be found as price zig-zags higher, but the trader must look for optimum entry points. Conversely, exit points to preserve gains (or minimize losses) may be evident before the model mechanically closes the signal.
Helpful DecisionPoint Links:
DecisionPoint Shared ChartList and DecisionPoint Chart Gallery
Price Momentum Oscillator (PMO)
Swenlin Trading Oscillators (STO-B and STO-V)


