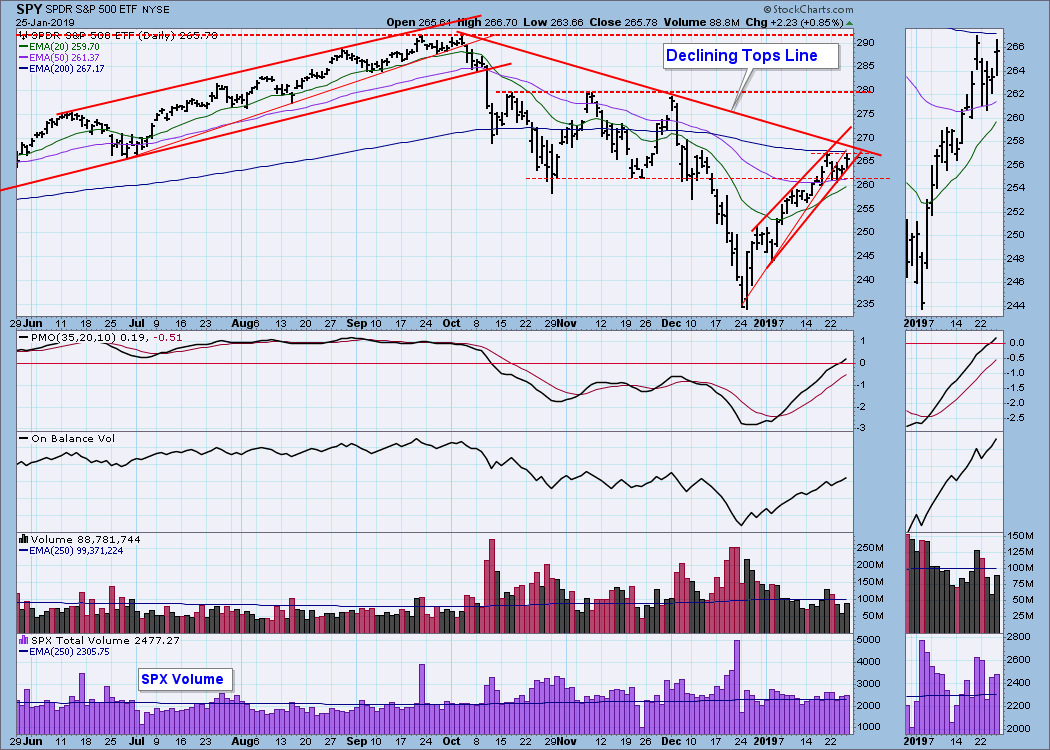
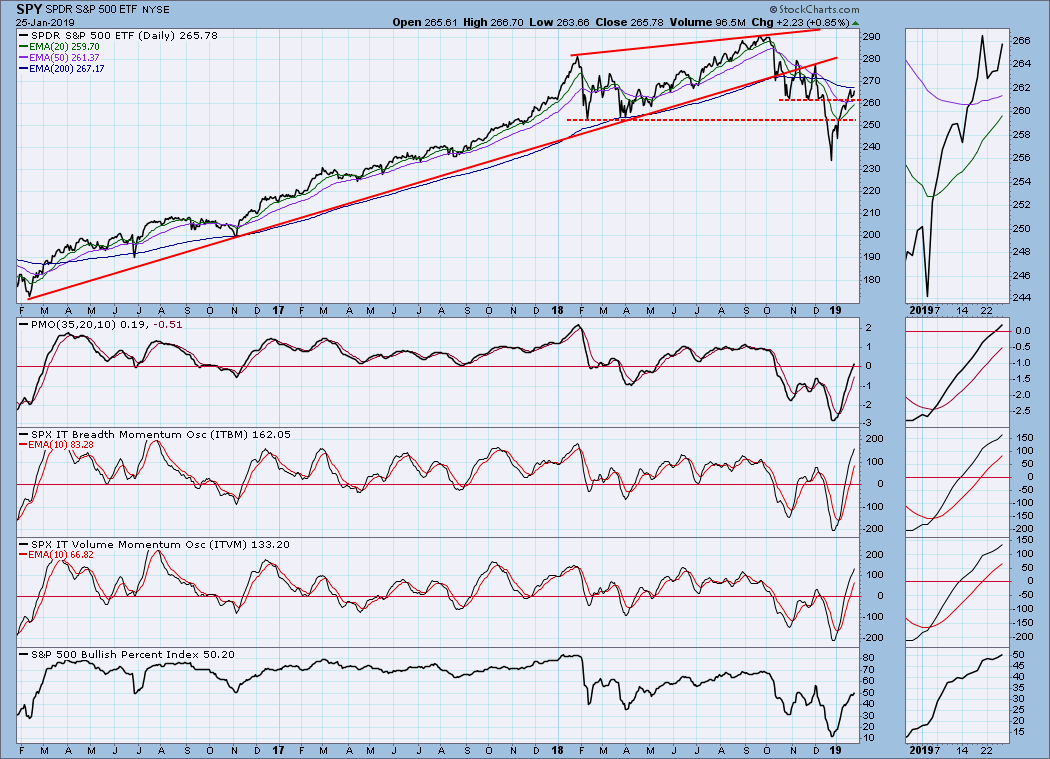
Last week we were focused on the SPY rising wedge formation, the technical expectation for which was that it would break down. Well, on Tuesday it did break down, but there was no follow through afterwards. Instead, it moved sideways for two days, then rallied on Friday, challenging Monday's highs. The result is that the wedge has almost transformed into a rising trend channel. I say "almost" because there is still a slight narrowing at the top of the channel. Nevertheless, of more immediate concern is the overhead resistance presented by the declining tops line drawn from the October top, which could force another rising trend line break.
The DecisionPoint Weekly Wrap presents an end-of-week assessment of the trend and condition of the stock market (S&P 500), the U.S. Dollar, Gold, Crude Oil, and Bonds.
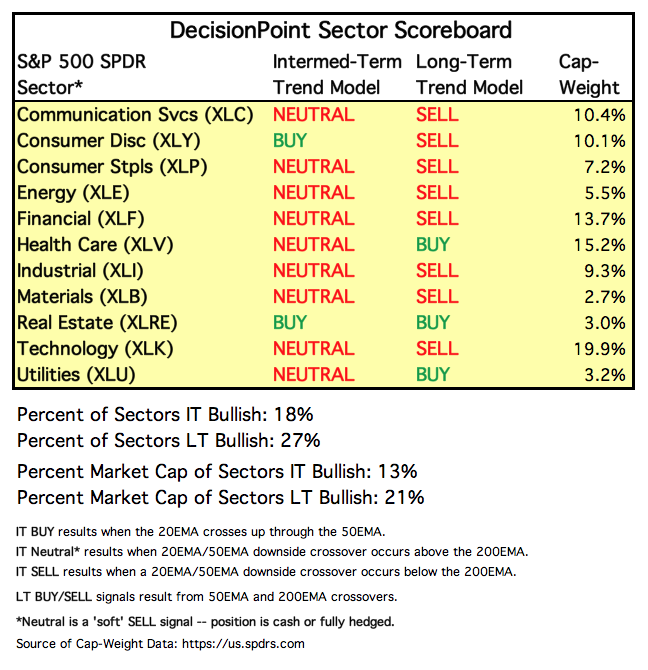
SECTORS
Each S&P 500 Index component stock is assigned to one, and only one, of 11 major sectors. This is a snapshot of the Intermediate-Term and Long-Term Trend Model signal status for those sectors.
STOCKS
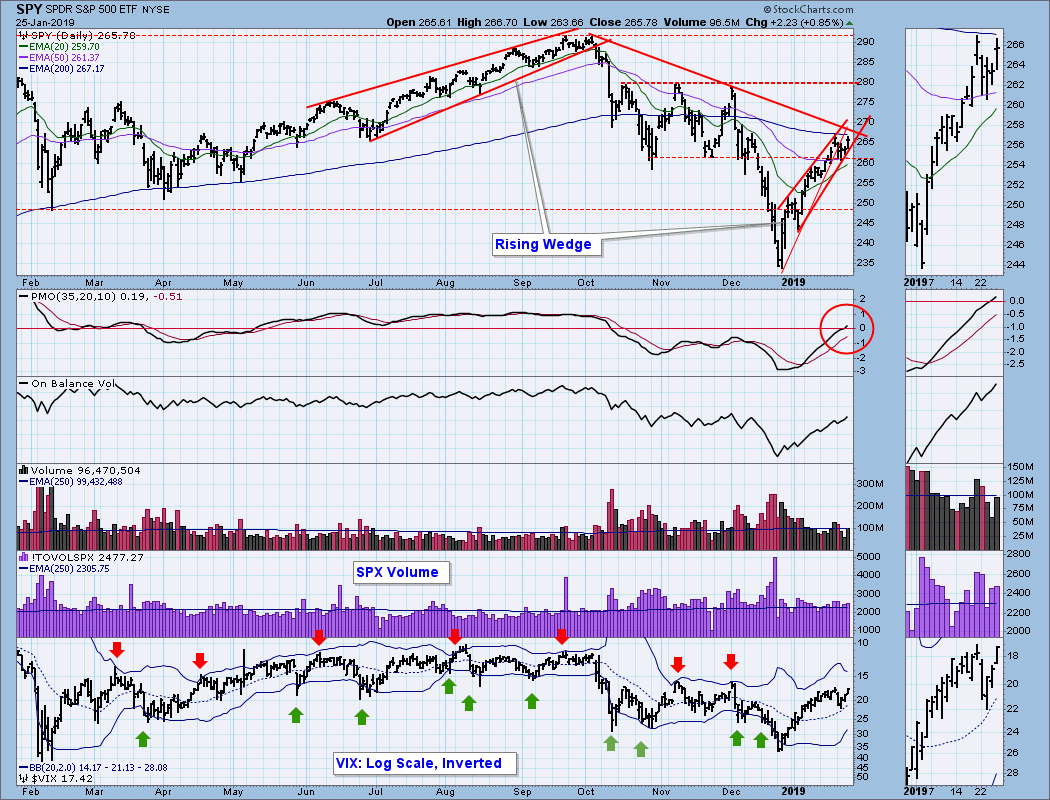
IT Trend Model: NEUTRAL as of 10/15/2018
LT Trend Model: SELL as of 12/14/2018
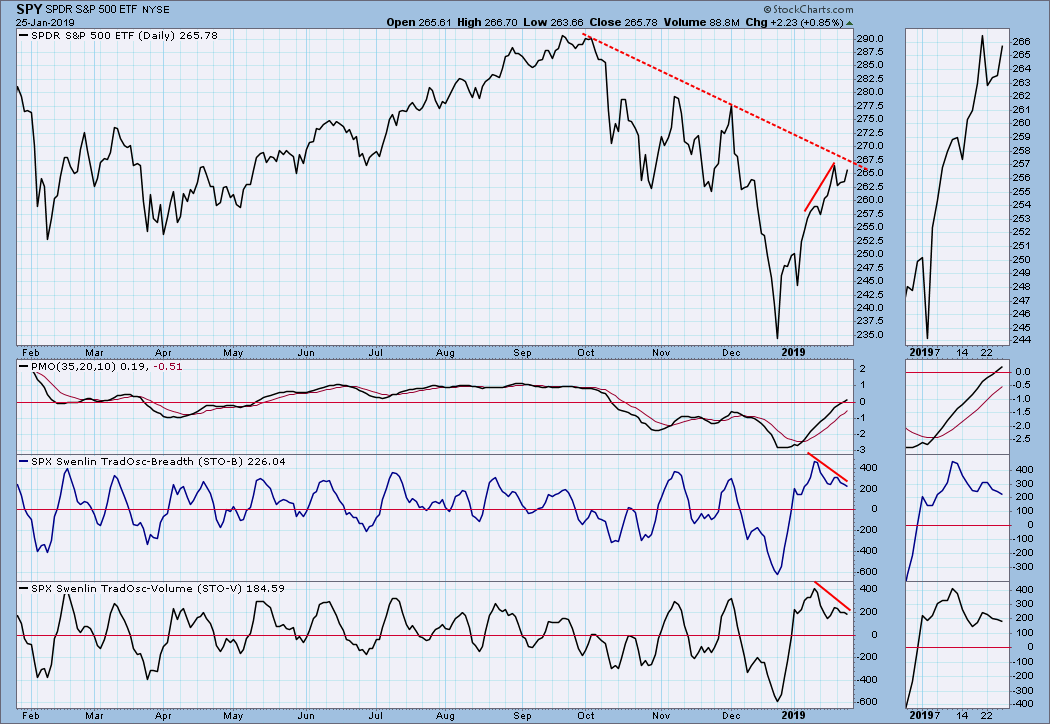
SPY Daily Chart: The narrowing toward the top of the rising wedge is more pronounced in this scale. That combined with the overhead resistance presented by the declining tops line infers that the rally could stall soon.
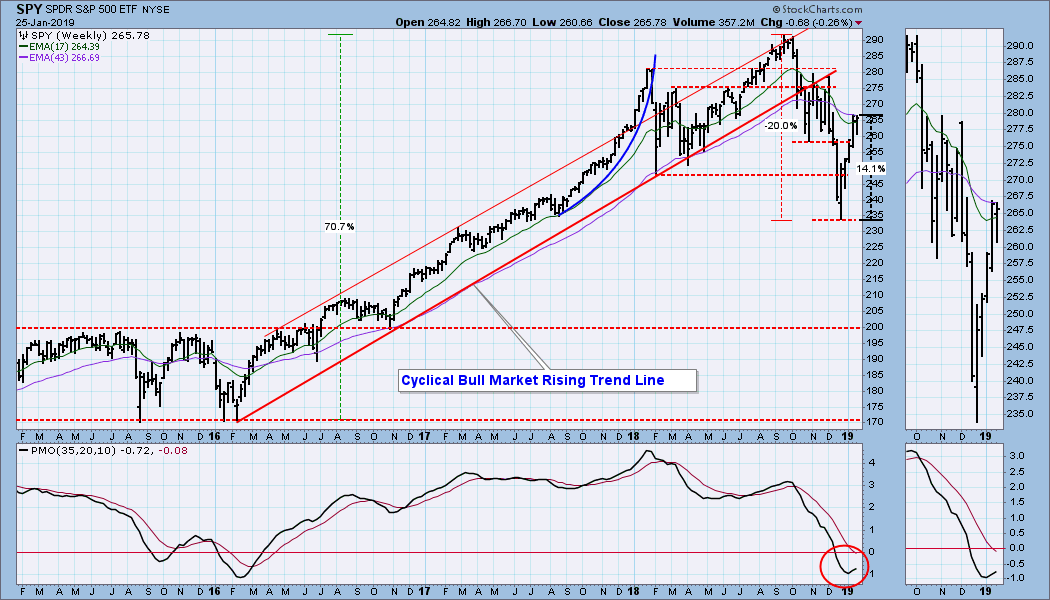
 SPY Weekly Chart: Little upside progress was made this week, but the weekly PMO is still rising. The market has rallied +14% from the December low, and it will take a total rally of about +25% for price to get back to the level of the all-time highs.
ULTRA-Short-Term Market Indicators: Net Advances-Declines and Net A-D Volume have been fading since their highs in December.
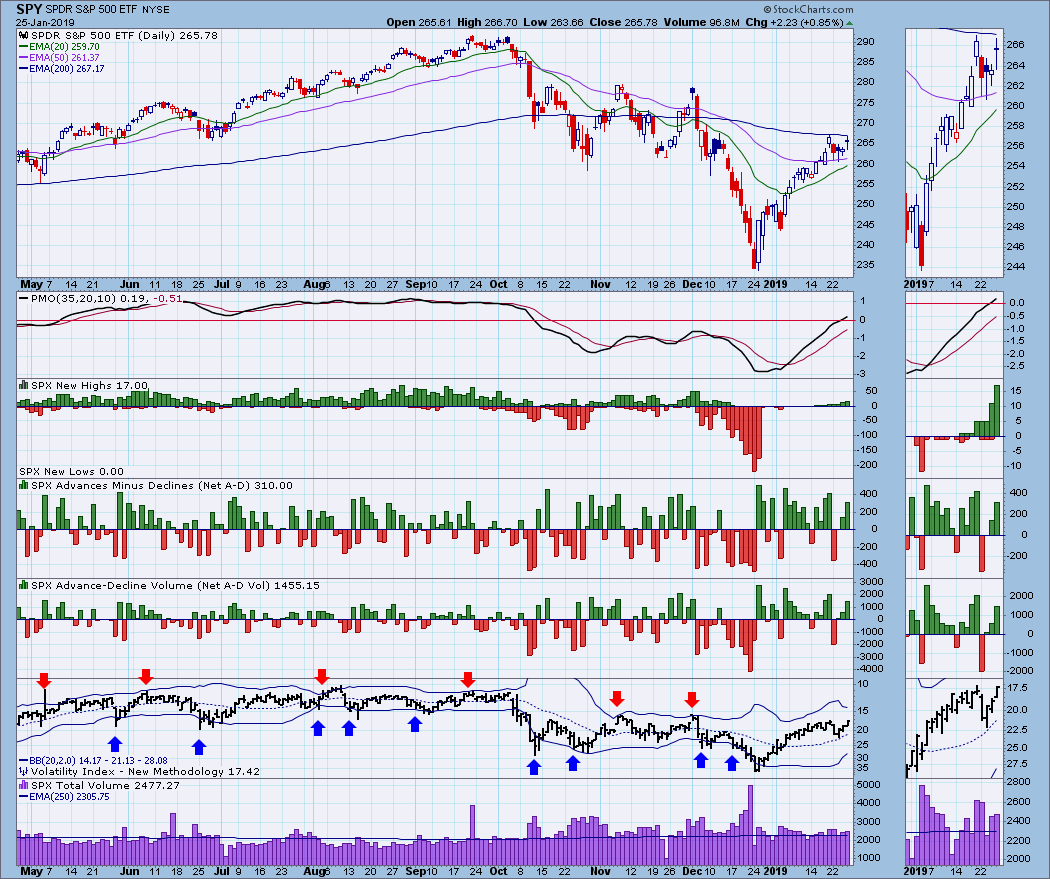
Short-Term Market Indicators: There were negative divergences on the STO-B and STO-V charts.
Intermediate-Term Market Indicators: The ITBM and ITVM are both very overbought at this point.
CONCLUSION: The Fed interest rate announcement will be on Wednesday next week. It seems to be widely believed that they will not raise rates, so I expect a rate increase to generate a negative market reaction. A 'no change' should get a positive market reaction, but not wildly positive or durable. Regardless, I will stick with my bearish outlook for the longer term, because I think the rally that began off this month's lows has about run its course. There is important resistance showing on the daily chart, and the intermediate-term indicators have become very overbought. That said, the market hasn't really shown any short-term weakness. The rising wedge breakdown wasn't dramatic, and price recovered quickly.
Join Carl and Erin as they Chart the Market LIVE each Friday 30 minutes after the close on StockCharts TV or replay the show on the YouTube StockCharts channel.
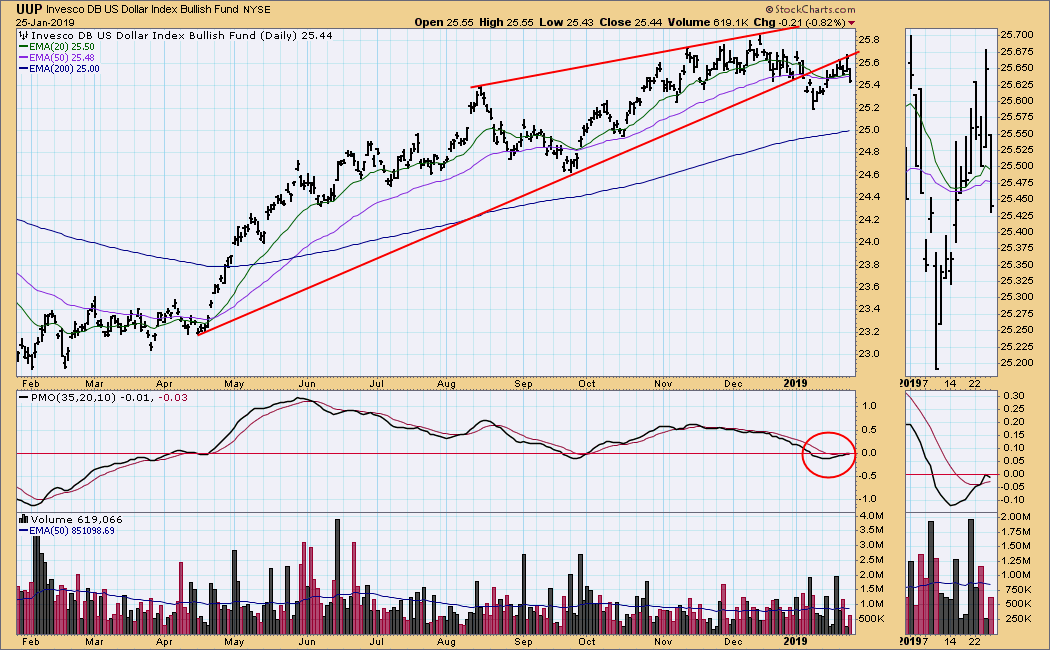
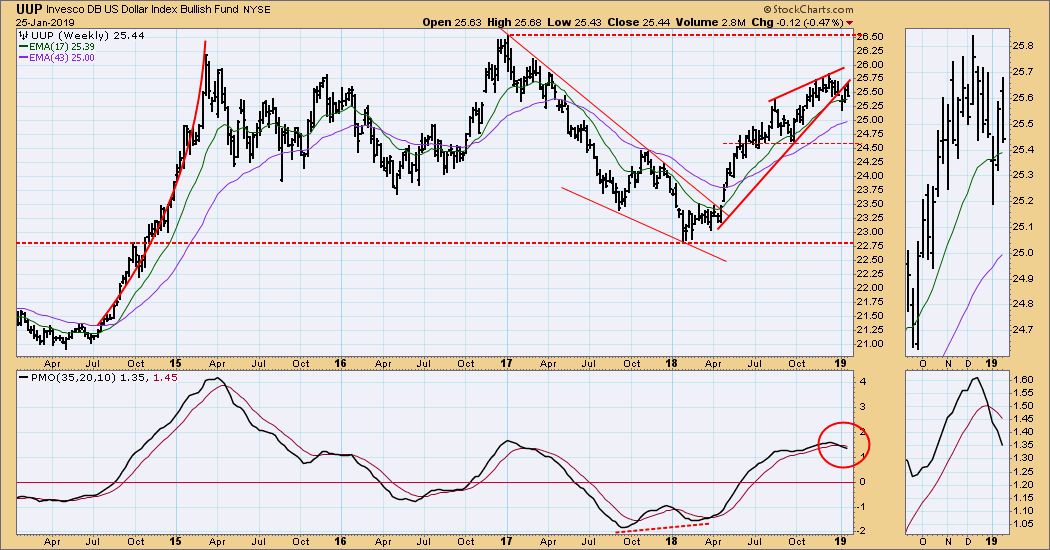
DOLLAR (UUP)
IT Trend Model: BUY as of 4/24/2018
LT Trend Model: BUY as of 5/25/2018
UUP Daily Chart: After breaking down from the rising wedge earlier this month, price rallied back to the rising trend line. On Friday it broke down again, causing the daily PMO to top abruptly. I anticipate continued weakness.
UUP Weekly Chart: The weekly PMO is below the signal line and falling. A negative outcome is implied.
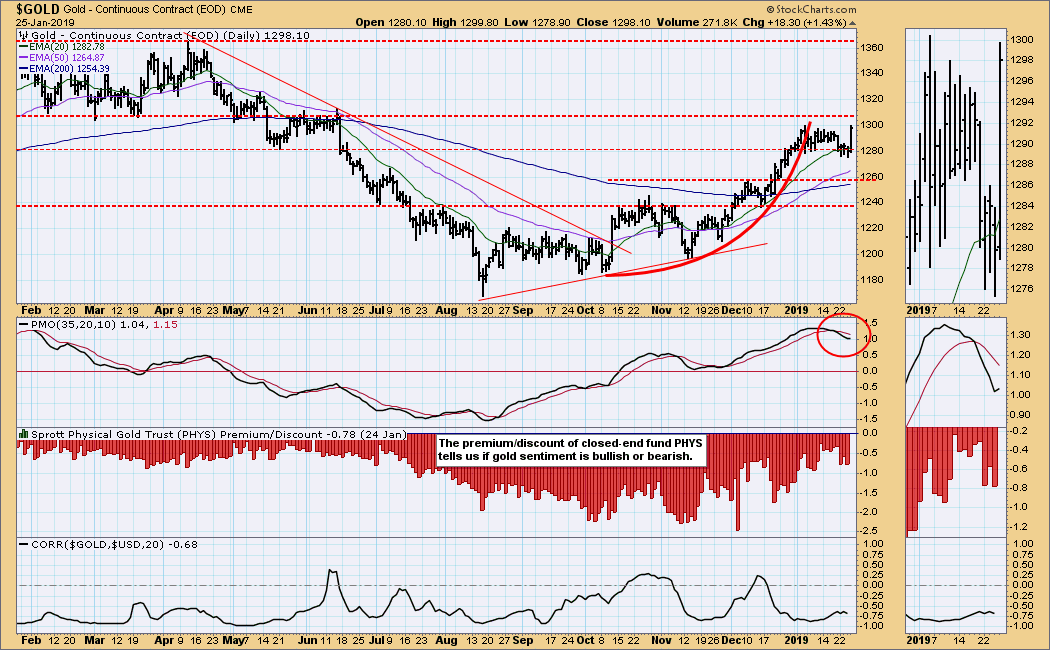
GOLD
IT Trend Model: BUY as of 10/19/2018
LT Trend Model: BUY as of 1/8/2019
GOLD Daily Chart: Gold had a small breakdown this week, but it consolidated around 1280 for three days, then broke back up to 1300. This potential recovery is thanks to weakness in the dollar. The daily PMO has turned up.
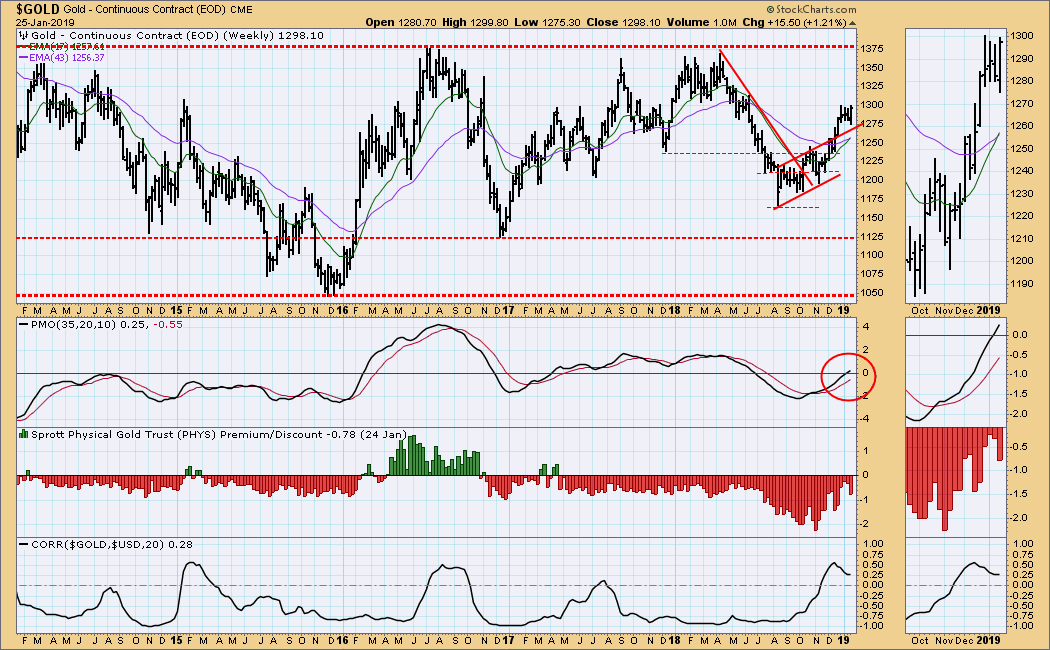
GOLD Weekly Chart: After the break out of the rising trend channel, gold pulled back toward the top of the channel. It seems to be resuming the rising trend. The weekly PMO looks great.
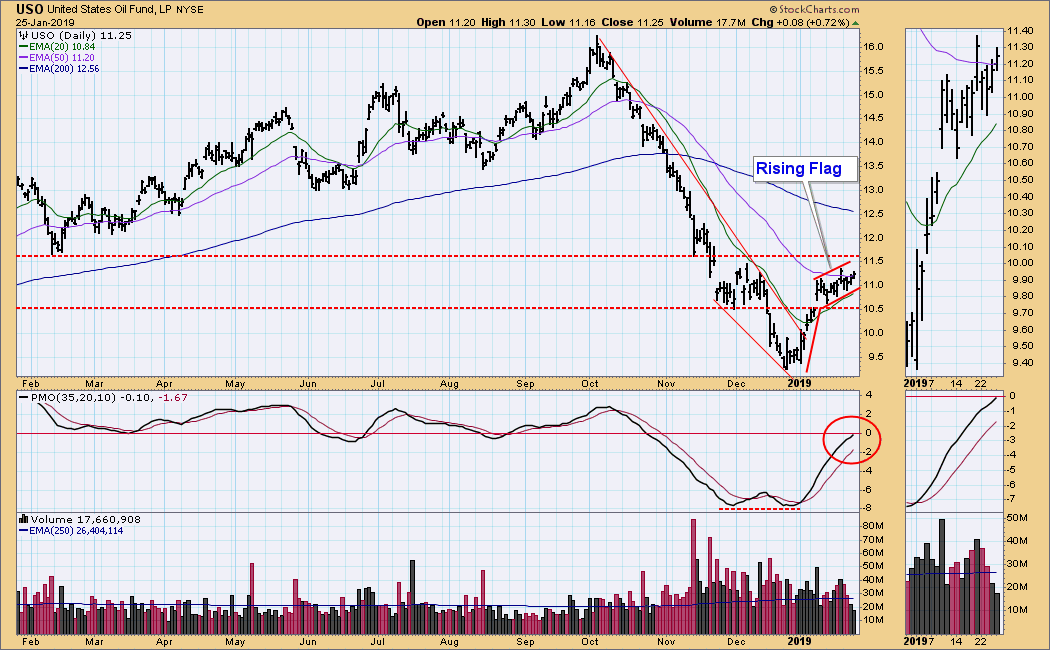
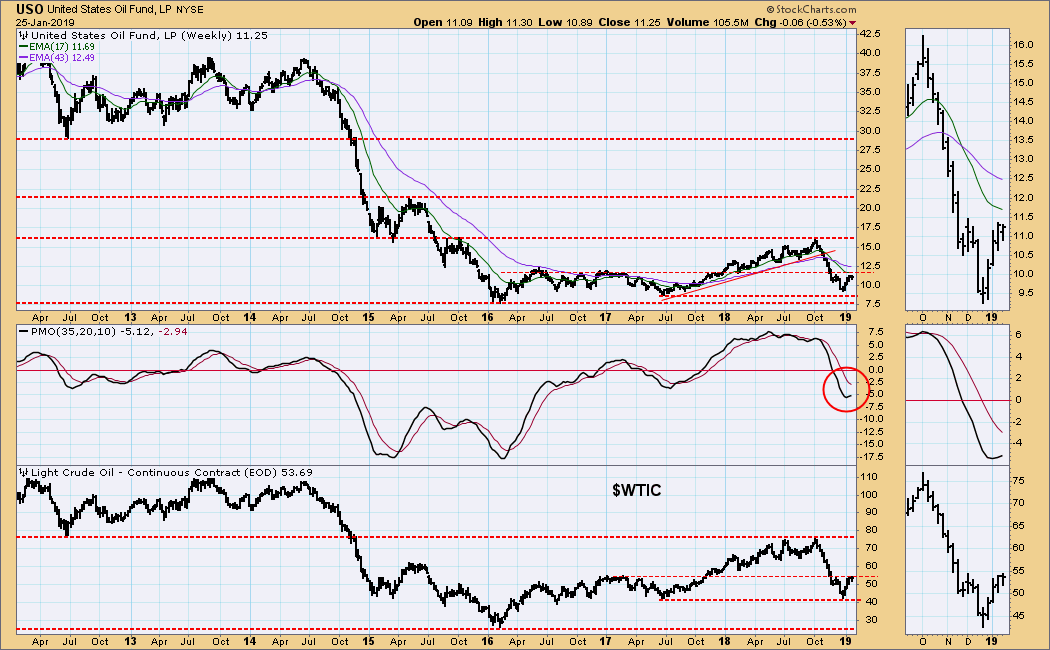
CRUDE OIL (USO)
IT Trend Model: NEUTRAL as of 10/29/2018
LT Trend Model: SELL as of 11/23/2018
USO Daily Chart: A rising flag has formed, which I expect to resolve downward. A move back toward 10.50 would be constructive, and then a rally resumption would give us a pretty tidy reverse head and shoulders with an upside target of about 13.50.
USO Weekly Chart: Crude ($WTIC) has run into resistance at $50, but it may be forming the right shoulder of a potential reverse head and shoulders pattern. The weekly PMO has bottomed, which is positive.
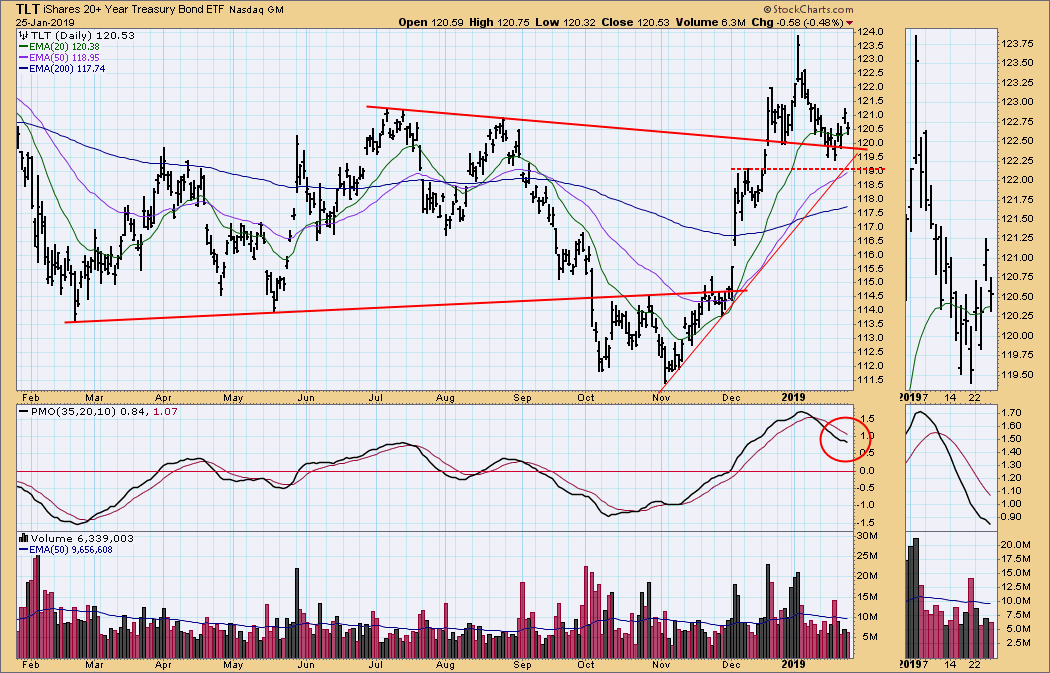
BONDS (TLT)
IT Trend Model: BUY as of 12/6/2018
LT Trend Model: BUY as of 1/2/2019
TLT Daily Chart: Price is chopping around above a declining tops line, a line which I admit, is composed of more whimsy than substance. But it does suggest the neckline of the developing head and shoulders pattern in December and January.
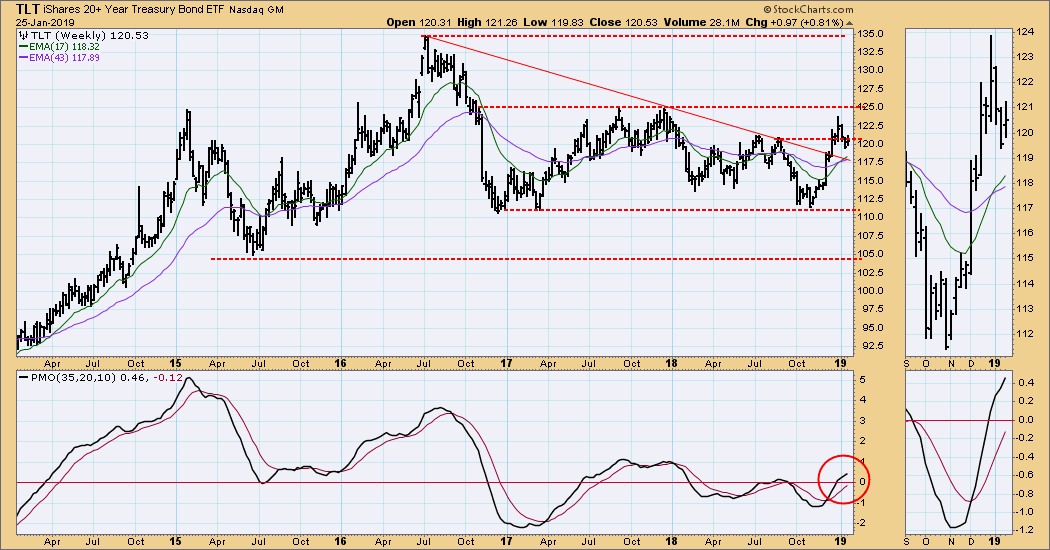
TLT Weekly Chart: Price has been in sideways channel for over two years. Expecting more of the same.
**Don't miss any of the DecisionPoint commentaries! Go to the "Notify Me" box toward the end of this blog page to be notified as soon as they are published.**
Technical Analysis is a windsock, not a crystal ball.
Happy Charting!
- Carl
NOTE: The signal status reported herein is based upon mechanical trading model signals, specifically, the DecisionPoint Trend Model. They define the implied bias of the price index based upon moving average relationships, but they do not necessarily call for a specific action. They are information flags that should prompt chart review. Further, they do not call for continuous buying or selling during the life of the signal. For example, a BUY signal will probably (but not necessarily) return the best results if action is taken soon after the signal is generated. Additional opportunities for buying may be found as price zigzags higher, but the trader must look for optimum entry points. Conversely, exit points to preserve gains (or minimize losses) may be evident before the model mechanically closes the signal.
Helpful DecisionPoint Links:
DecisionPoint Shared ChartList and DecisionPoint Chart Gallery
Price Momentum Oscillator (PMO)
Swenlin Trading Oscillators (STO-B and STO-V)


