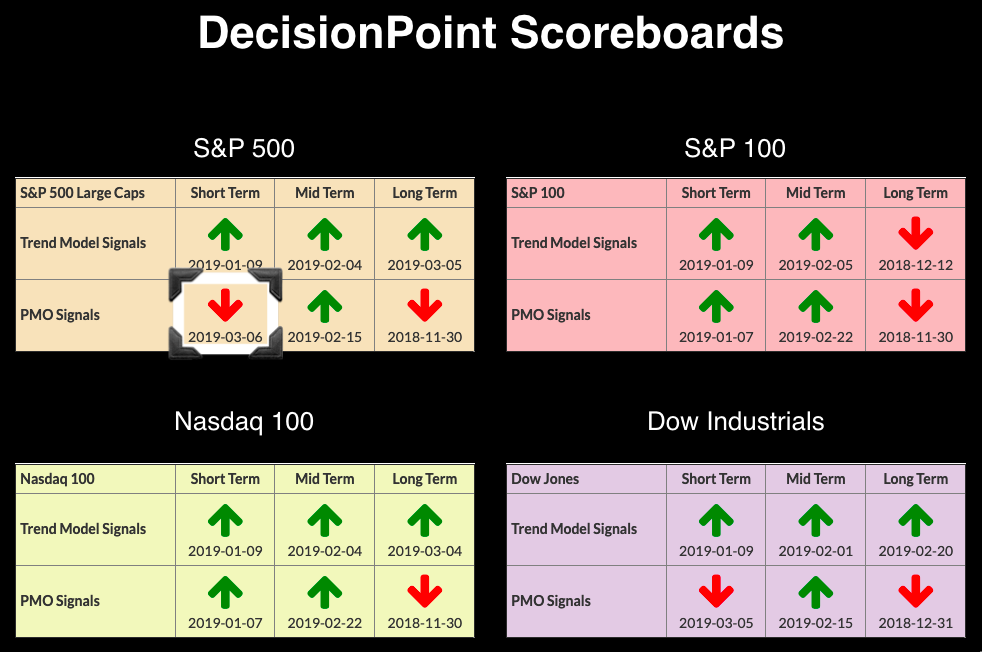
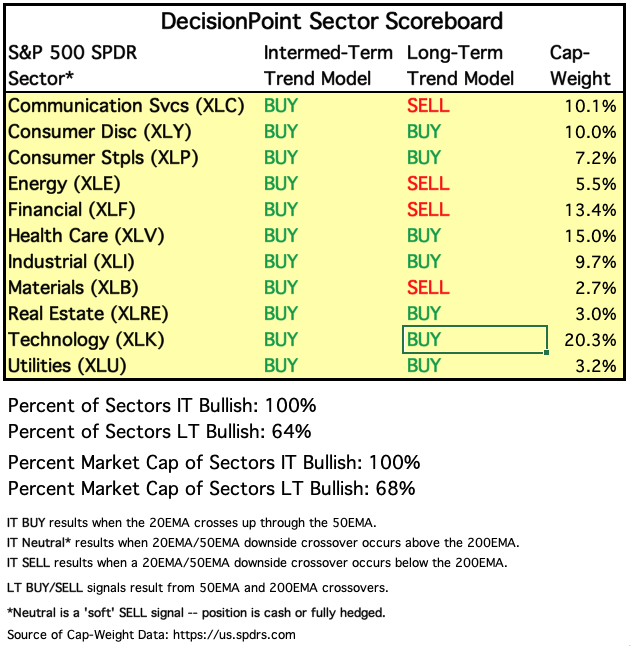
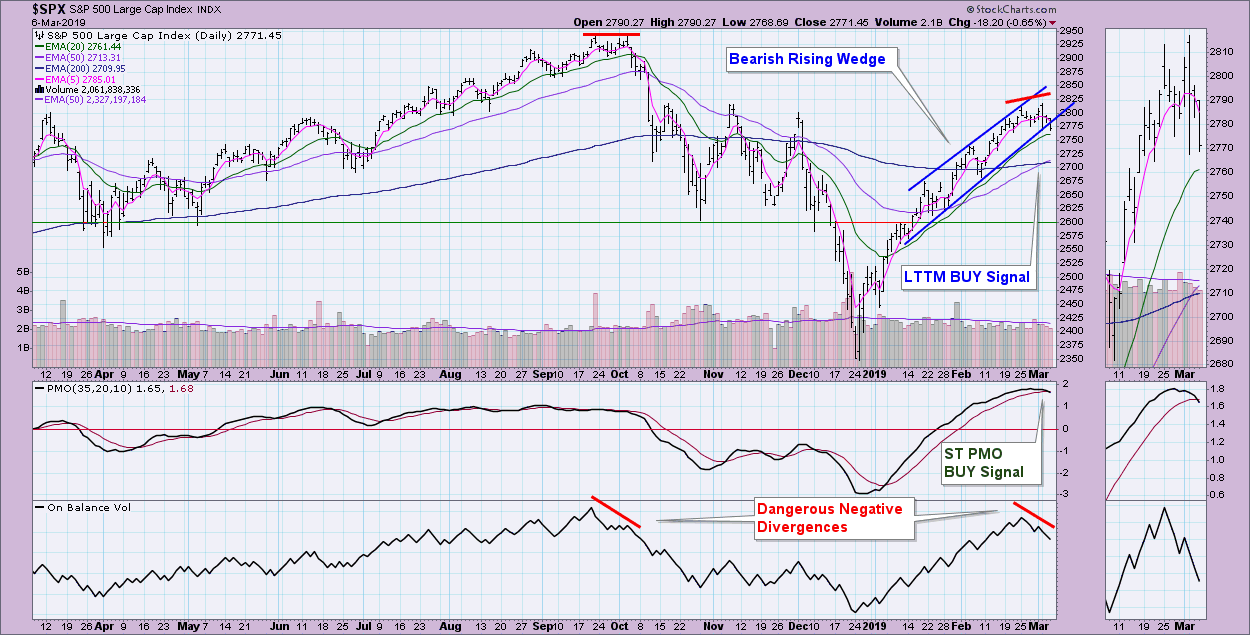
 This will be fairly brief today, as I am in the process of moving to a new home and it's a bit crazy over here. It's important to note the new ST PMO BUY signal, which occurred on a PMO positive crossover on the SPX daily chart. Also, the bearish wedge pattern has finally executed on the SPX. In addition, I would like to point out on the DP Sector Summary below that XLK had a positive 50/200-EMA crossover, which generated a new LT Trend Model BUY signal.
The DecisionPoint Alert presents a mid-week assessment of the trend and condition of the stock market (S&P 500), the U.S. Dollar, Gold, Crude Oil and Bonds.
Watch the latest episode of DecisionPoint on StockCharts TV's YouTube channel here!
SECTORS
Each S&P 500 Index component stock is assigned to one, and only one, of eleven major sectors. This is a snapshot of the Intermediate-Term and Long-Term Trend Model signal status for those sectors.
STOCKS
IT Trend Model: BUY as of 2/1/2019
LT Trend Model: BUY (SPY) as of 2/26/2019
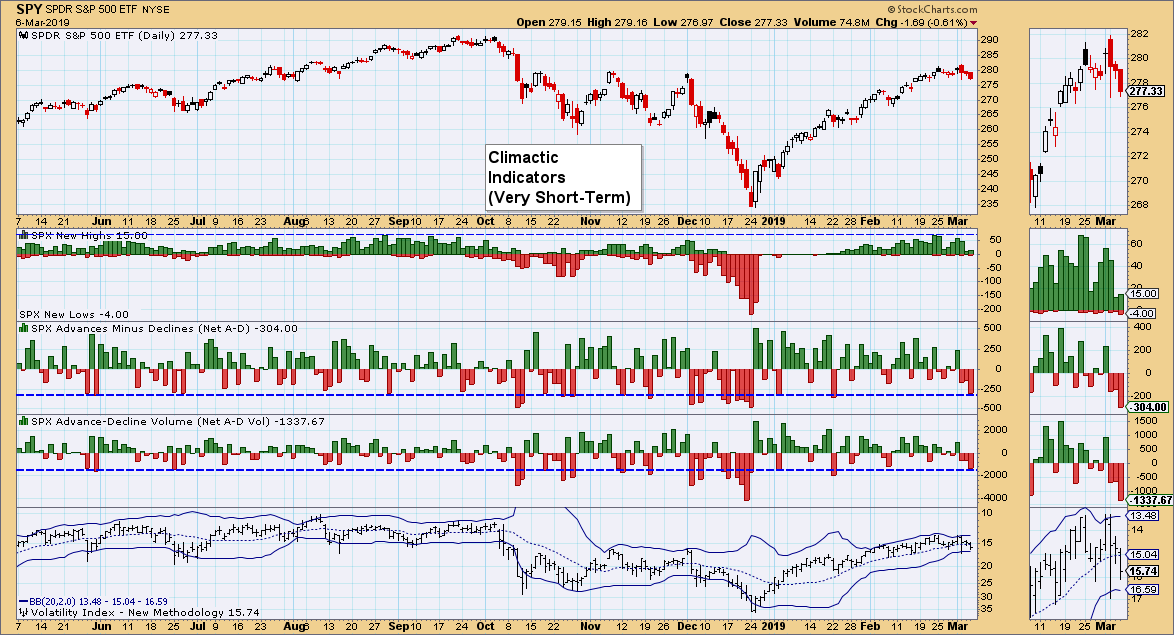
SPY Daily Chart: The important things to note are not only the new signal, but also the new negative divergence with the OBV and price tops.
Climactic Market Indicators: Readings are fairly climactic on breadth. I believe we are still in the midst of a selling initiation, which should keep prices lower into the end of the week.
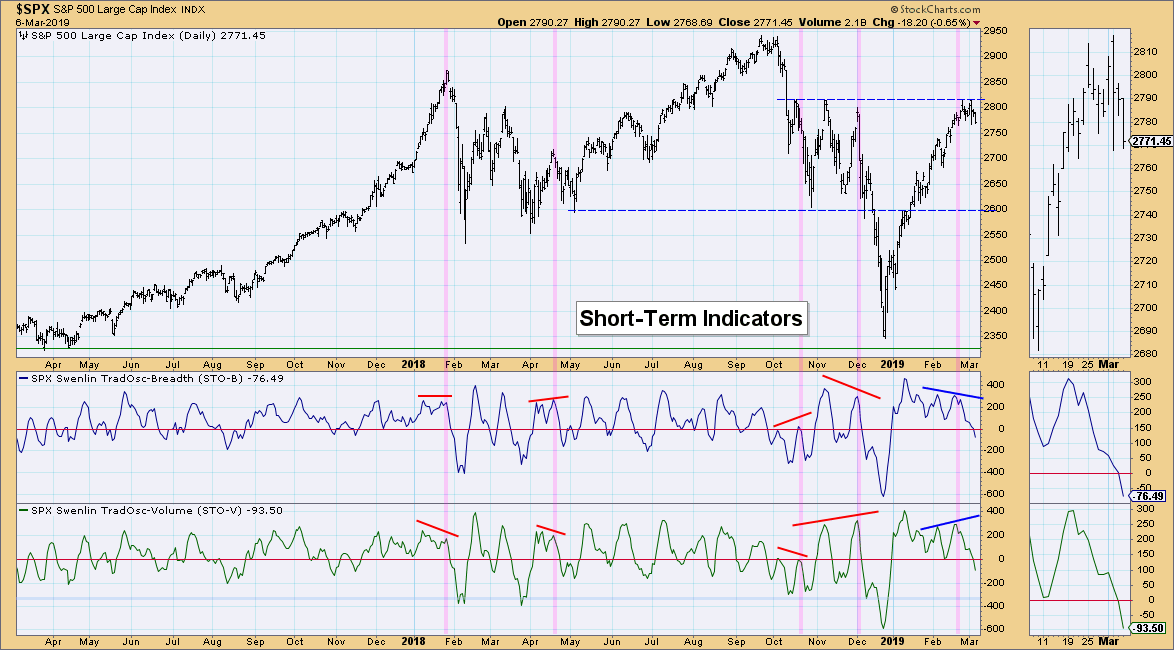
Short-Term Market Indicators: The divergence between the STOs doesn't happen very often, but when it does, it is an attention flag. The rally halted after this current divergence. I don't know that we will see a huge correction as with previous divergences, but we should be cautious nonetheless.
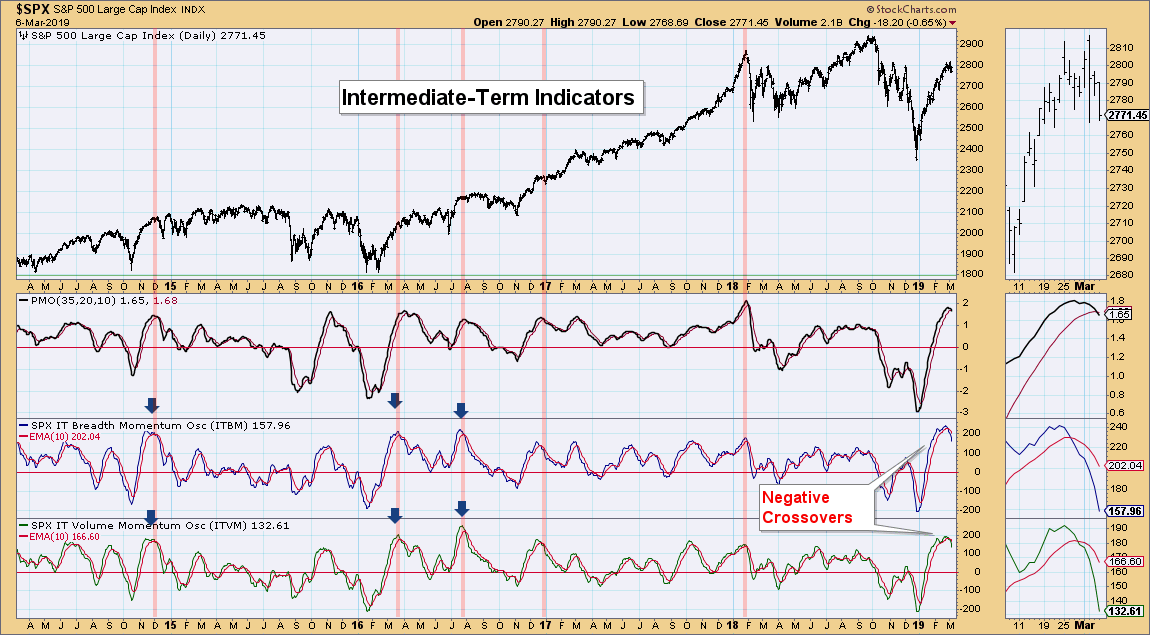
Intermediate-Term Market Indicators: Negative crossovers mean a bearish bias in the intermediate term.
Conclusion: The market is ready to clear overbought conditions. The indicators look pretty ugly right now, so I'm expecting more downside. The best case scenario would be a sideways consolidation that clears overbought conditions.
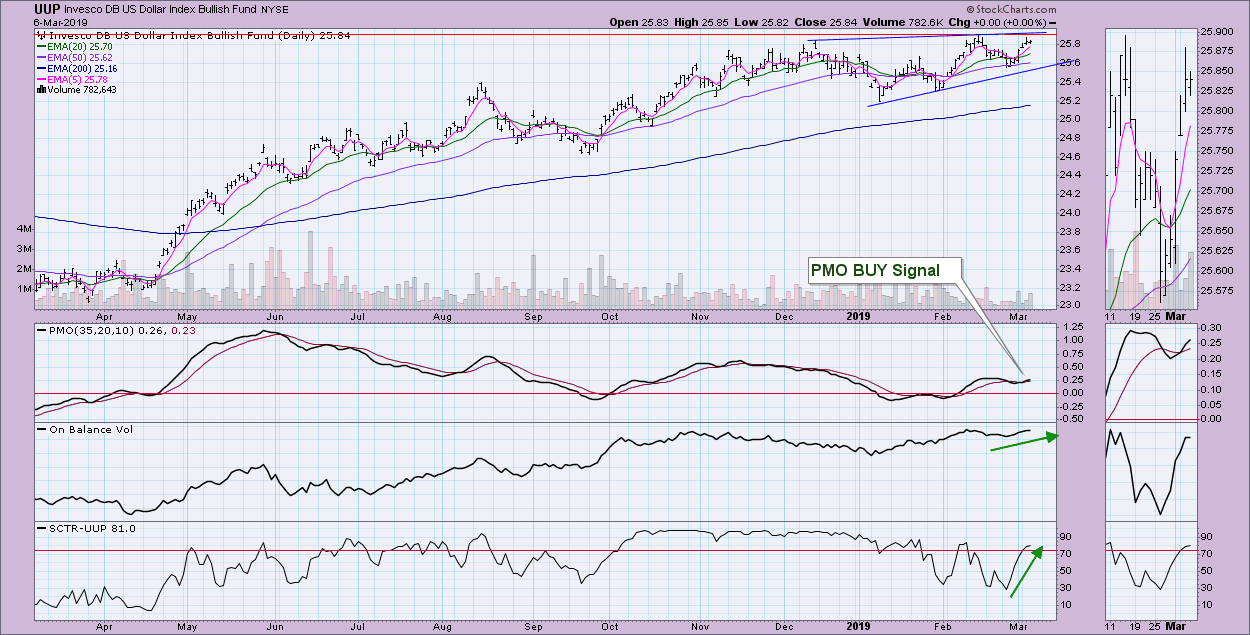
DOLLAR (UUP)
IT Trend Model: BUY as of 2/7/2019
LT Trend Model: BUY as of 5/25/2018
UUP Daily Chart: The new PMO BUY signal suggests that we should see an upside breakout. The rising wedge is still there (blue trendlines) and price is pressing up against overhead resistance. Despite that, I would defer to the PMO. I'm bullish on the Dollar.
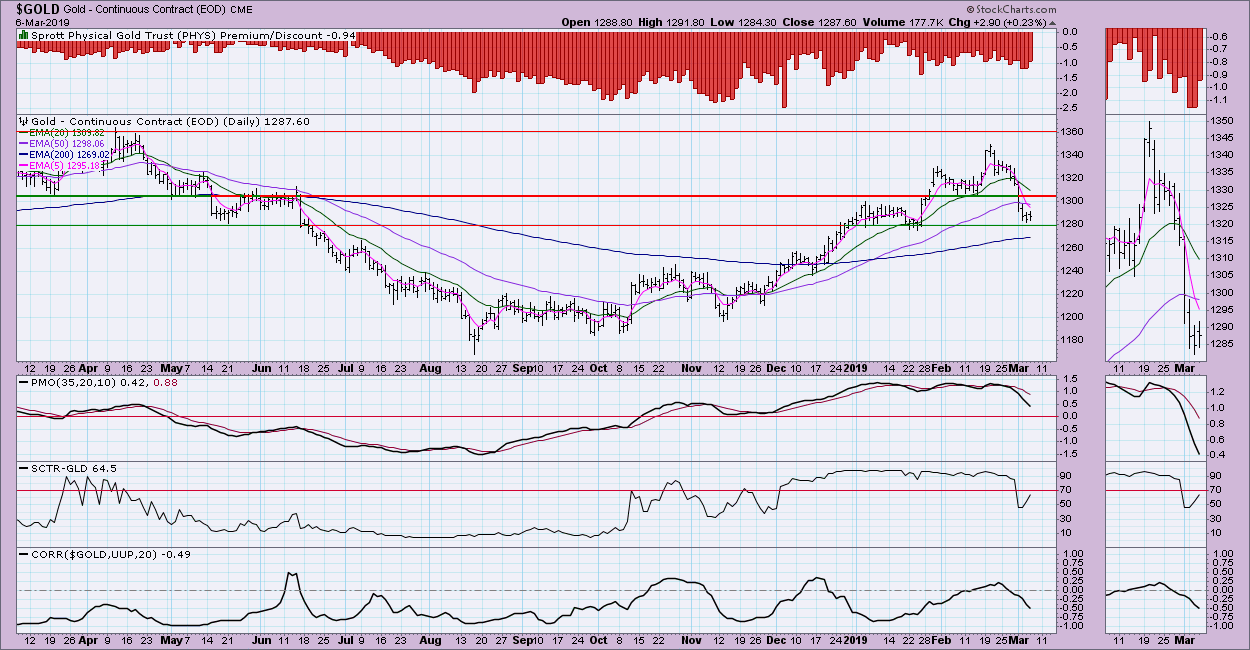
GOLD
IT Trend Model: BUY as of 10/19/2018
LT Trend Model: BUY as of 1/8/2019
GOLD Daily Chart: This one is a big ouch to my investment accounts. Fortunately, discounts remain high, and support has been reached and held today. The PMO is pretty ugly right now, which has me concerned about a possible reverse flag forming here, which would be very bearish.
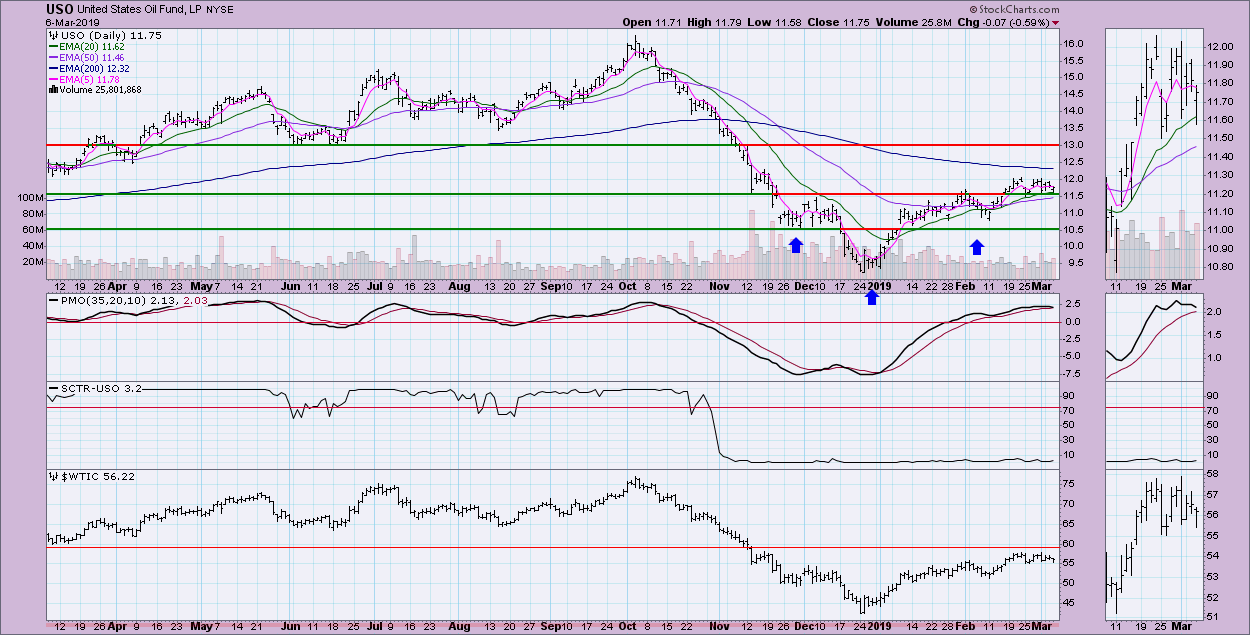
CRUDE OIL (USO)
IT Trend Model: BUY as of 2/19/2019
LT Trend Model: SELL as of 11/23/2018
USO Daily Chart: I had spotted a reverse head and shoulders, but Oil doesn't look interested in breaking out any further. The PMO is overbought and is about ready for a negative crossover SELL signal.
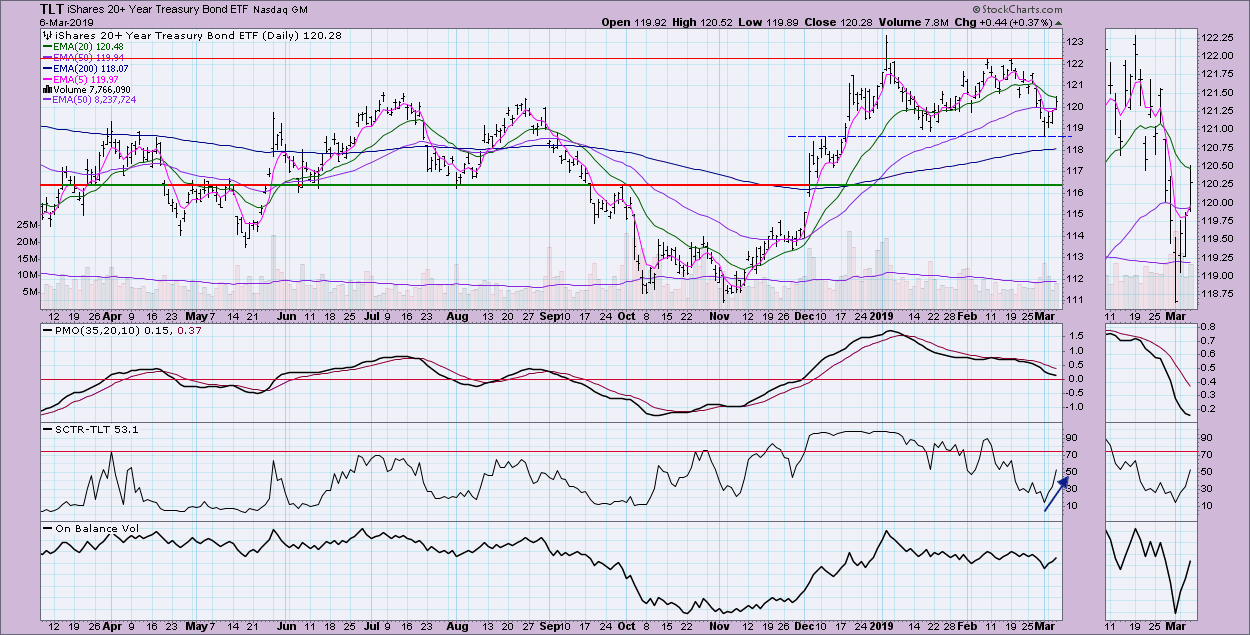
BONDS (TLT)
IT Trend Model: BUY as of 12/6/2018
LT Trend Model: BUY as of 1/2/2019
TLT Daily Chart: After bouncing off support, TLT is headed back up to the top of the trading range. The PMO remains above zero and it does appear to be decelerating. The 20-EMA is currently holding as overhead resistance.
Technical Analysis is a windsock, not a crystal ball.
Happy Charting!
- Erin
**Don't miss any of the DecisionPoint commentaries! Go to the "Notify Me" box toward the end of this blog page to be notified as soon as they are published.**
NOTE: The signal status reported herein is based upon mechanical trading model signals, specifically, the DecisionPoint Trend Model. They define the implied bias of the price index based upon moving average relationships, but they do not necessarily call for a specific action. They are information flags that should prompt chart review. Further, they do not call for continuous buying or selling during the life of the signal. For example, a BUY signal will probably (but not necessarily) return the best results if action is taken soon after the signal is generated. Additional opportunities for buying may be found as price zigzags higher, but the trader must look for optimum entry points. Conversely, exit points to preserve gains (or minimize losses) may be evident before the model mechanically closes the signal.
Helpful DecisionPoint Links:
DecisionPoint Shared ChartList and DecisionPoint Chart Gallery
Price Momentum Oscillator (PMO)
Swenlin Trading Oscillators (STO-B and STO-V)


