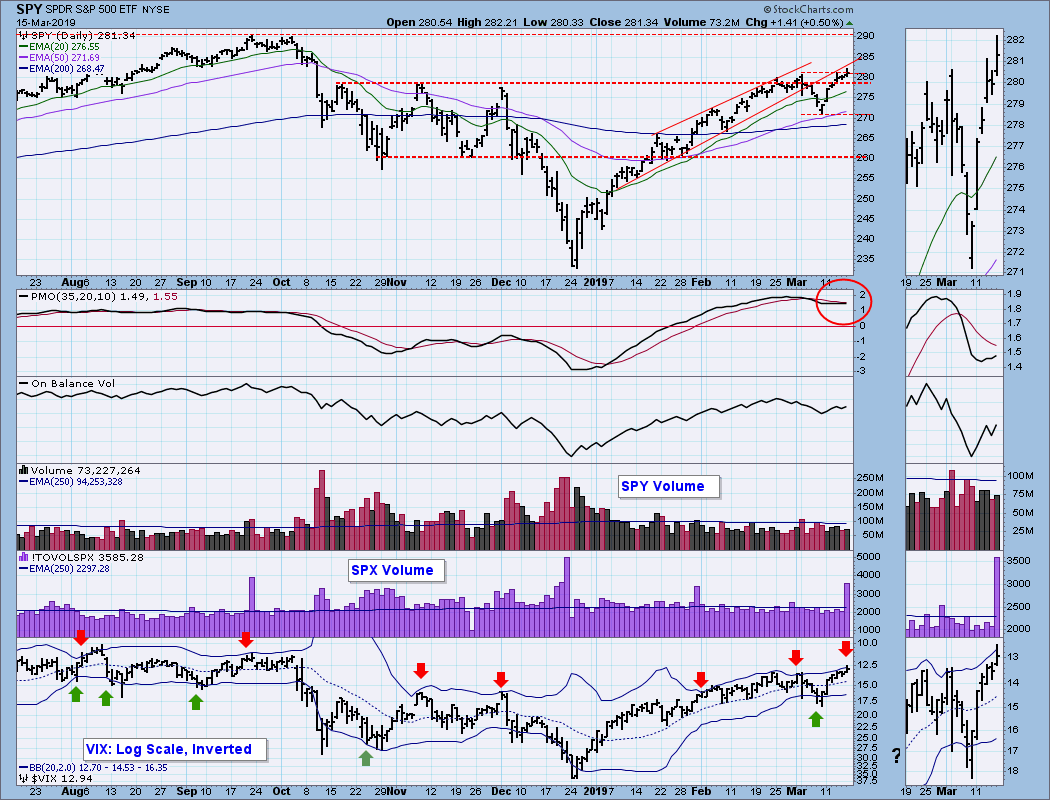
At the end of last week I was looking forward to some more selling to extend the decline that had started from the March 4 top. But no. Price rebounded off last Friday's low, eventually setting a new high for the rally off the December lows. However, on Friday we got a signal that has me looking for a short-term market top very soon. The signal comes from the VIX panel on the chart below. You'll note that I use a different presentation of the VIX than what you will normally see. First I use a log scale to enhance the definition in the lower ranges, and I reverse the scale so that it provides an intuitive overbought/oversold display. Finally, I add Bollinger Bands so as to apply dynamic limits to the overbought/oversold range. When the VIX hits the top Bollinger Band, which happened today, it is a signal to look for a price top within a few days. As you can see from prior instances on the chart, this signal works pretty well, but, of course, no guarantees. Note: The high volume today is due to end-of-quarter options expiration and should not be interpreted as a blowoff or any other climactic internal event.
The DecisionPoint Weekly Wrap presents an end-of-week assessment of the trend and condition of the stock market (S&P 500), the U.S. Dollar, Gold, Crude Oil, and Bonds.
Watch the latest episode of DecisionPoint on StockCharts TV's YouTube channel here!
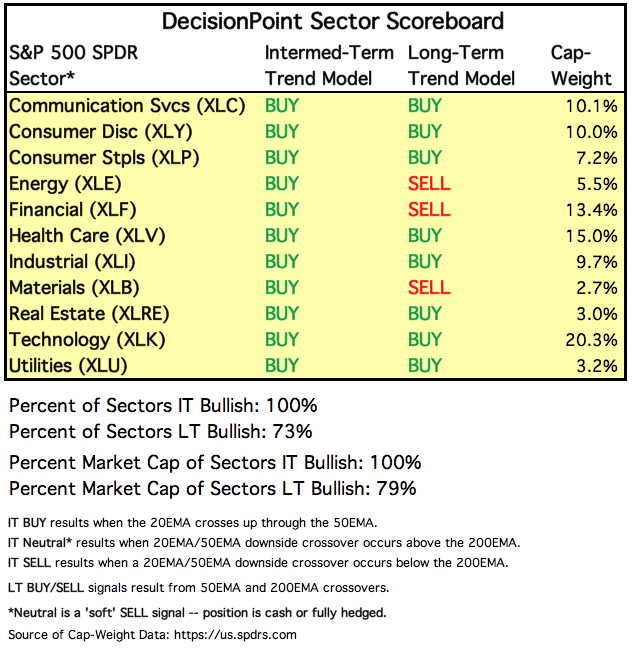
SECTORS
Each S&P 500 Index component stock is assigned to one, and only one, of 11 major sectors. This is a snapshot of the Intermediate-Term and Long-Term Trend Model signal status for those sectors.
STOCKS
IT Trend Model: BUY as of 2/1/2019
LT Trend Model: BUY as of 2/26/2019
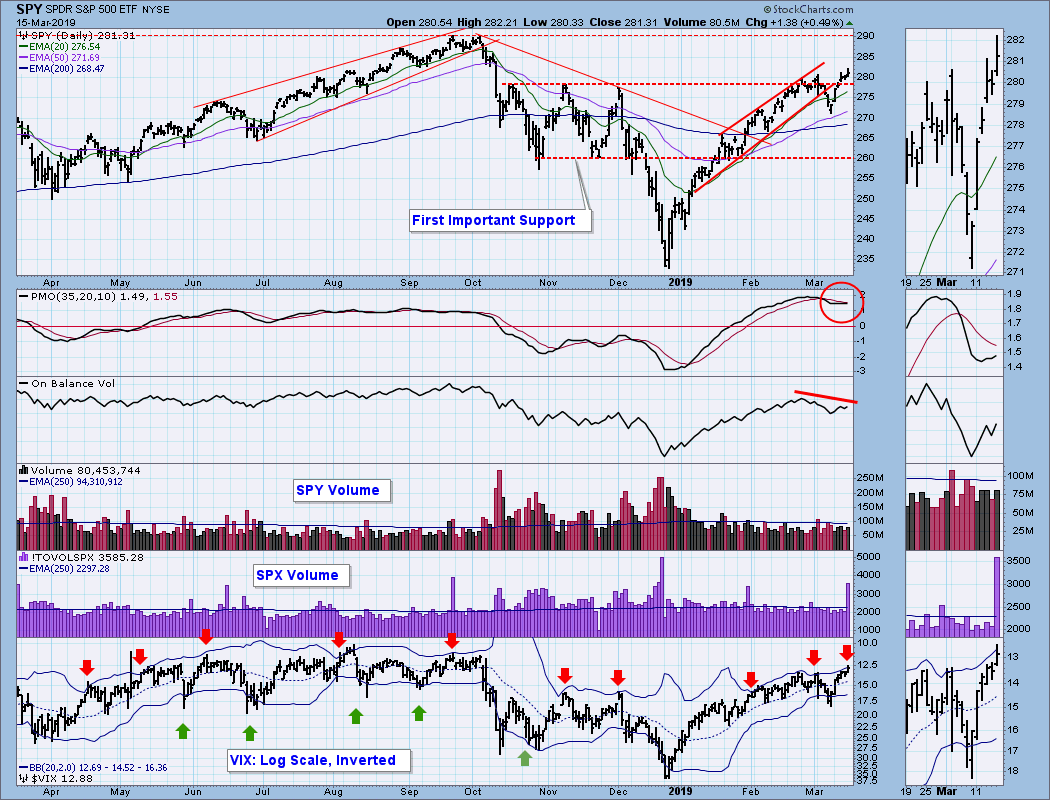
SPY Daily Chart: Besides what I discussed in the opening comments above, the daily PMO turned up this week, but the rate of climb is not impressive. There is a negative divergence on the OBV, indicating that this week's advance was not backed by volume.
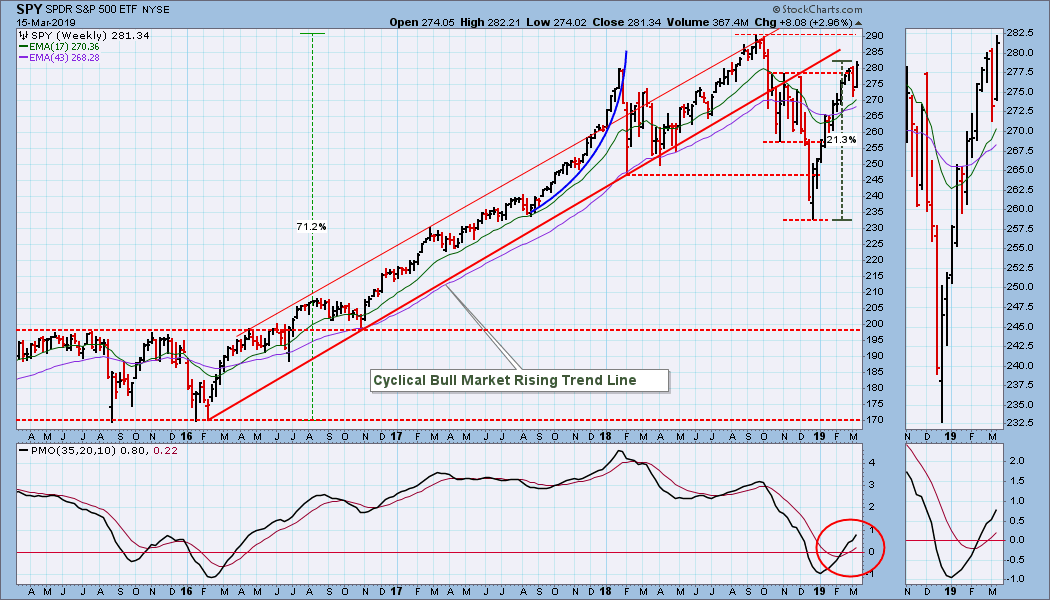
SPY Weekly Chart: The market has been up ten of the last twelve weeks, and the weekly PMO is rising. Very positive picture.
Climactic Market Indicators: New Highs are slightly lower than their peak in February.
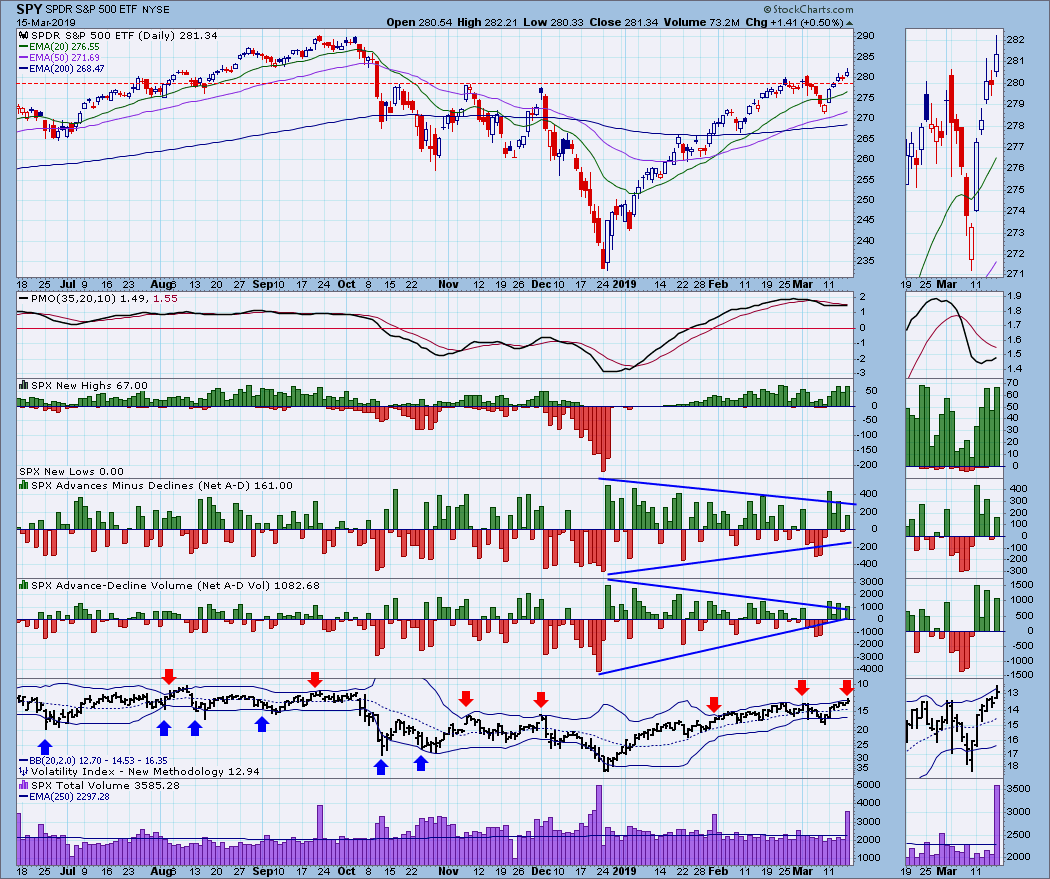
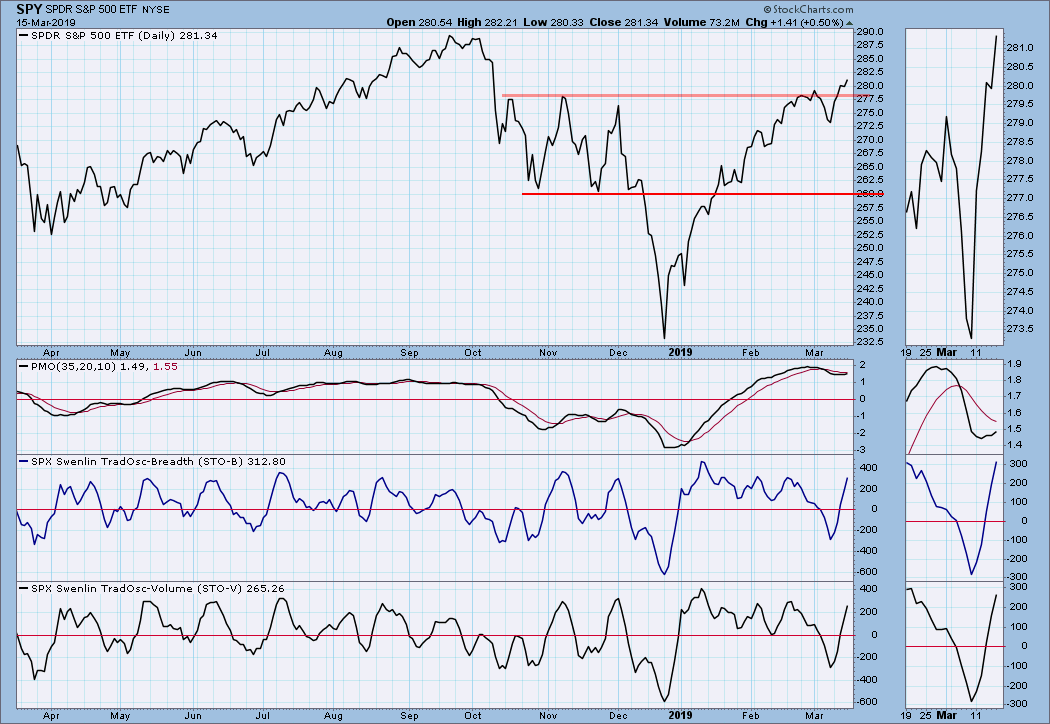
Short-Term Market Indicators: The STO-B and STO-V are now overbought.
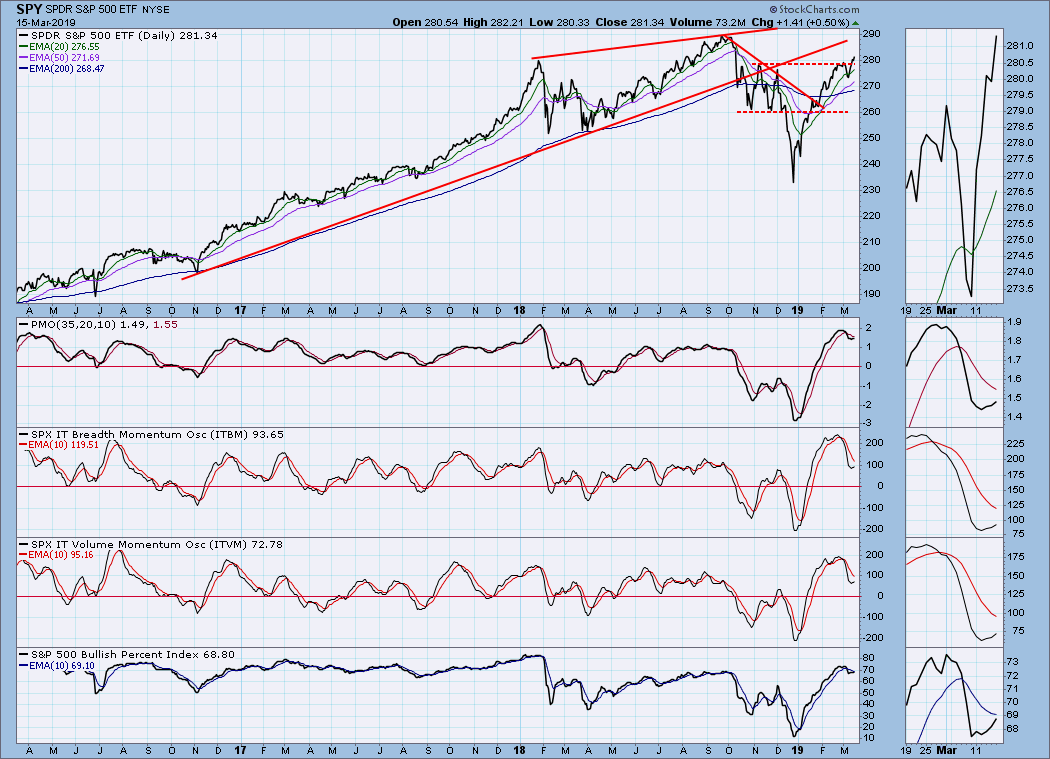
Intermediate-Term Market Indicators: The ITBM and ITVM have pulled back from their overbought levels of last month, but they have farther to go before they reach the zero line, which for most of three years has been the oversold level.
CONCLUSION: The VIX SELL signal I discussed above, and the overbought condition of the short-term indicators leads me to believe that a short-term decline is probably in the cards. As Erin and I discussed on StockCharts TV today, it is hard to remain bearish because the market isn't acting bearish, but I am bullish with some reservations because the rally has lasted so long without any real corrective action taking place.
Note: On Wednesday of next week the usual Fed announcement will take place following the FOMC meeting on Tuesday. This has to potential to move the market abruptly in either direction; however, there is no indication that the Fed will be making changes and the announcement will probably have no effect.
DOLLAR (UUP)
IT Trend Model: BUY as of 2/7/2019
LT Trend Model: BUY as of 5/25/2018
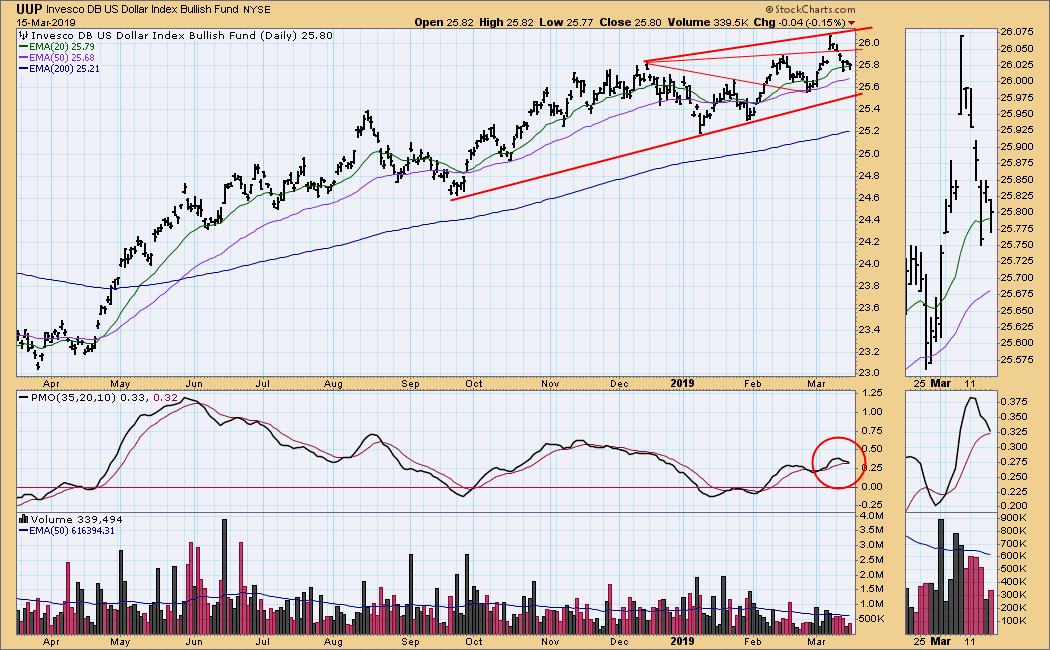
UUP Daily Chart: We can see two previous resistance lines have resolved upward, but the most recent failed to hold, leaving us with a not very pronounced rising wedge. The daily PMO is falling and crossing the signal line.
UUP Weekly Chart: In this time frame we can see that price failed again to reach the top of the longer-term rising wedge, so I'm thinking that the formation is most likely to resolve downward. The weekly PMO has been moving sideways since mid-January.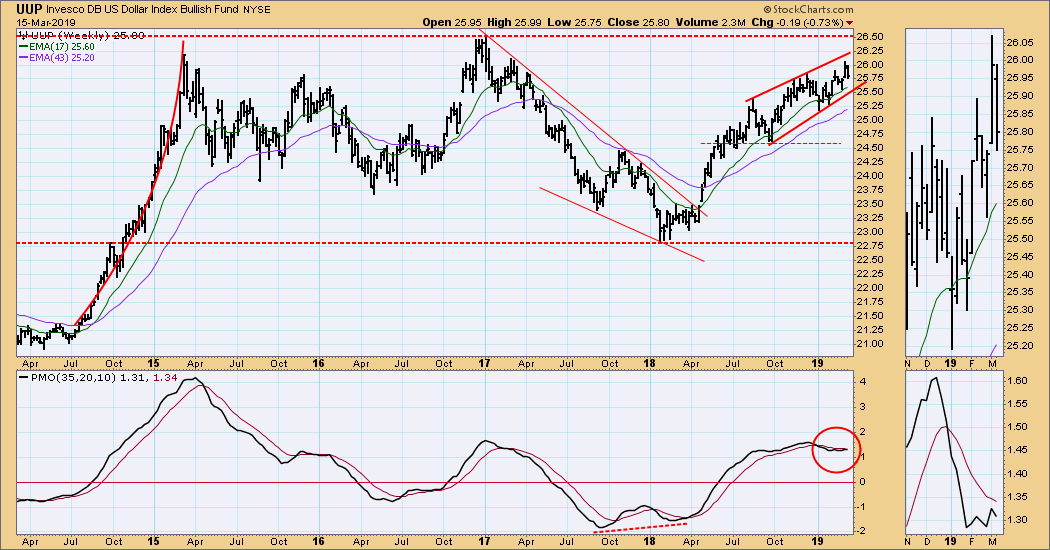
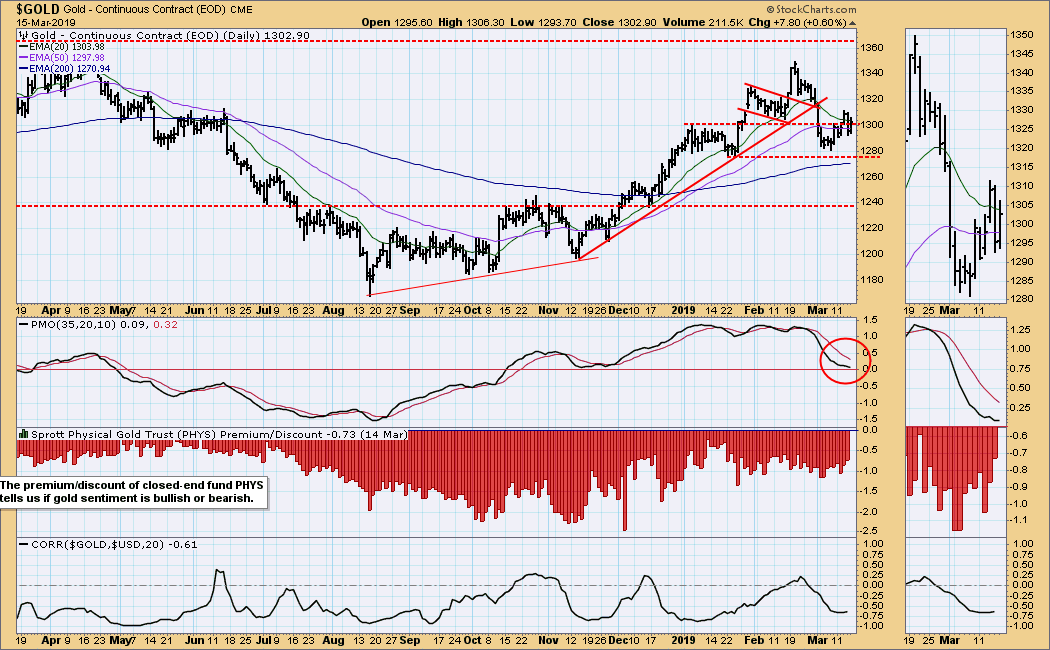
GOLD
IT Trend Model: BUY as of 10/19/2018
LT Trend Model: BUY as of 1/8/2019
GOLD Daily Chart: Gold has been recovering from a sharp breakdown from a three-month rising trend line that occurred at the first of the month. The daily PMO is very close to zero and moving sideways. That is dead neutral.
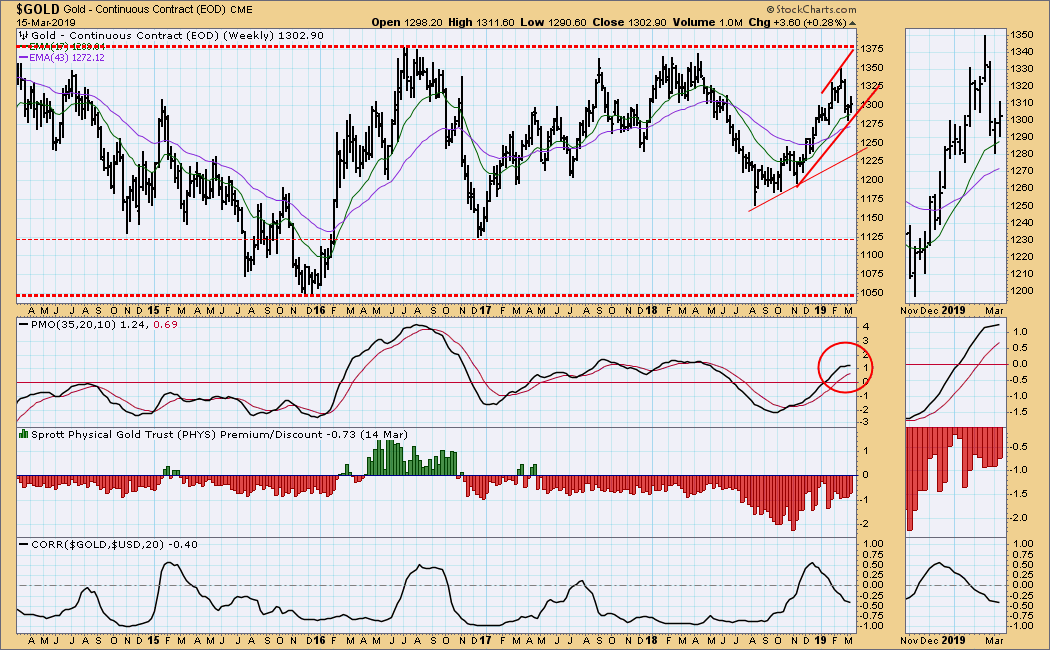
GOLD Weekly Chart: Last week's low allows us to draw a tentative rising trend line from the November low. The weekly PMO is overbought based upon the highs it set in the last two years.
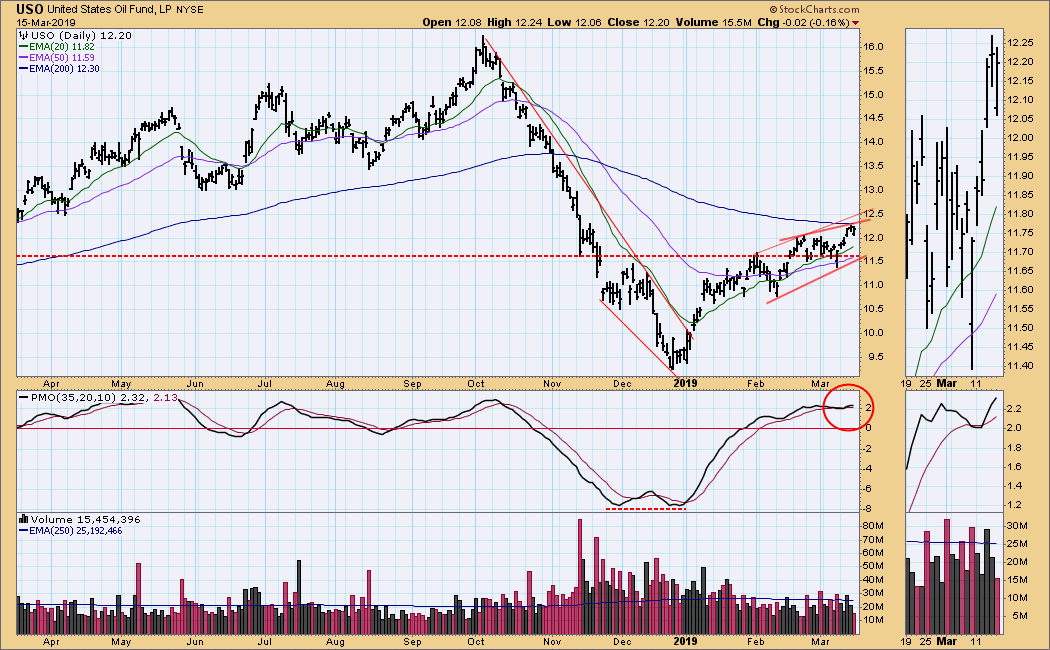
CRUDE OIL (USO)
IT Trend Model: BUY as of 2/19/2019
LT Trend Model: SELL as of 11/23/2018
USO Daily Chart: A small decline has occurred before price reached the top of the rising trend channel, so I have tentatively drawn a line across the two tops, creating a rising wedge. The daily PMO is rising but it is overbought.
USO Weekly Chart: USO and WTIC remain positive and above recently penetrated resistance, now support. The weekly PMO is above the signal line and rising.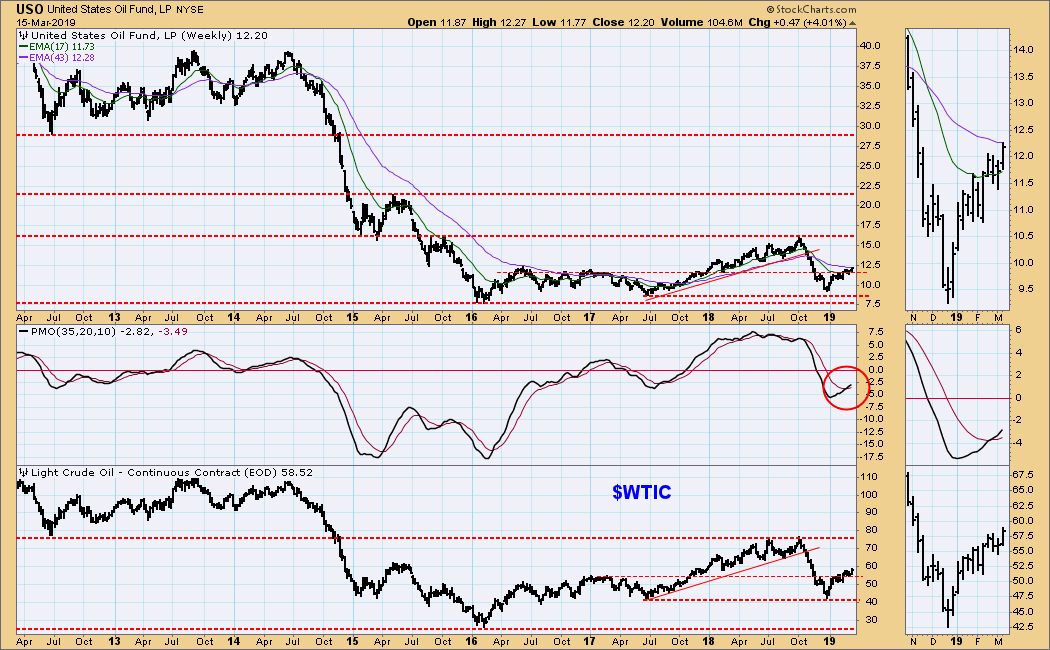
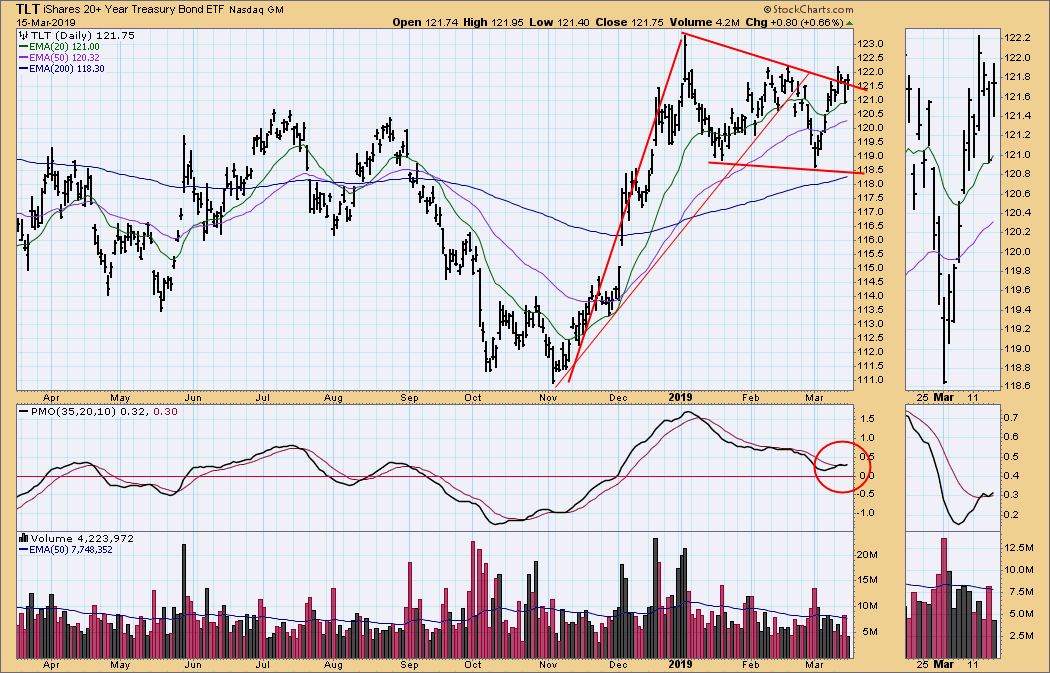
BONDS (TLT)
IT Trend Model: BUY as of 12/6/2018
LT Trend Model: BUY as of 1/2/2019
TLT Daily Chart: We have a bullish flag formation, and the flag is also a bullish falling wedge. Price has been trying to break out of the flag.
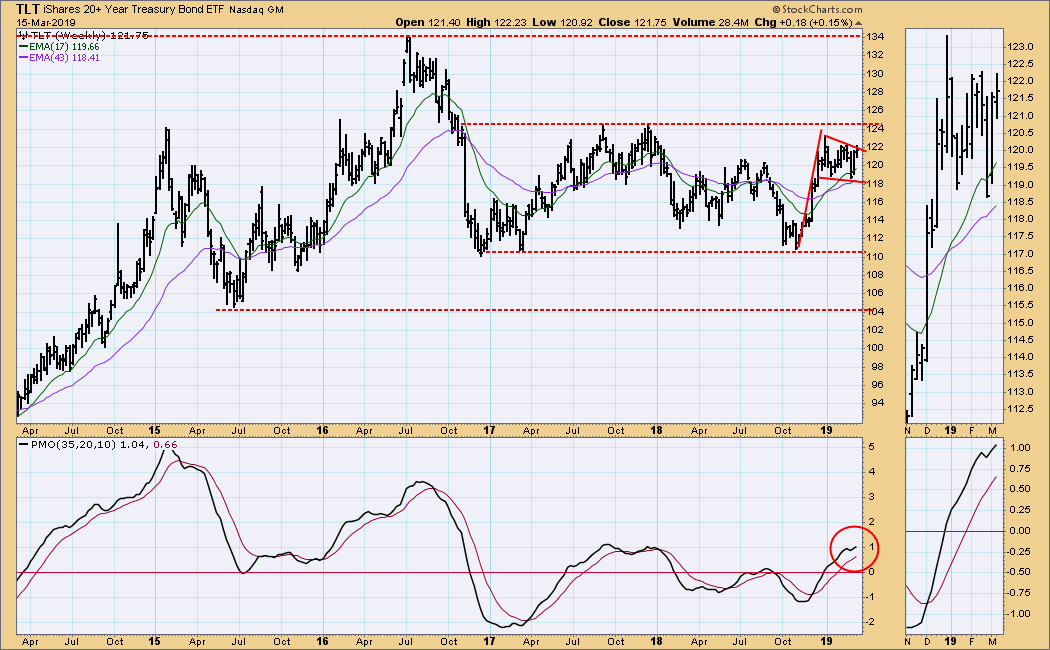
TLT Weekly Chart: We see a broader context in this time frame. If price can break out of the flag, overhead resistance is not far ahead.
**Don't miss any of the DecisionPoint commentaries! Go to the "Notify Me" box toward the end of this blog page to be notified as soon as they are published.**
Technical Analysis is a windsock, not a crystal ball.
Happy Charting!
- Carl
NOTE: The signal status reported herein is based upon mechanical trading model signals, specifically, the DecisionPoint Trend Model. They define the implied bias of the price index based upon moving average relationships, but they do not necessarily call for a specific action. They are information flags that should prompt chart review. Further, they do not call for continuous buying or selling during the life of the signal. For example, a BUY signal will probably (but not necessarily) return the best results if action is taken soon after the signal is generated. Additional opportunities for buying may be found as price zigzags higher, but the trader must look for optimum entry points. Conversely, exit points to preserve gains (or minimize losses) may be evident before the model mechanically closes the signal.
Helpful DecisionPoint Links:
DecisionPoint Shared ChartList and DecisionPoint Chart Gallery
Price Momentum Oscillator (PMO)
Swenlin Trading Oscillators (STO-B and STO-V)


