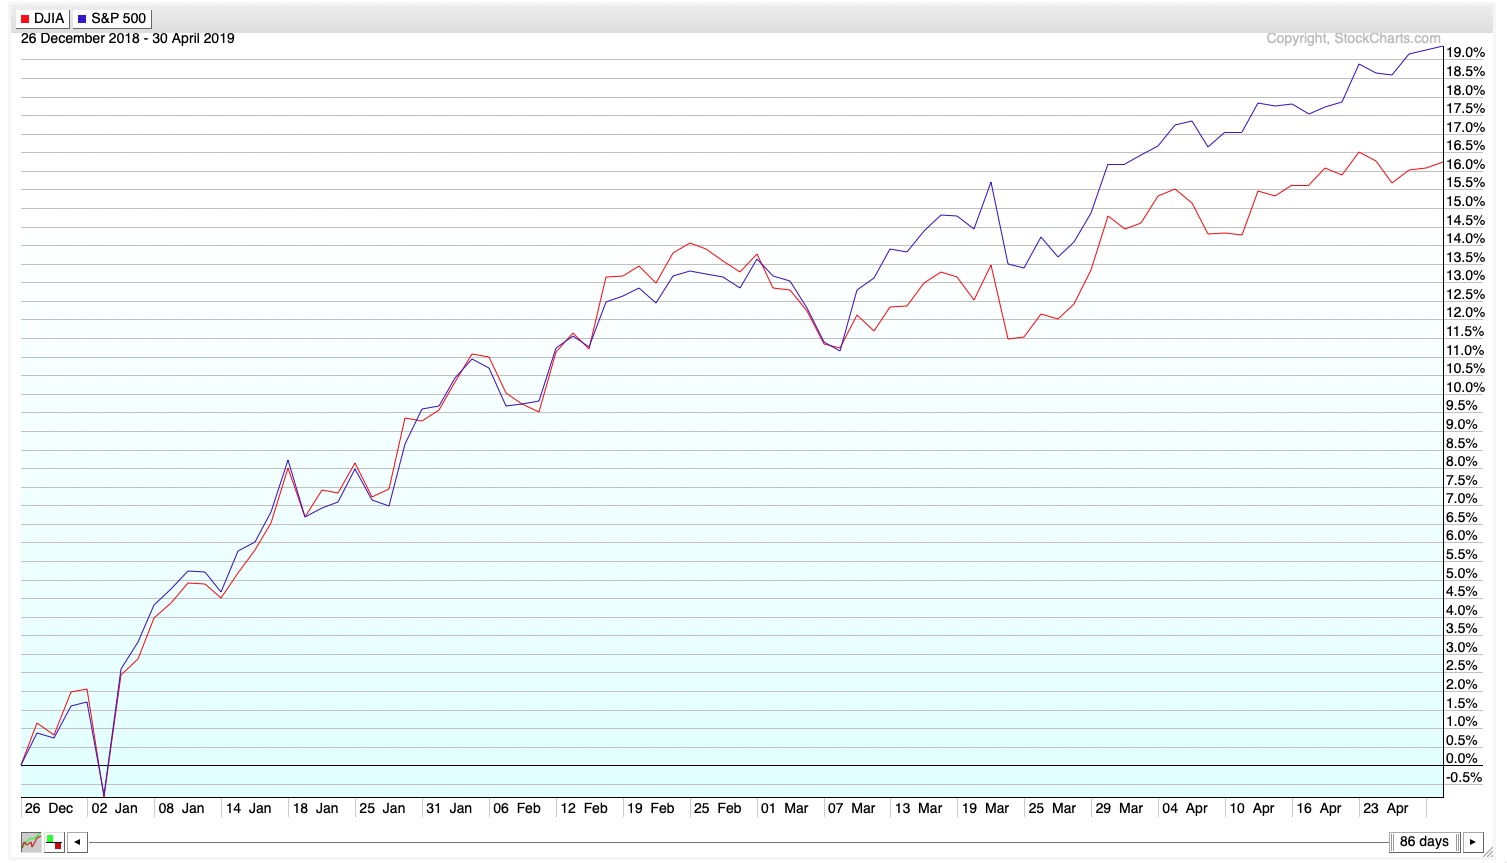
Since about the beginning of March, the SPX has been outperforming the Dow on an absolute basis. Looking at the December 26, 2018-April 30, 2019 PerfChart below,, the Dow is up just above 16%, which is certainly a win. However, the SPX, our benchmark, is up almost 20% from December 26.
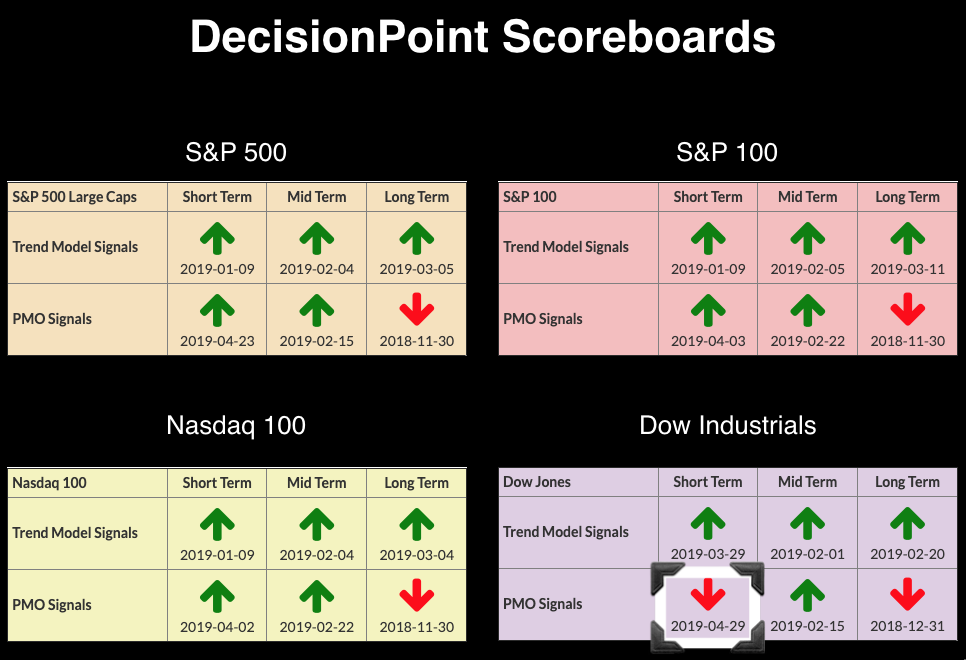
Here are the current DecisionPoint Scoreboards for the large-cap indexes that we track. The PMO SELL signal for the Dow actually came in yesterday afternoon. I suspected we would just see it whipsaw back to a BUY signal today, as the margin was simply too high to cover in a day. This morning, I noted that the SPX was actually holding a PMO SELL signal too. Fortunately, by the close, the SPX was able to hold onto the BUY signal.
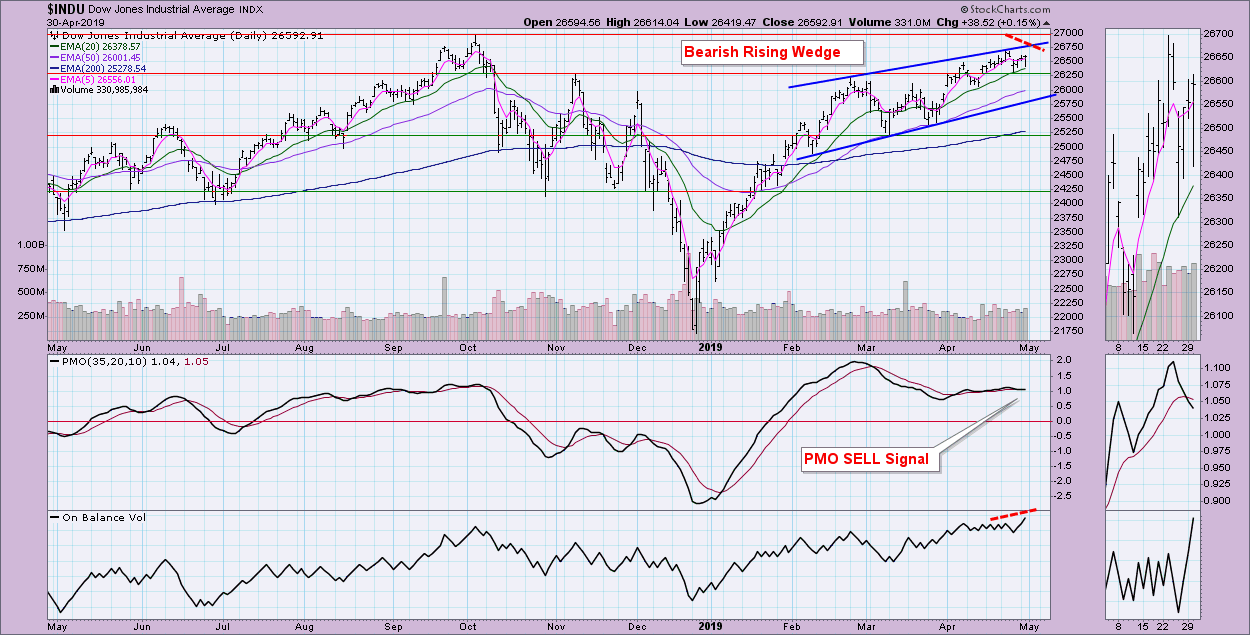
You'll note on both charts below for the Dow and the SPX that bearish rising wedges are in play. The Dow chart is more bearish for a few reasons. The most obvious is that the Dow hasn't posted new all-time highs yet; in fact, the Dow never even came close to testing all-time highs. The PMO SELL signal is a negative. If we can get some positive follow-through on today's final rally, the SELL signal will disappear fairly quickly. However, I don't like the volume pattern here. The OBV shows a reverse divergence. Despite positive volume coming in and pushing the OBV to a new high, price was unable to rise above last week's high. Technically, the OBV has not topped yet, so there is time for this divergence to disintegrate if price manages a new top along with the OBV.
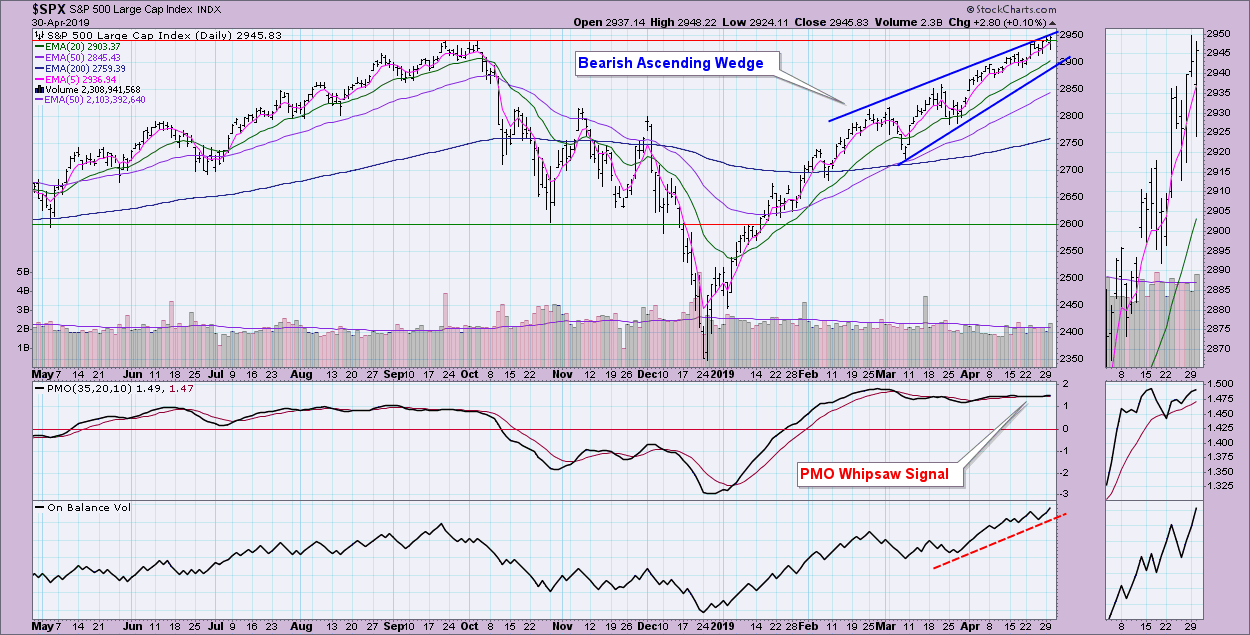
The SPX has made new all-time highs, but hasn't been able to shake the bearish rising wedge. The OBV looks quite different from the Dow, confirming this rally and not forming a divergence.
Conclusion: The Dow is underperforming the SPX benchmark. The daily chart suggests this underperformance will continue unless we can move back to a PMO BUY signal and see the reverse divergence between the OBV and price go away.
Watch the latest episode of DecisionPoint with Carl & Erin Swenlin LIVE on Fridays 4:30p EST or on the StockCharts TV YouTube channel here!
Technical Analysis is a windsock, not a crystal ball.
Happy Charting!
- Erin
erinh@stockcharts.com
Helpful DecisionPoint Links:
DecisionPoint Shared ChartList and DecisionPoint Chart Gallery
Price Momentum Oscillator (PMO)
Swenlin Trading Oscillators (STO-B and STO-V)
**Don't miss DecisionPoint Commentary! Add your email below to be notified of new updates"**


