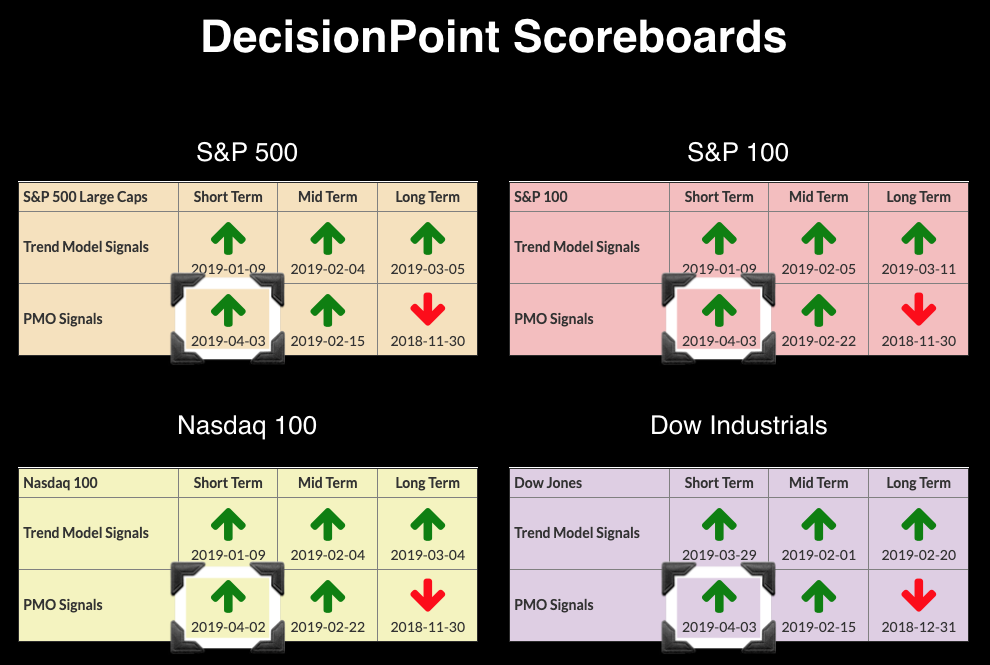
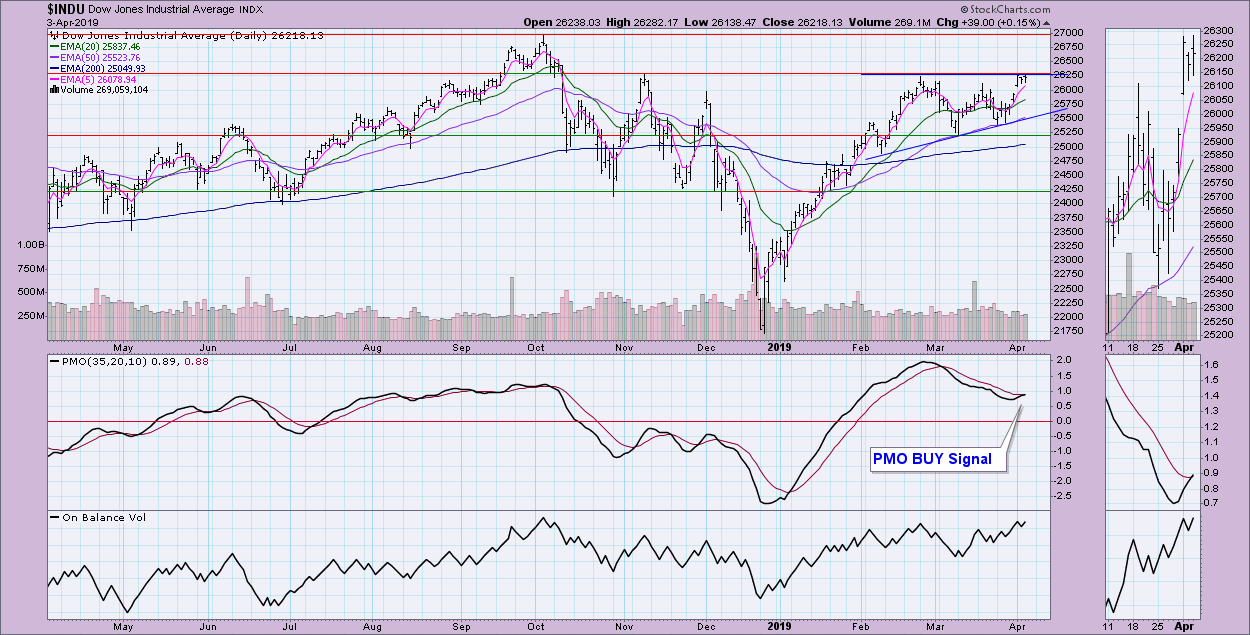
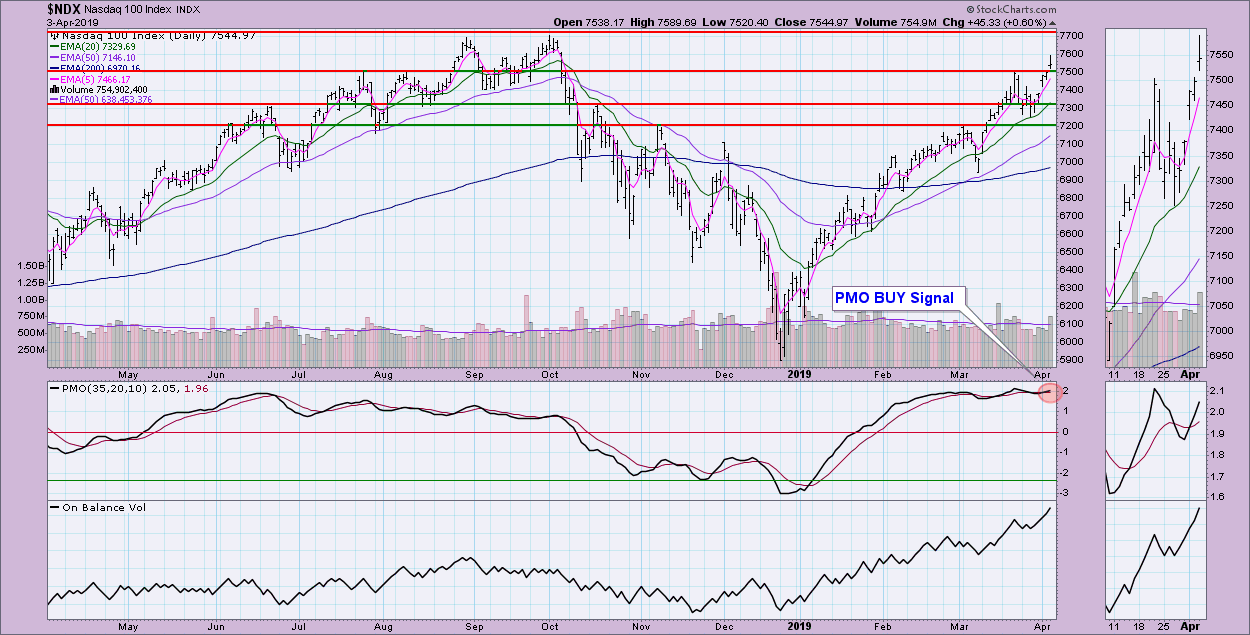
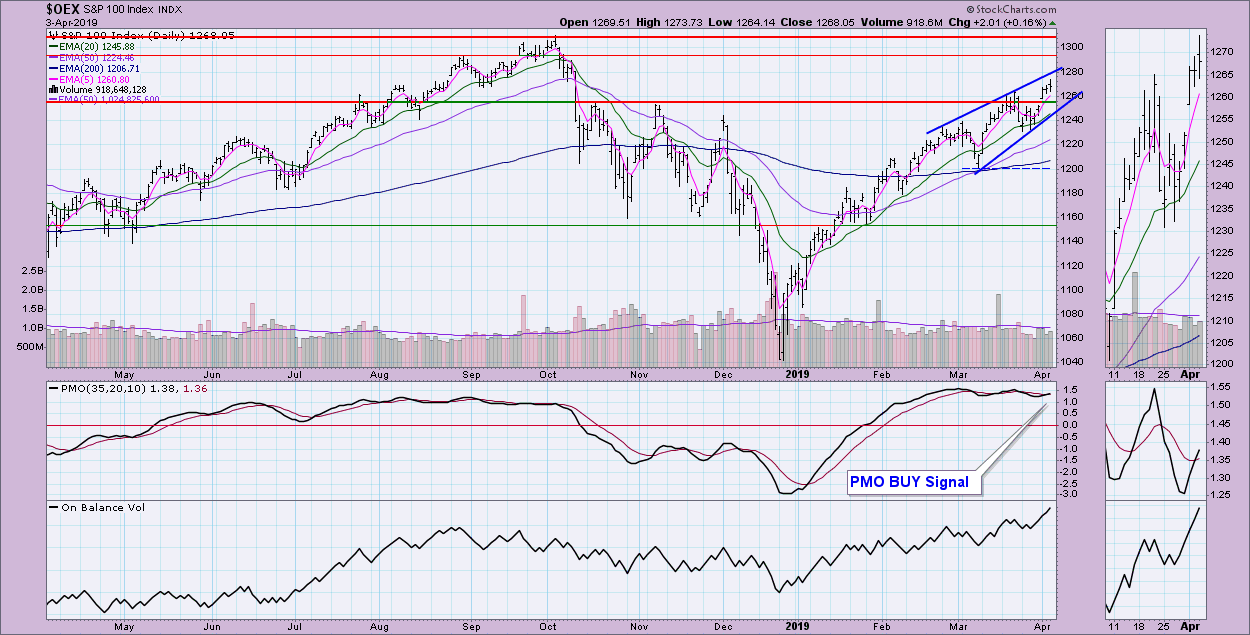
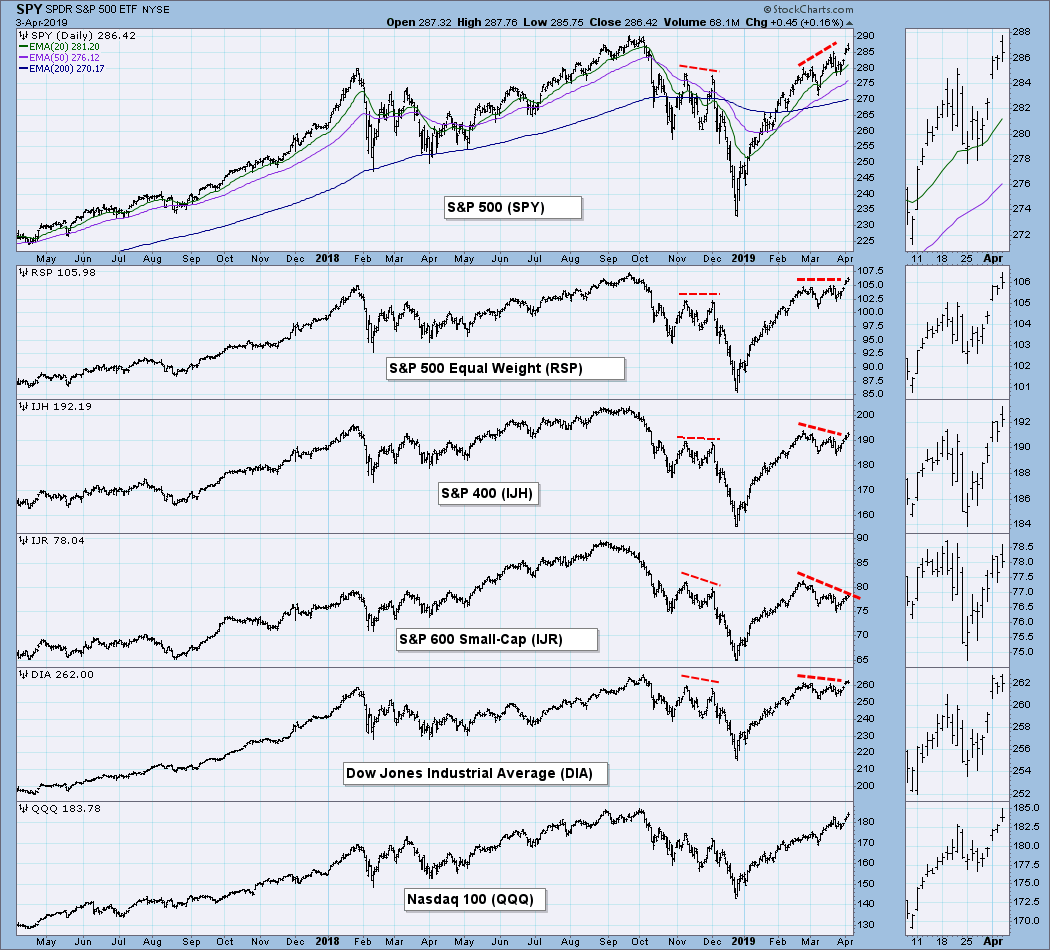
 Yesterday, the NDX started the PMO BUY signal party by adding the first Short-Term PMO BUY signal. Today, the other three indexes clicked ST PMO BUY signals as well. Below the Scoreboard are the charts of each signal. The Dow is struggling with overhead resistance. The NDX had a convincing breakout today after getting its PMO BUY signal yesterday. The OEX looks like the SPX, with a bearish rising wedge still intact.
The DecisionPoint Alert presents a mid-week assessment of the trend and condition of the stock market (S&P 500), the U.S. Dollar, Gold, Crude Oil and Bonds.
Watch the latest episode of DecisionPoint on StockCharts TV's YouTube channel here!
SECTORS
Each S&P 500 Index component stock is assigned to one, and only one, of eleven major sectors. This is a snapshot of the Intermediate-Term and Long-Term Trend Model signal status for those sectors.
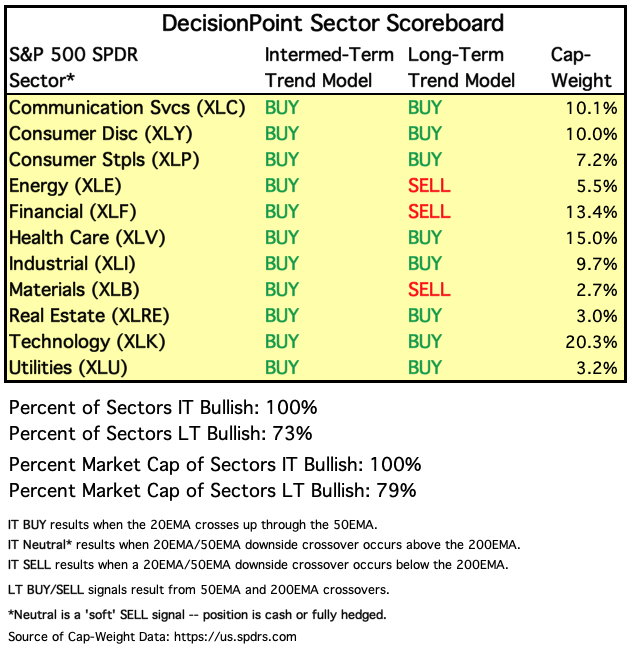
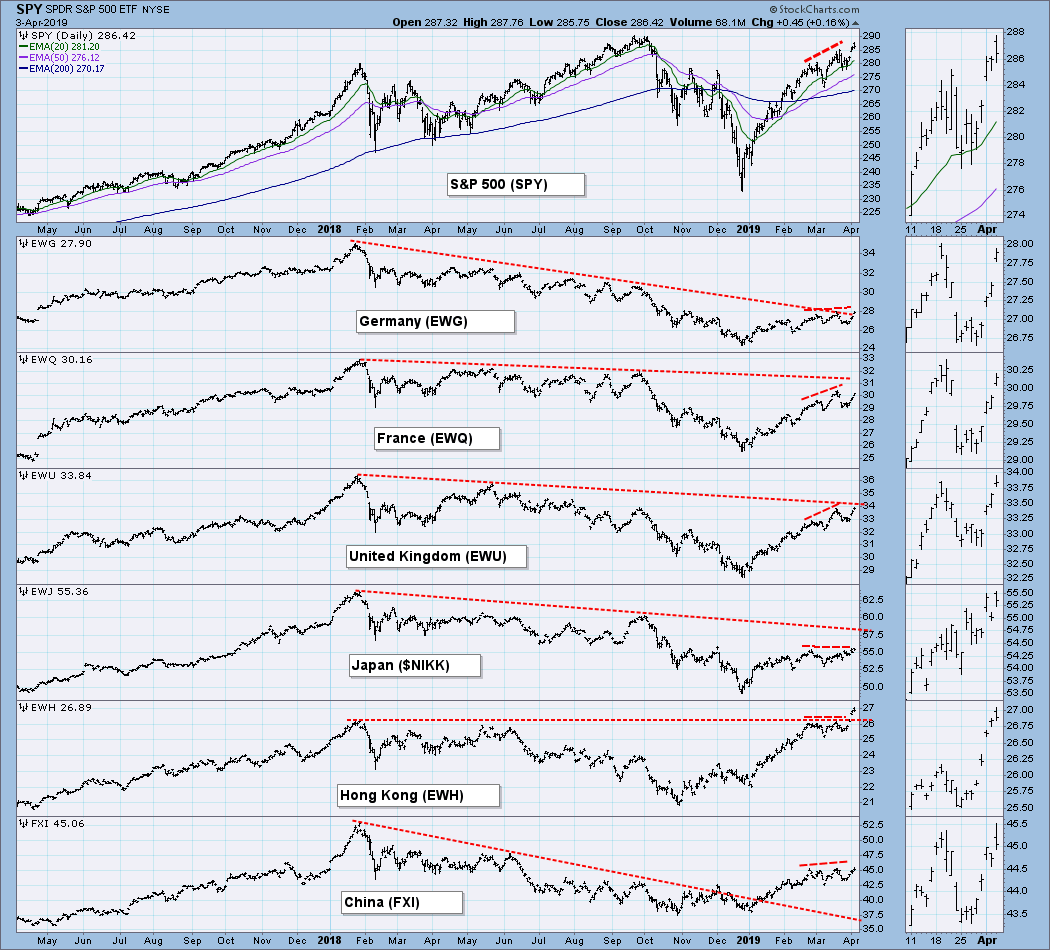
I have decided to add the following two charts to the DecisionPoint LIVE ChartList and include them in my mid-week DP Alert. Of note is the fact that Germany is about ready to finally break out of its bear market.
STOCKS
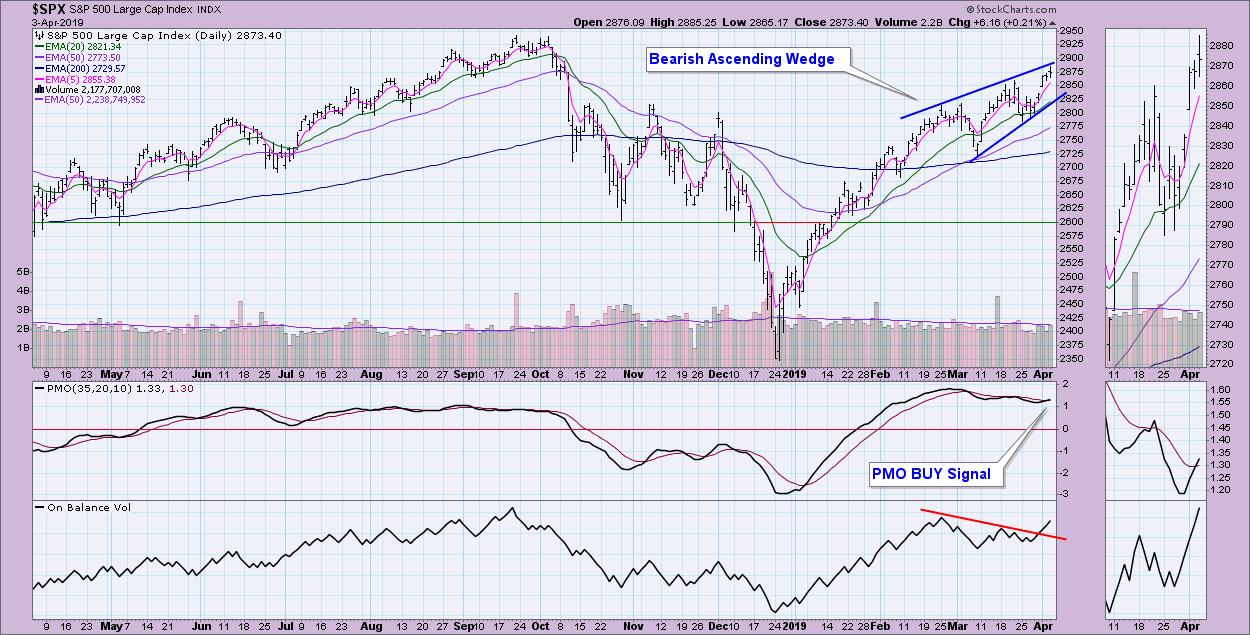
IT Trend Model: BUY as of 2/1/2019
LT Trend Model: BUY (SPY) as of 2/26/2019
SPY Daily Chart: As I noted above, the OEX is replicating the bearish ascending wedge on the SPX. As bearish patterns, the expectation is a breakdown below the rising trend line. The PMO is somewhat overbought, but it is suggesting more upside movement, not a breakdown. Although the chart pattern is bearish, I favor a breakout based on the PMO BUY signal and breakout on OBV.
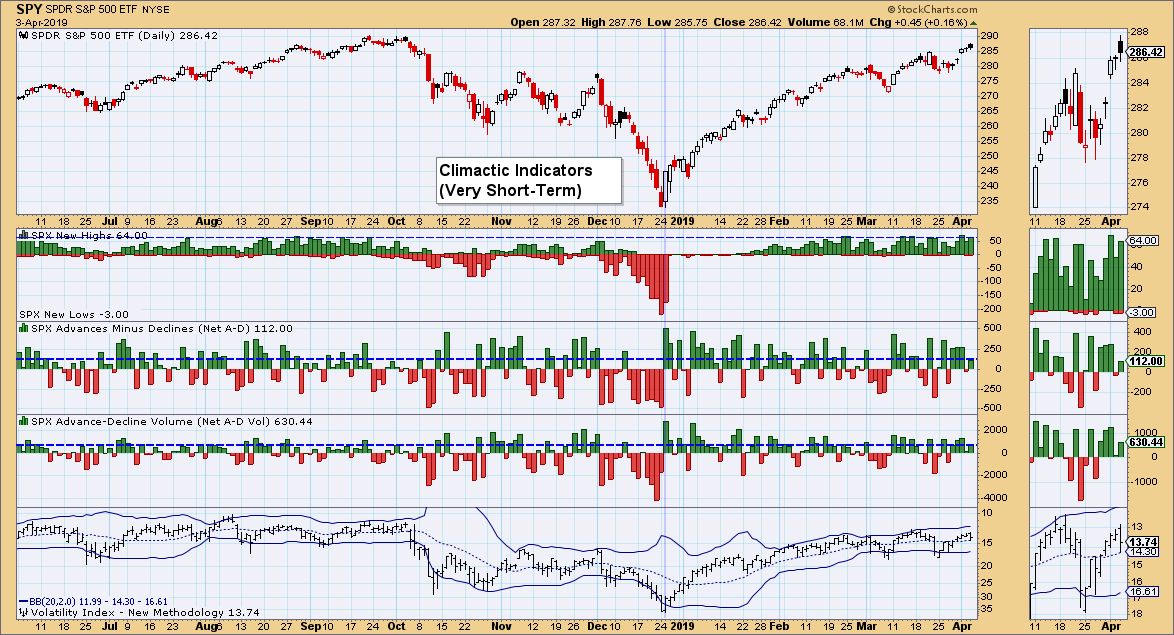
Climactic Market Indicators: The only thing of note is the fact that the VIX didn't hit the upper Bollinger Band (BB) before turning back down. I deem a reading of less than 14 as "complacent." If the rally continues, I suspect readings will get lower and more complacent. At that time, I'll start looking for a short-term reversal. Without the puncture of the upper BB, as well as anti-climactic breadth readings, we could see these low VIX readings persist. A good-sized pullback will get the VIX to rise and, eventually, reach for the lower BB.
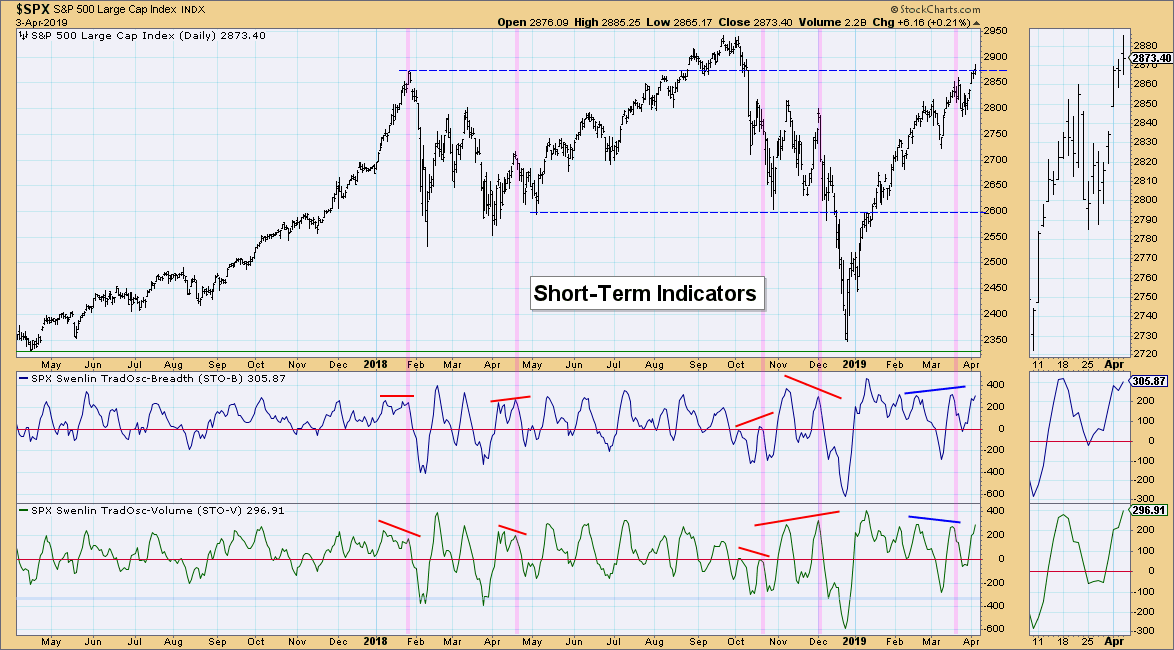
Short-Term Market Indicators: Looking bullish. Both oscillators are rising nicely and only somewhat overbought. They could still support a continuation of this rally.
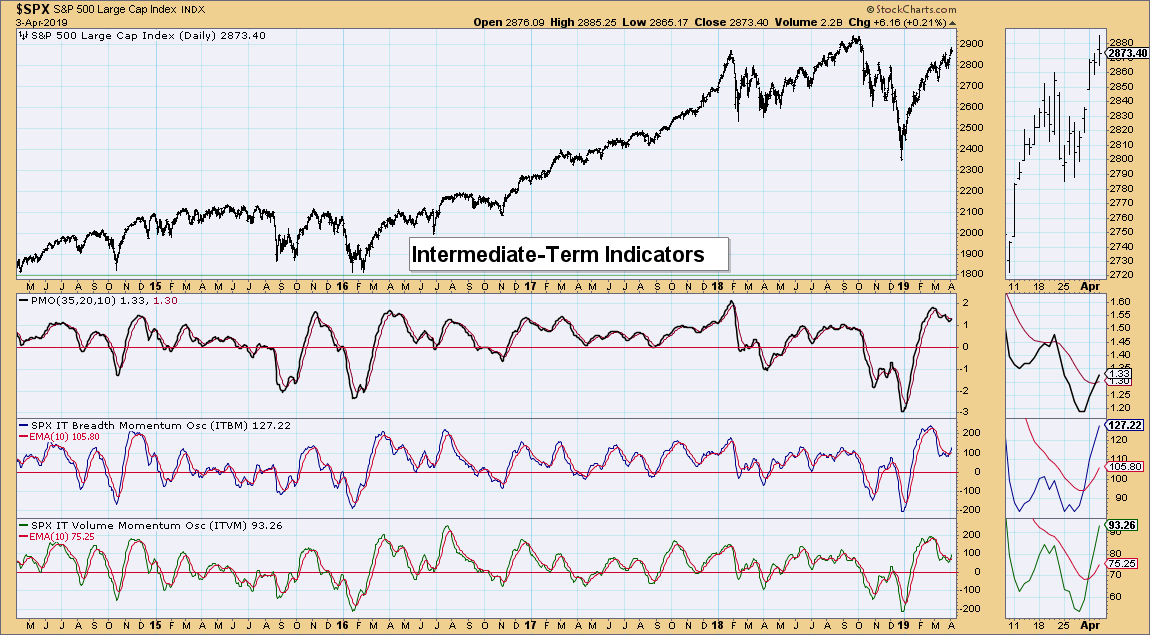
Intermediate-Term Market Indicators: Positive crossovers and an acceleration higher is very bullish for the intermediate term. They aren't overbought and have room to run higher.
Conclusion: After gapping up on Monday, the market has been enjoying some upside follow-through. Indicators suggest the rally will continue. I'm not crazy about the bearish rising wedge on the SPX and OEX, but given the beautiful breakout on the NDX and new PMO BUY signals across the board, I am looking for higher prices.
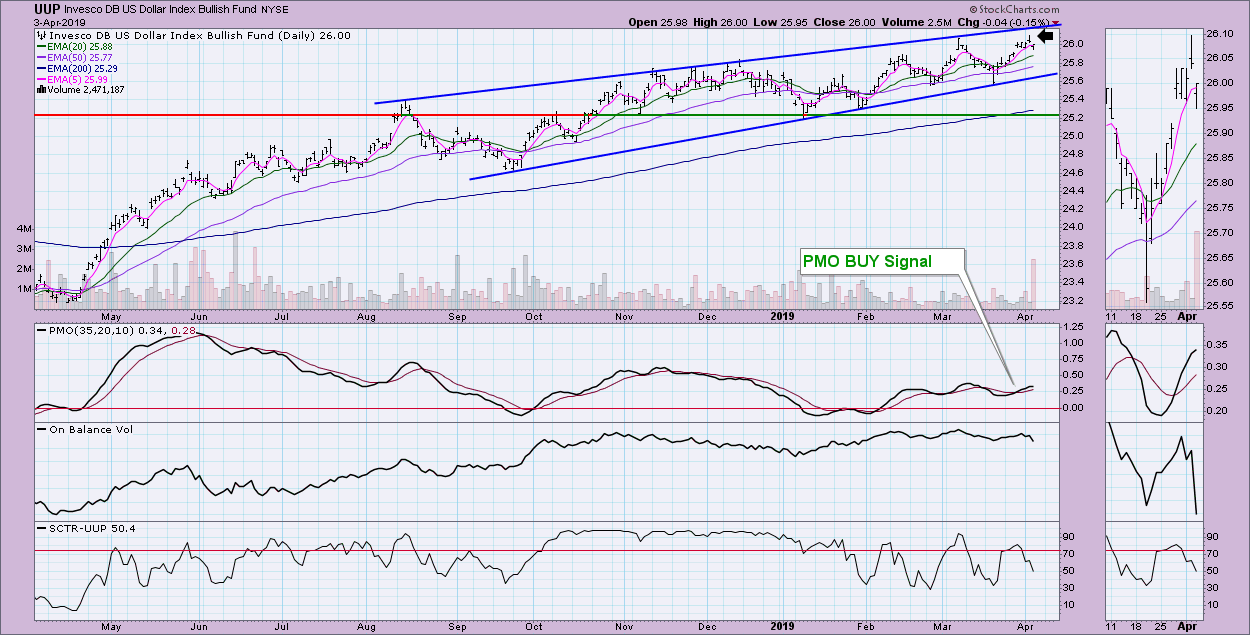
DOLLAR (UUP)
IT Trend Model: BUY as of 2/7/2019
LT Trend Model: BUY as of 5/25/2018
UUP Daily Chart: The intermediate-term bearish rising wedge is still there. Price was unable to test the upper edge of the wedge, which is bearish. We did see a PMO BUY signal, but the PMO is beginning to decelerate on this pullback today. I would look for a test of the 20-EMA at a minimum, but we will likely see at least a test of the bottom of the pattern. I'm looking for the breakdown.
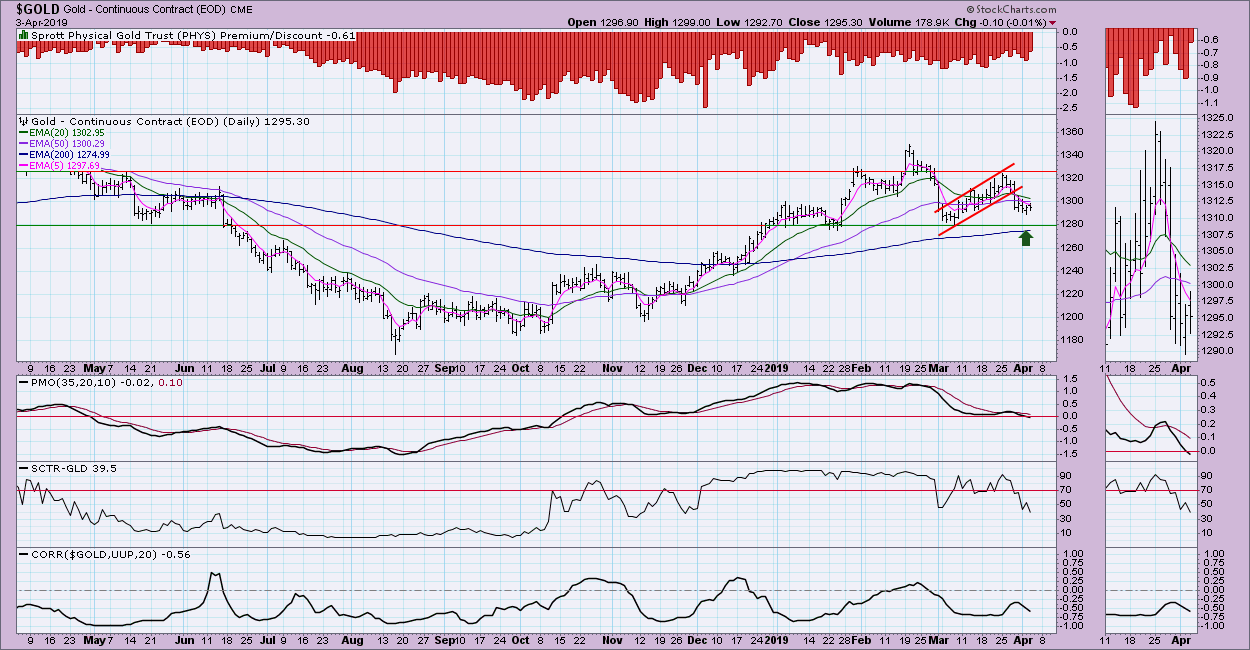
GOLD
IT Trend Model: BUY as of 10/19/2018
LT Trend Model: BUY as of 1/8/2019
GOLD Daily Chart: The short-term rising trend was busted last week, but price seems to have found a bottom. Unfortunately, the PMO and SCTR are declining. On the bright side, if I'm right that the Dollar is going to weaken in the coming week, that means Gold should rally. The reverse correlation is firming up again.
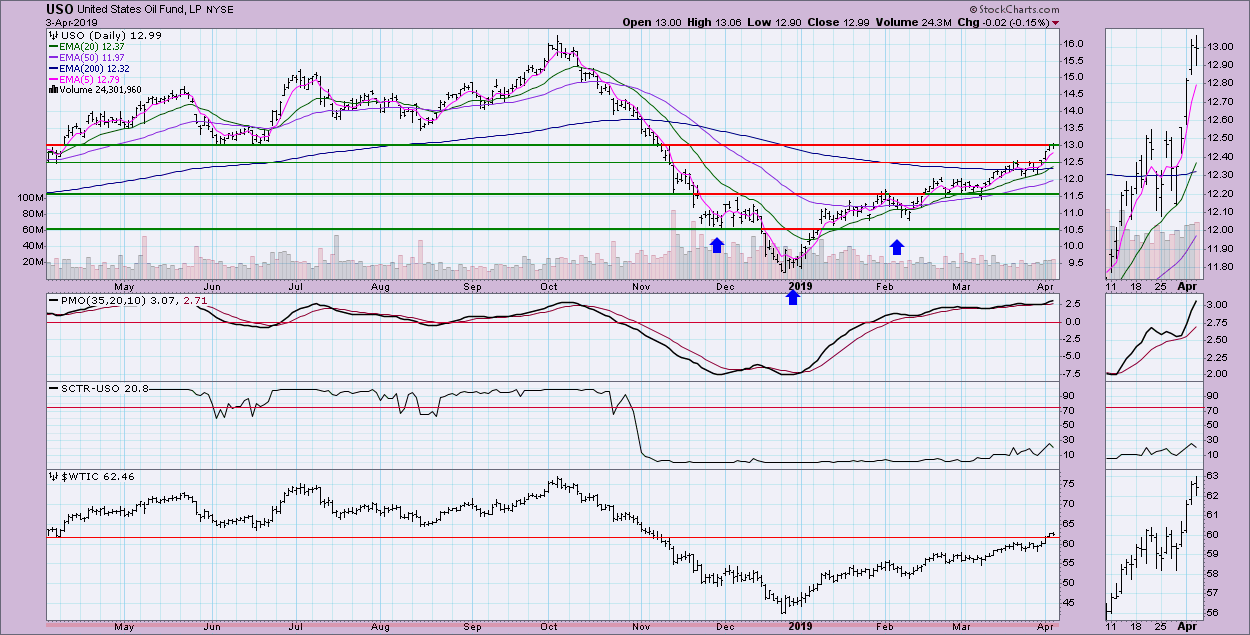
CRUDE OIL (USO)
IT Trend Model: BUY as of 2/19/2019
LT Trend Model: SELL as of 11/23/2018
USO Daily Chart: Price has reached strong resistance at $13.00. The PMO is rising nicely, but is somewhat overbought. This seems a perfect place for price to turn down, but the PMO does support higher prices. A weak Dollar could help oil out here. Like Gold, it tends to have a reverse correlation to the Dollar. The Dollar looks ready to continue lower. We could see USO move slightly above $13 and test the August low before pulling back.
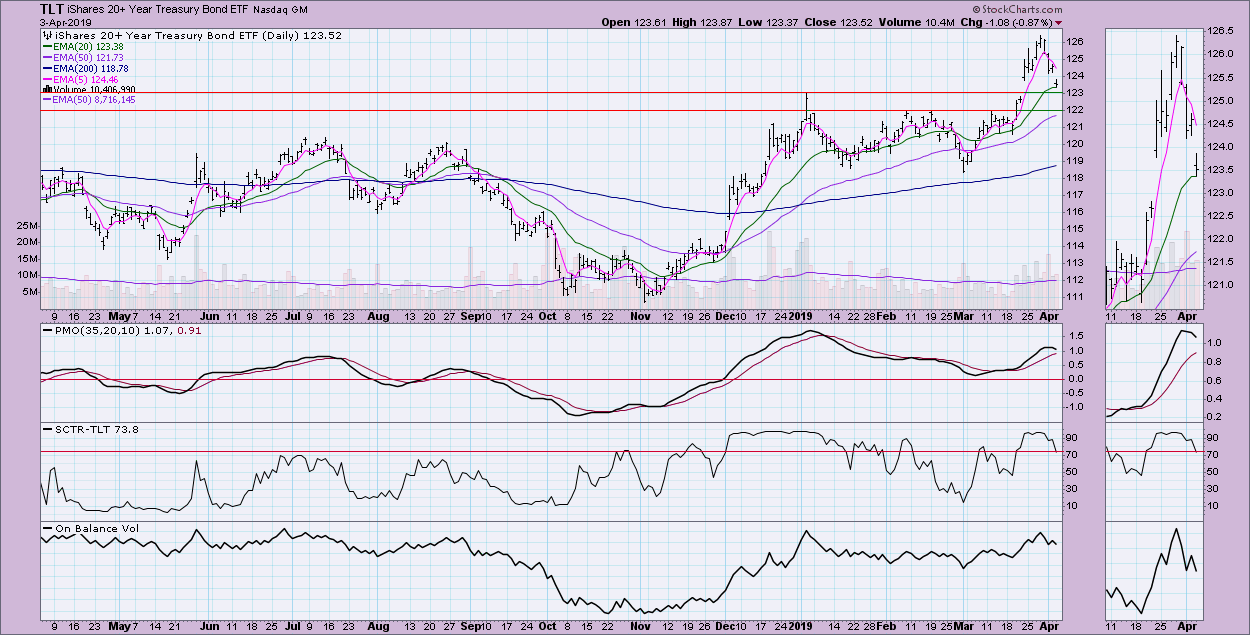
BONDS (TLT)
IT Trend Model: BUY as of 12/6/2018
LT Trend Model: BUY as of 1/2/2019
TLT Daily Chart: Bonds are pulling back sharply. Price is now at a fairly strong support level at the January and Feb/March highs. A PMO SELL signal or break below $122 would likely cause a waterfall decline. If you're holding this short-term, watch that support level.
Technical Analysis is a windsock, not a crystal ball.
Happy Charting!
- Erin
**Don't miss any of the DecisionPoint commentaries! Go to the "Notify Me" box toward the end of this blog page to be notified as soon as they are published.**
NOTE: The signal status reported herein is based upon mechanical trading model signals, specifically the DecisionPoint Trend Model. These define the implied bias of the price index based upon moving average relationships, but they do not necessarily call for a specific action. They are information flags that should prompt chart review. Further, they do not call for continuous buying or selling during the life of the signal. For example, a BUY signal will probably (but not necessarily) return the best results if action is taken soon after the signal is generated. Additional opportunities for buying may be found as price zigzags higher, but the trader must look for optimum entry points. Conversely, exit points to preserve gains (or minimize losses) may be evident before the model mechanically closes the signal.
Helpful DecisionPoint Links:
DecisionPoint Shared ChartList and DecisionPoint Chart Gallery
Price Momentum Oscillator (PMO)
Swenlin Trading Oscillators (STO-B and STO-V)


