 No changes on the DecisionPoint Scoreboards. The short-term is still weak; our short-term Swenlin Trading Oscillators turned down this week after barely reaching positive territory. TLT rallied further but was unable to push past strong resistance at the March high.
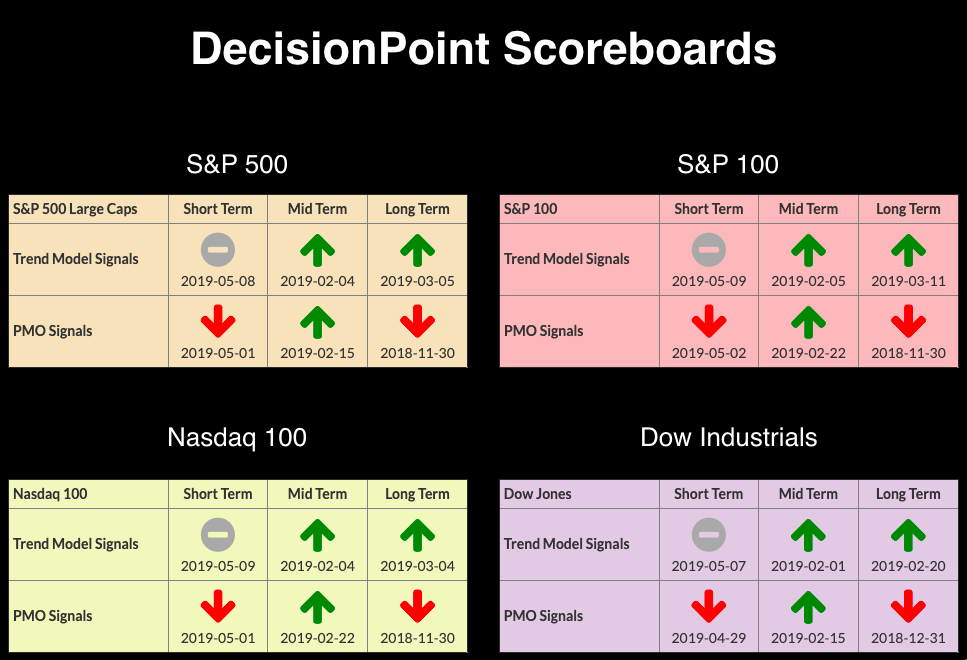
The DP Mid-Week Review presents a mid-week assessment of the trend and condition of the stock market (S&P 500), the U.S. Dollar, Gold, Crude Oil and Bonds.
Watch the latest episode of DecisionPoint on StockCharts TV's YouTube channel here!
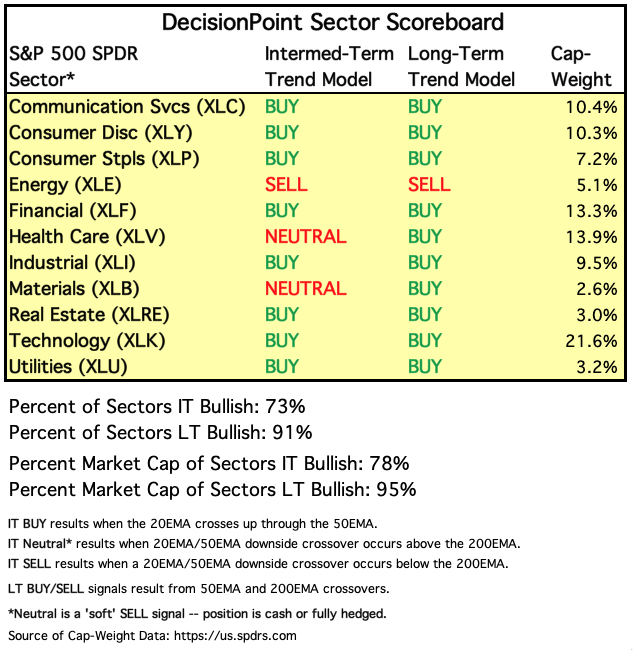
SECTORS
Each S&P 500 Index component stock is assigned to one, and only one, of eleven major sectors. This is a snapshot of the Intermediate-Term and Long-Term Trend Model signal status for those sectors.
STOCKS
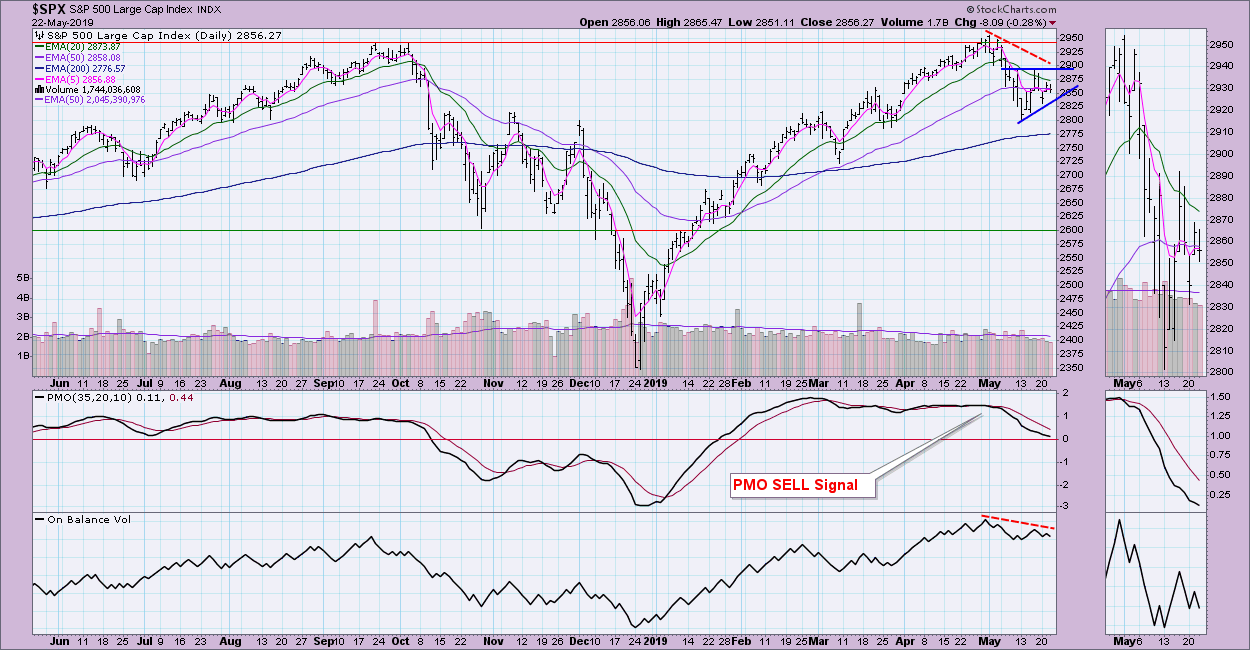
IT Trend Model: BUY as of 2/1/2019
LT Trend Model: BUY (SPY) as of 2/26/2019
SPY Daily Chart: I decided to include a 60-minute chart. I noticed a possible ascending triangle on the daily chart and, when I pulled up this chart, I confirmed it. If it isn't an ascending triangle, there is a short-term symmetrical triangle. The ascending triangle is a bullish pattern. Symmetrical triangles can break in either direction, but generally break in the direction of the prior dominant trend. Since the triangle is coming off a declining trend, that would suggest a breakdown.
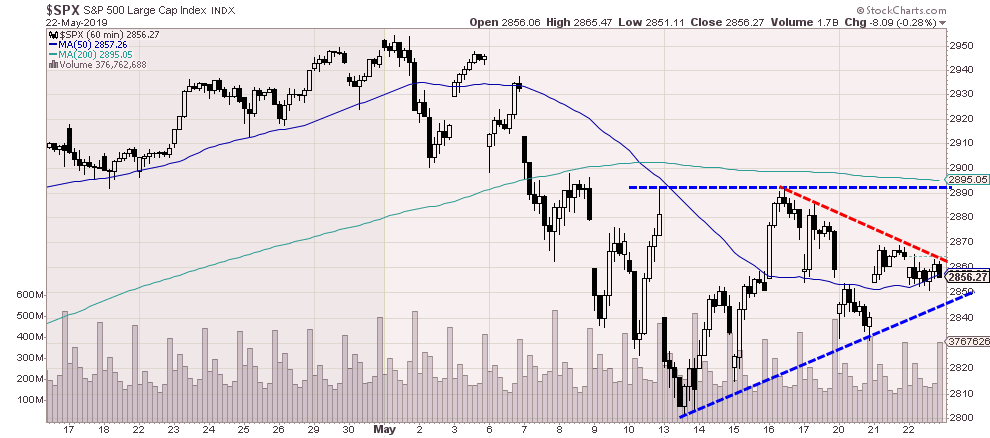
If rising bottoms are broken, the pattern falls apart, but the OBV is confirming the downtrend. The PMO decelerated and is staying just above the zero line which is somewhat bullish. Had I not seen the short-term indicators, I would have more confidence in the ascending triangle.
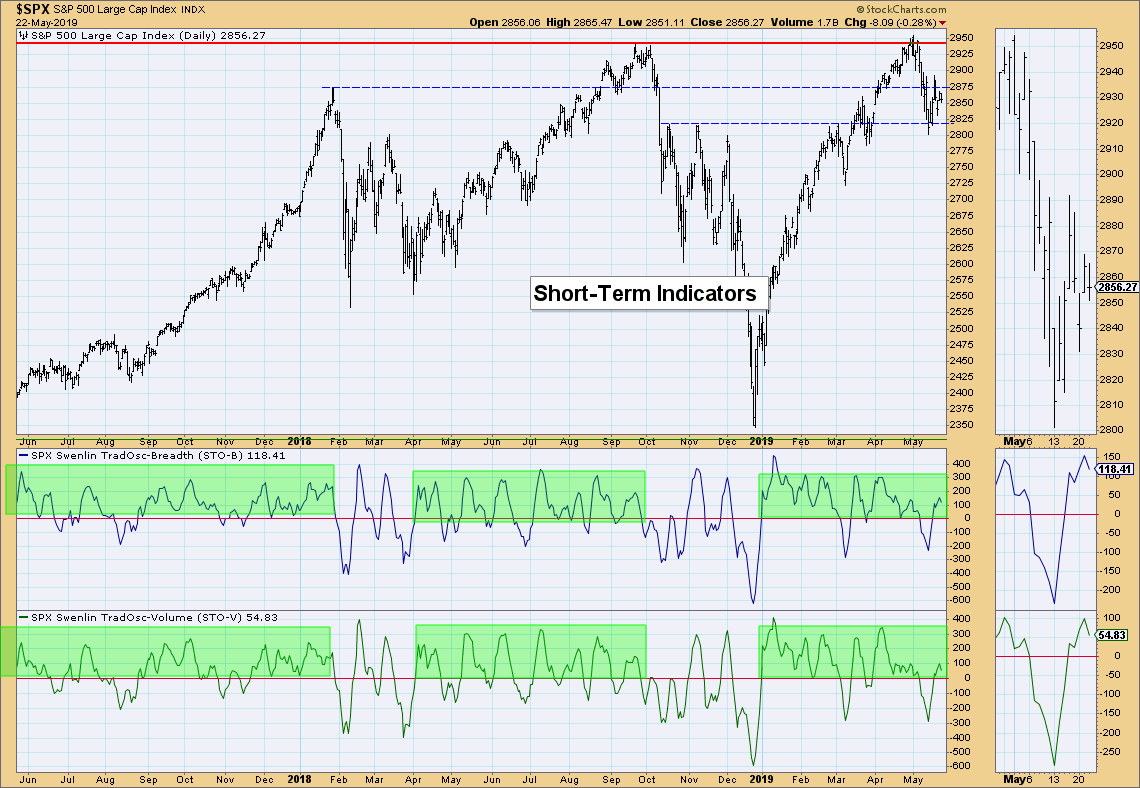
Climactic Market Indicators: Not much on the climactic indicator chart. I note that volume is petering out despite a short-term rising trend. The VIX and other breadth indicators are neutral.

Short-Term Market Indicators: Both indicators managed to get back into positive territory, but have turned down for a second time. For higher confidence in the rally from 2800, we want to see these indicators oscillating above zero.
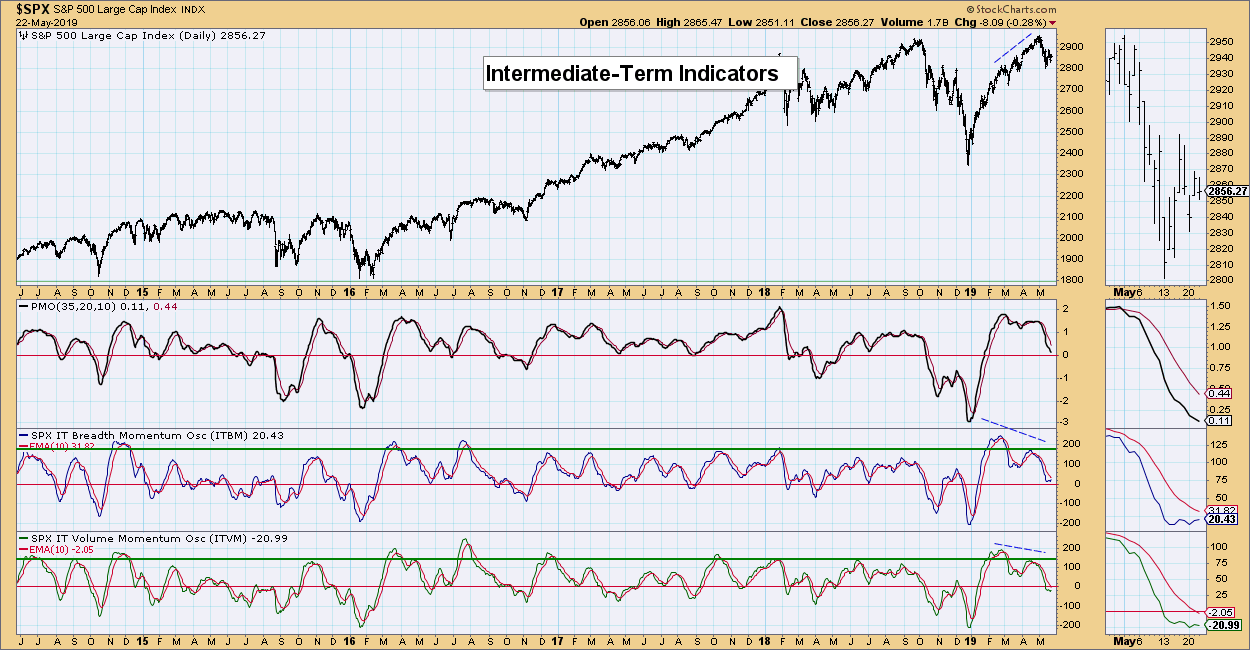
Intermediate-Term Market Indicators: These indicators are fighting gravity. It appears they want to resume the rise, but price is not providing the fuel to push them higher. I look at these indicators as mostly neutral.
Conclusion: Mixed messages continue. Short-term indicators are very bearish, but I spot a short-term bullish ascending triangle. John Murphy noted in his article today that defensive sectors are starting to show leadership in this rally, which is generally an overall bad sign for the market.
DOLLAR (UUP)
IT Trend Model: BUY as of 2/7/2019
LT Trend Model: BUY as of 5/25/2018
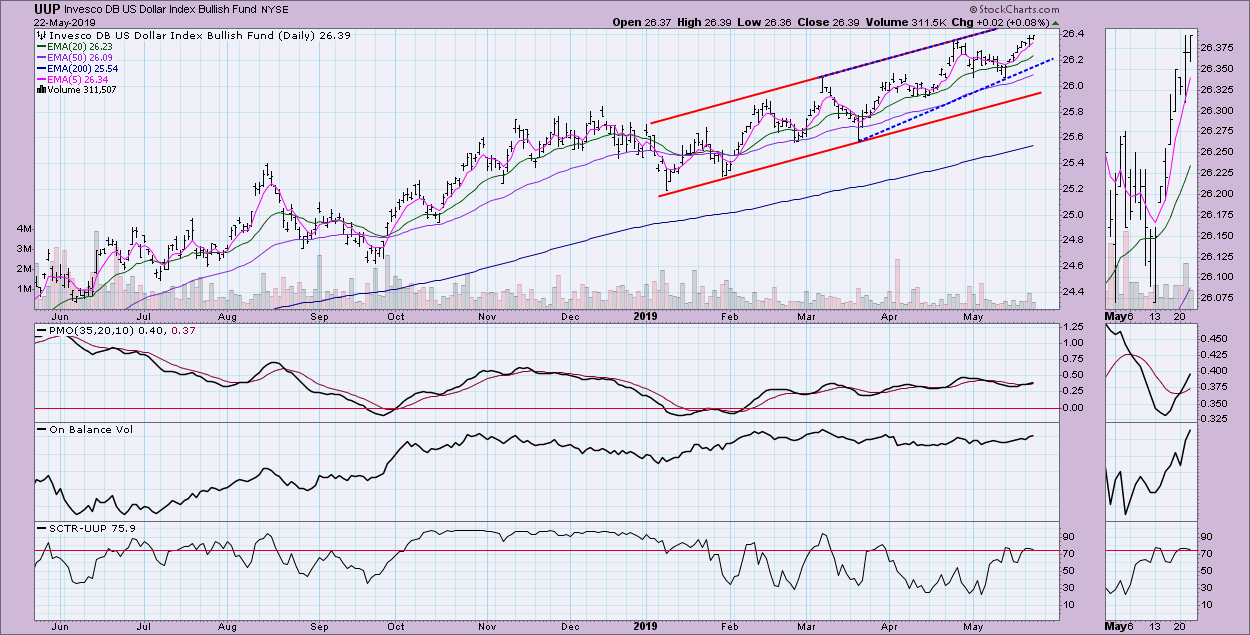
UUP Daily Chart: The Dollar remains in a steady rising trend channel. In the short-term, there is a bearish ascending wedge, with plenty of room for price to push higher and reach the top of the trend channel. That would still keep the bearish wedge in play. The PMO has been in a gentle rising trend. I don't like that the OBV tops are not rising with price. At this point I'm bullish on the Dollar. I'm looking for it to test the top of the channel based on the PMO BUY signal that just came in.
GOLD
IT Trend Model: Neutral as of 4/16/2019
LT Trend Model: BUY as of 1/8/2019
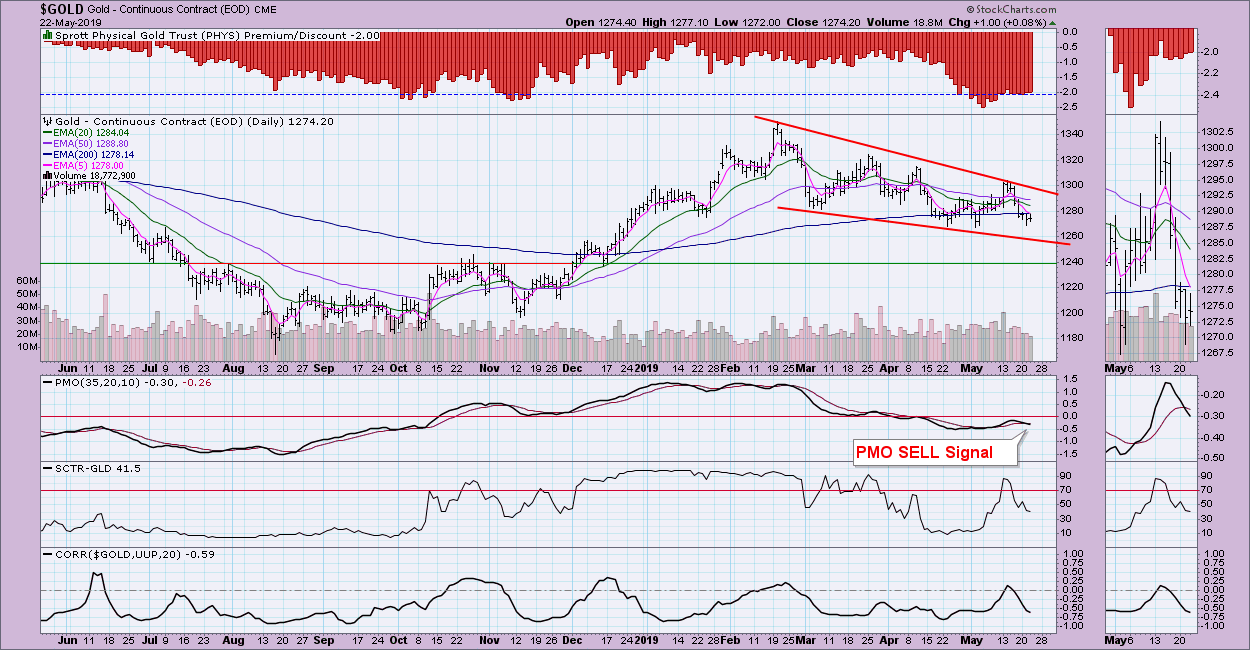
GOLD Daily Chart: I think a bullish declining wedge is still viable, but the PMO certainly isn't inspiring confidence that it will execute. It likely will test the bottom of the wedge. When the Dollar reaches the top of its trend channel and turns down, look for Gold to have reached the bottom of this wedge and be ready to rally to a breakout. For now, lower prices are likely.
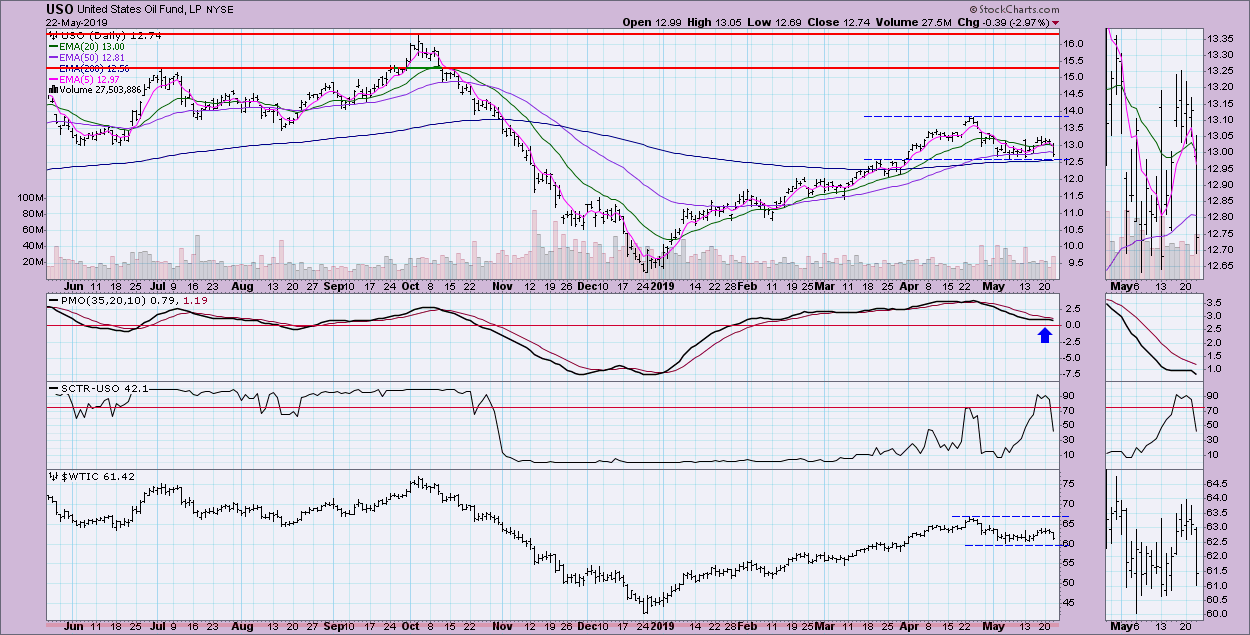
CRUDE OIL (USO)
IT Trend Model: BUY as of 2/19/2019
LT Trend Model: SELL as of 11/23/2018
USO Daily Chart: The trading range for Oil persists. The good news is that price for USO is at the bottom of the consolidation zone. The bad news is that a PMO topped below its signal line. The PMO suggests prices will certainly test support at $12.50. $WTIC still has room to fall further as well and reach the bottom of its current trading range.
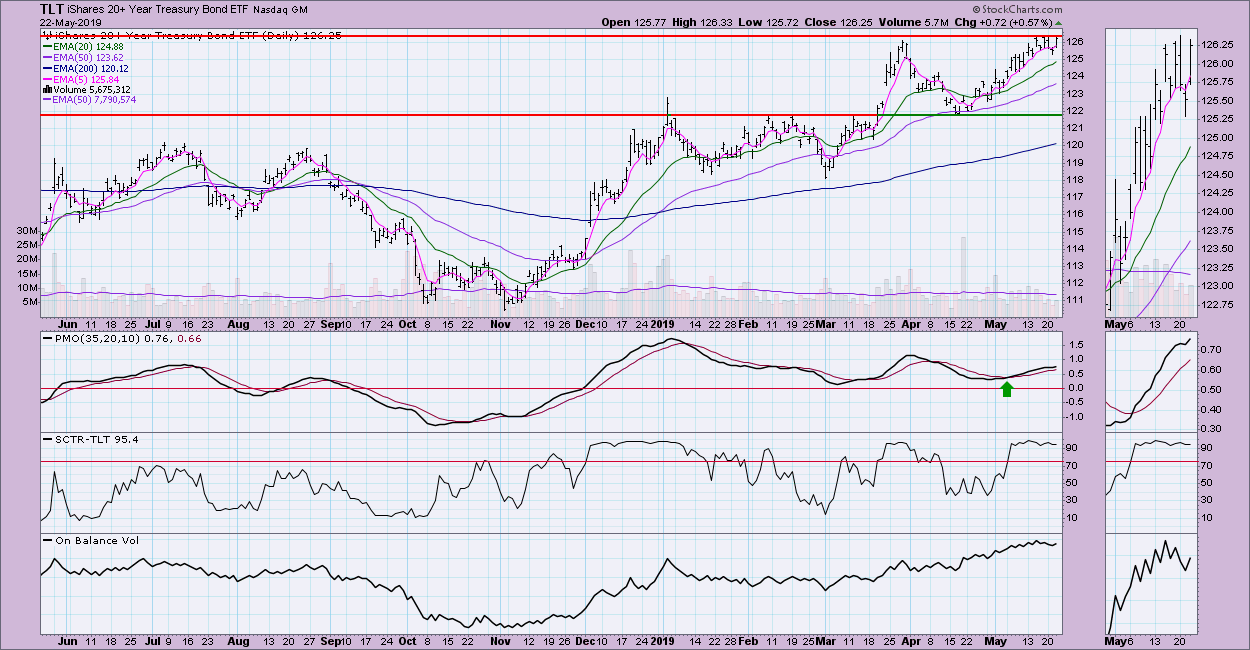
BONDS (TLT)
IT Trend Model: BUY as of 12/6/2018
LT Trend Model: BUY as of 1/2/2019
TLT Daily Chart: TLT has been unable to overcome resistance at about $126.25 for a week now. However, the PMO just turned back up and is far from being overbought. I'll be very surprised if this resistance holds and price fails here. I'm looking for a breakout. This seems to be more of a pause than anything else.
Technical Analysis is a windsock, not a crystal ball.
Happy Charting!
- Erin
Email: erinh@stockcharts.com
**Don't miss any of the DecisionPoint commentaries! Go to the "Notify Me" box toward the end of this blog page to be notified as soon as they are published.**
NOTE: The signal status reported herein is based upon mechanical trading model signals, specifically, the DecisionPoint Trend Model. These define the implied bias of the price index based upon moving average relationships, but they do not necessarily call for a specific action. They are information flags that should prompt chart review. Further, they do not call for continuous buying or selling during the life of the signal. For example, a BUY signal will probably (but not necessarily) return the best results if action is taken soon after the signal is generated. Additional opportunities for buying may be found as price zigzags higher, but the trader must look for optimum entry points. Conversely, exit points to preserve gains (or minimize losses) may be evident before the model mechanically closes the signal.
Helpful DecisionPoint Links:
DecisionPoint Shared ChartList and DecisionPoint Chart Gallery
Price Momentum Oscillator (PMO)
Swenlin Trading Oscillators (STO-B and STO-V)


