 The market has cooled this week. There are no changes on the DP Scoreboard indexes, nor on the Sector Scoreboard. Indicators are starting to look worrisome, but we do need to see some digestion of last week's rally. Gold has been on fire! I'm starting to hear rumblings about a bearish move on Gold. I'll examine the positives and negatives in its section following the market review.
The DecisionPoint Alert presents a mid-week assessment of the trend and condition of the stock market (S&P 500), the U.S. Dollar, Gold, Crude Oil and Bonds.
Watch the latest episode of DecisionPoint on StockCharts TV's YouTube channel here!
GLOBAL MARKETS
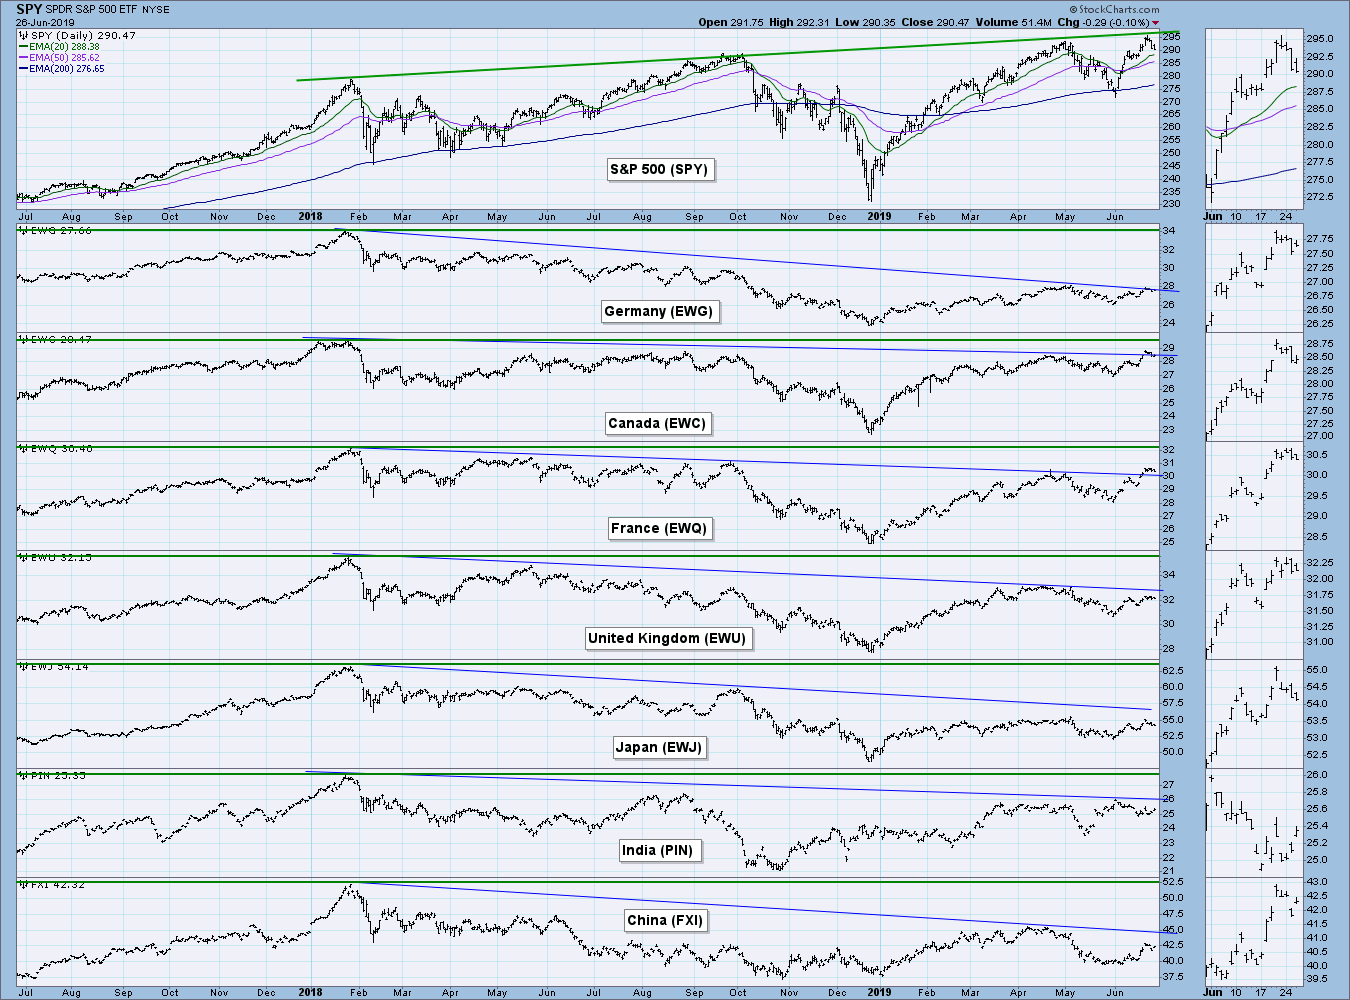
France (EWQ) is showing a tiny breakout. However, it's still worth noting that most global ETFs remain well below their highs in 2018, while the SPY continues to make new all-time highs.
BROAD MARKET INDEXES
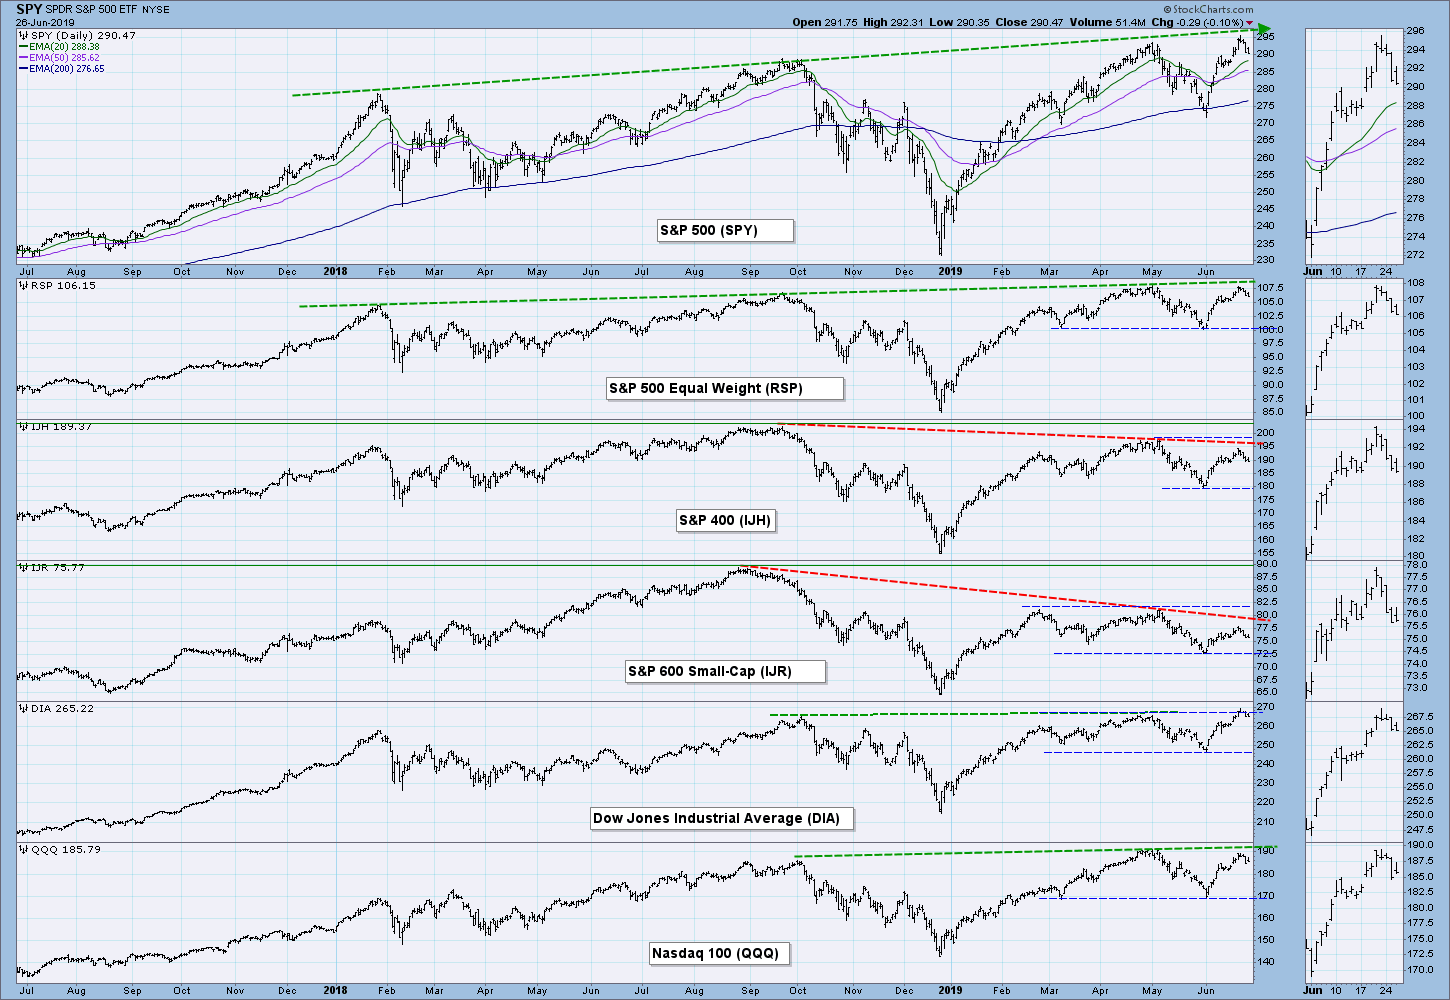
Small-caps continue to lag. Typically, a rising Dollar favors small-caps, but IJR didn't seem to take much advantage of that. The Dollar is now breaking down, meaning those tailwinds won't be there to help relative performance.
SECTORS
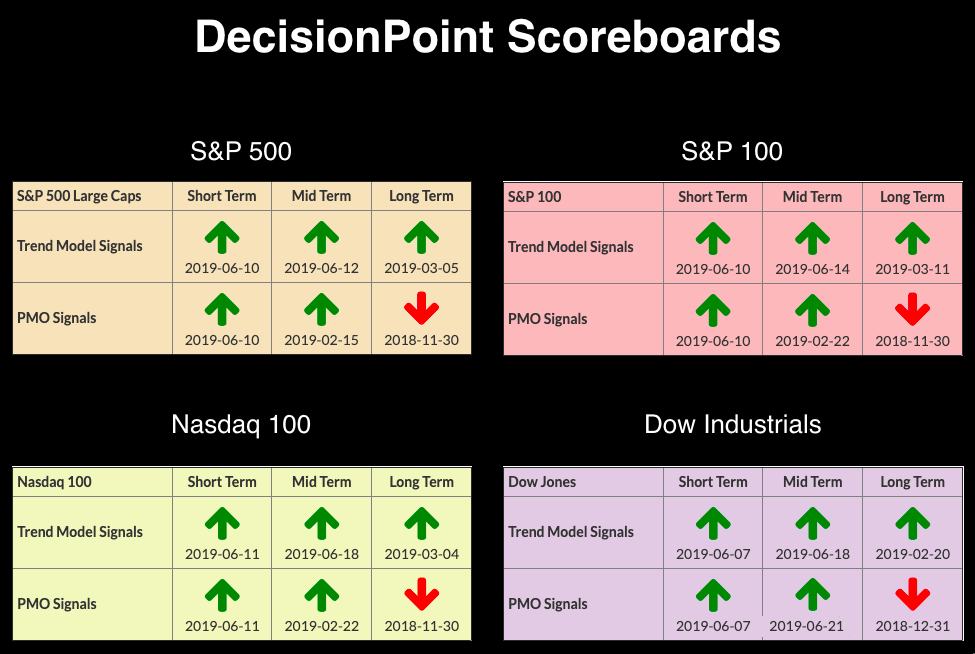
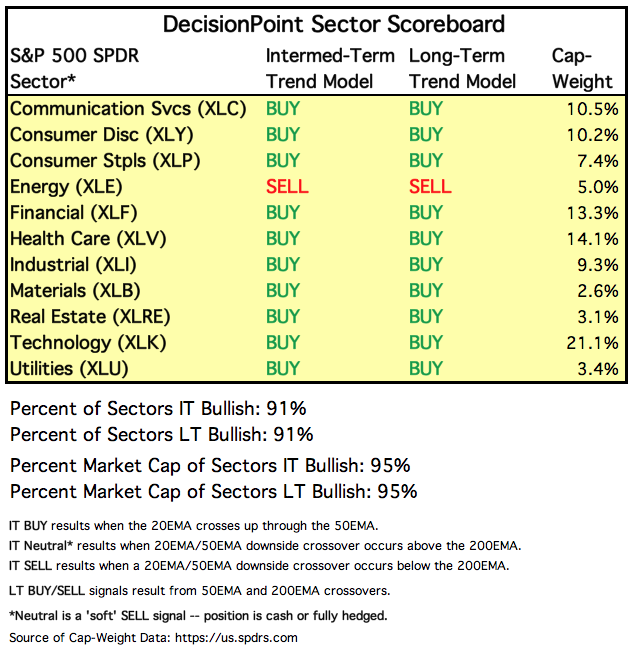
Each S&P 500 Index component stock is assigned to one, and only one, of eleven major sectors. This is a snapshot of the Intermediate-Term and Long-Term Trend Model signal status for those sectors.
STOCKS
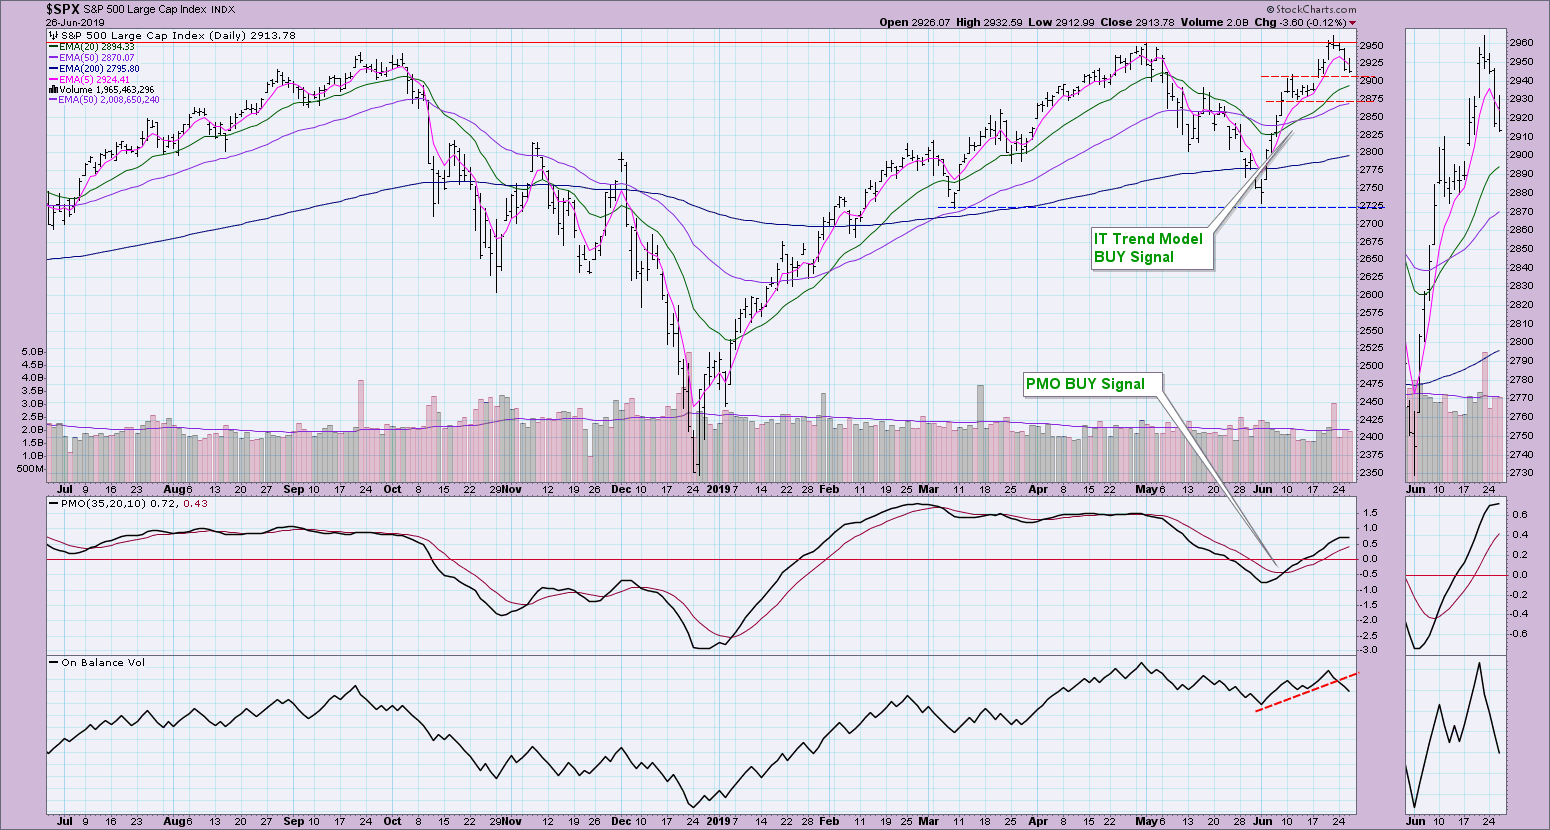
IT Trend Model: BUY as of 6/11/2019
LT Trend Model: BUY (SPY) as of 2/26/2019
SPX Daily Chart: After making new all-time highs, price has been pulling back and is now near short-term support at the top of the previous gap. I suspect, given the topping PMO and breakdown on the OBV shown below, that we will see the gap closed.
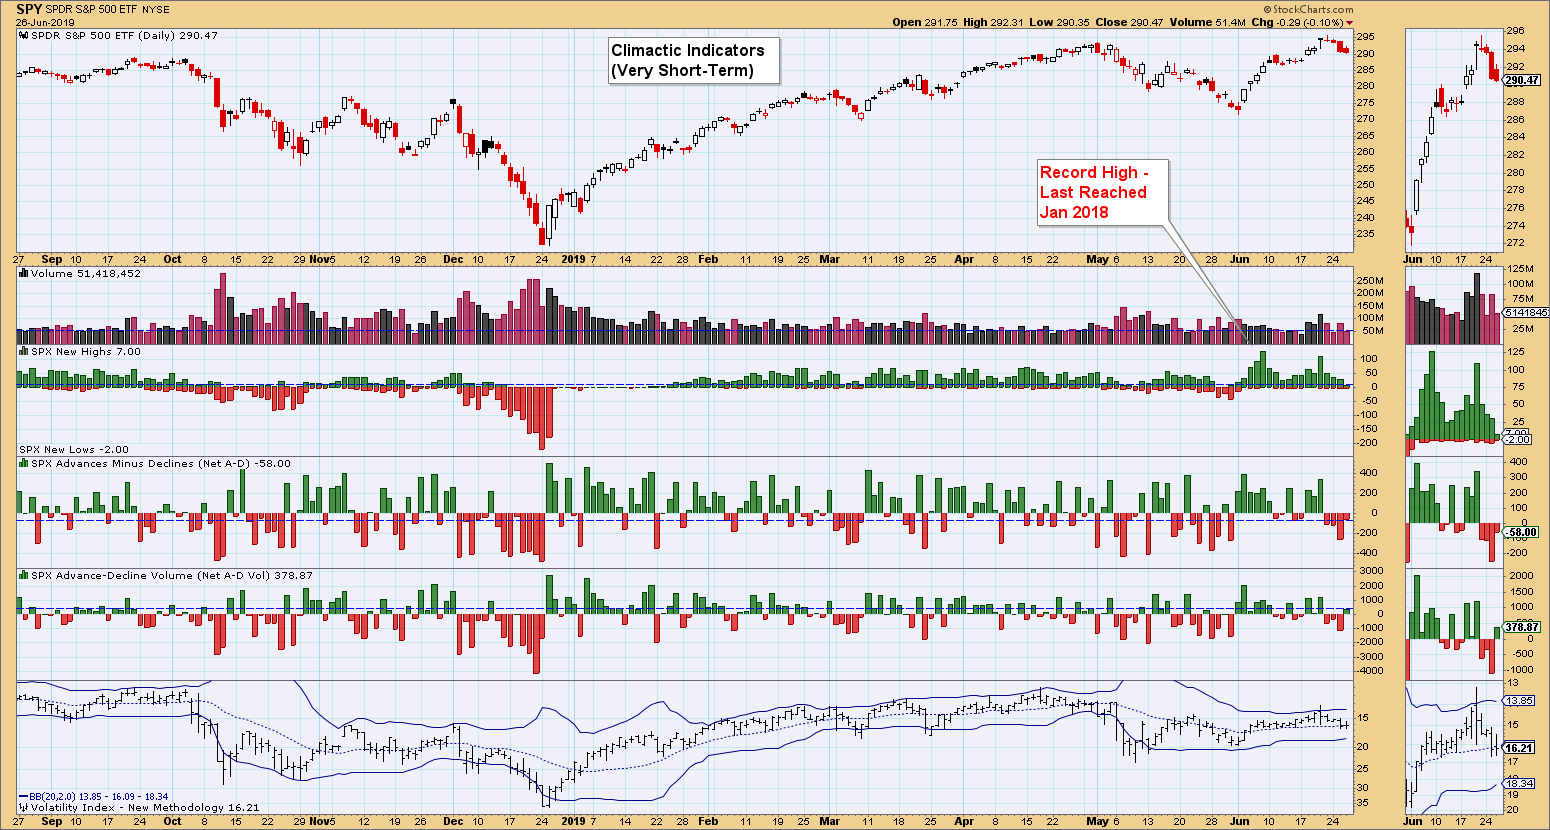
Climactic Market Indicators: Neutral readings across the board, so not helpful today. Yesterday, we saw some climactic activity on breadth, which could suggest a selling initiation.
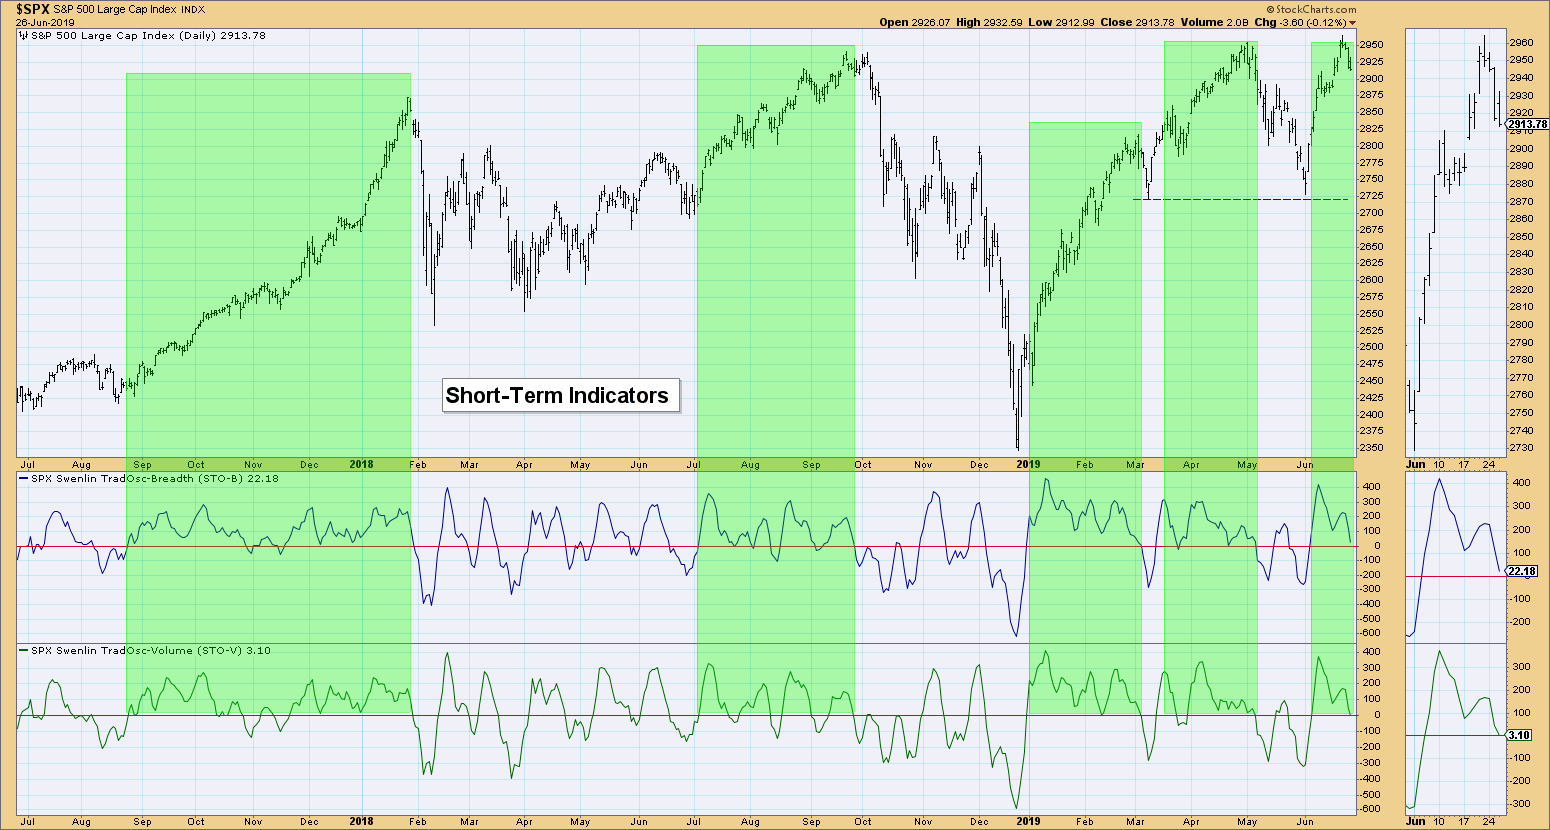
Short-Term Market Indicators: I presented this chart on MarketWatchers LIVE yesterday, where Tom Bowley, Mary Ellen McGonagle and I debated the short-term outlook. I wasn't that bearish, but I was bearish enough to disagree with Tom and Mary Ellen that all-time highs will be hit in the next two weeks. These indicators are getting somewhat bearish. We don't want to see them go negative - a lower top is not fertile ground for new all-time highs. I've highlighted oscillations above the zero line on both indicators. If the STOs oscillate above zero, we see rallies. Yesterday, it appeared we would maintain positive readings, but today the picture isn't as bright.
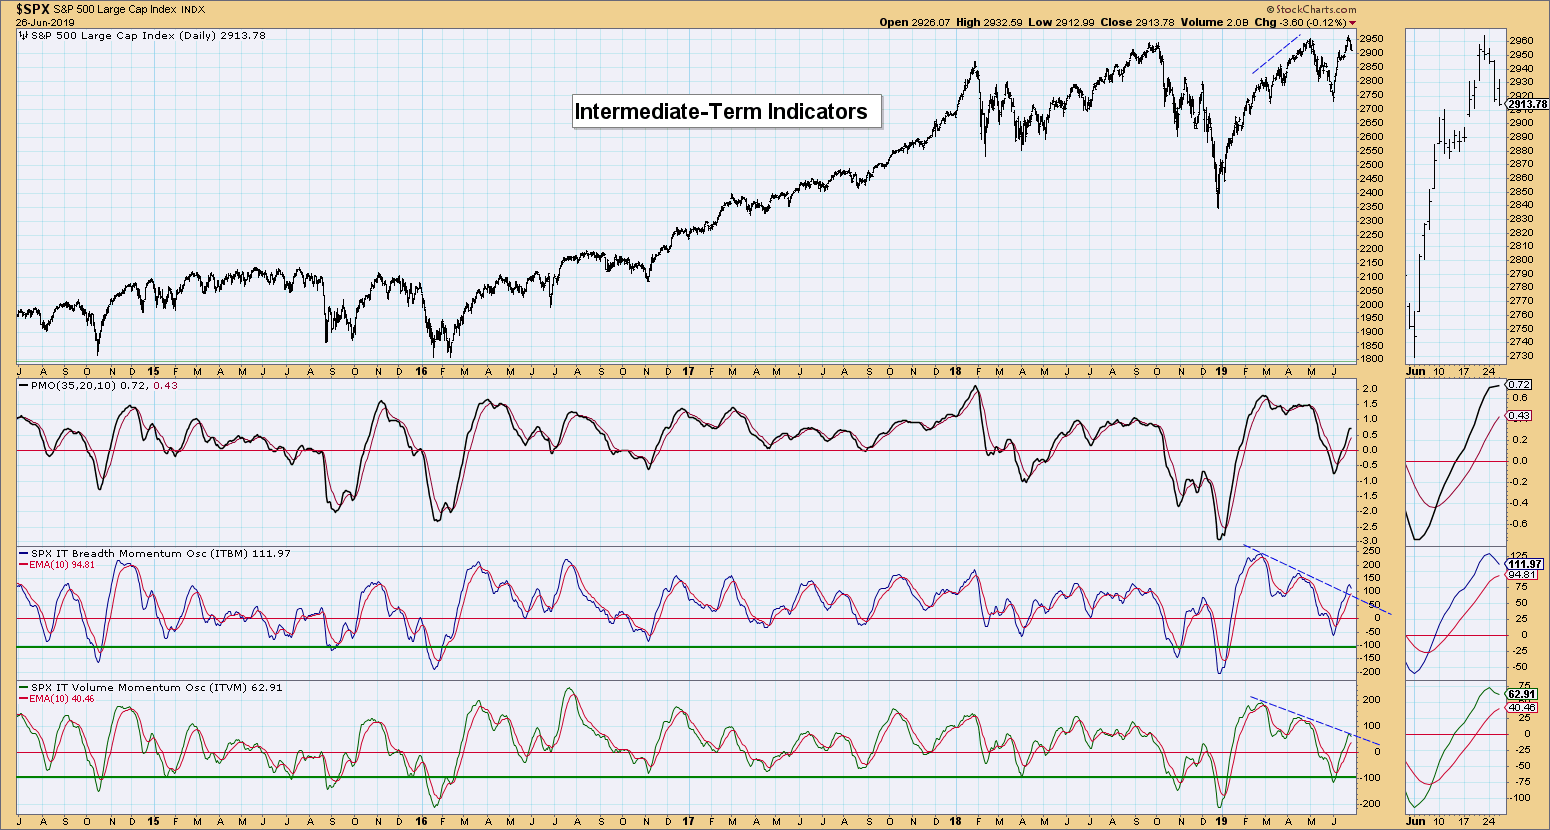
Intermediate-Term Market Indicators: I was encouraged by the breakout on the ITBM, but both indicators have now topped. I won't get too bearish at this point. I need to see negative crossovers.
Conclusion: Indicators suggest this pullback could continue. I suspect we will see lower prices to close the gap on the SPX, likely followed by sideways action. There isn't enough evidence yet to suspect a correction.
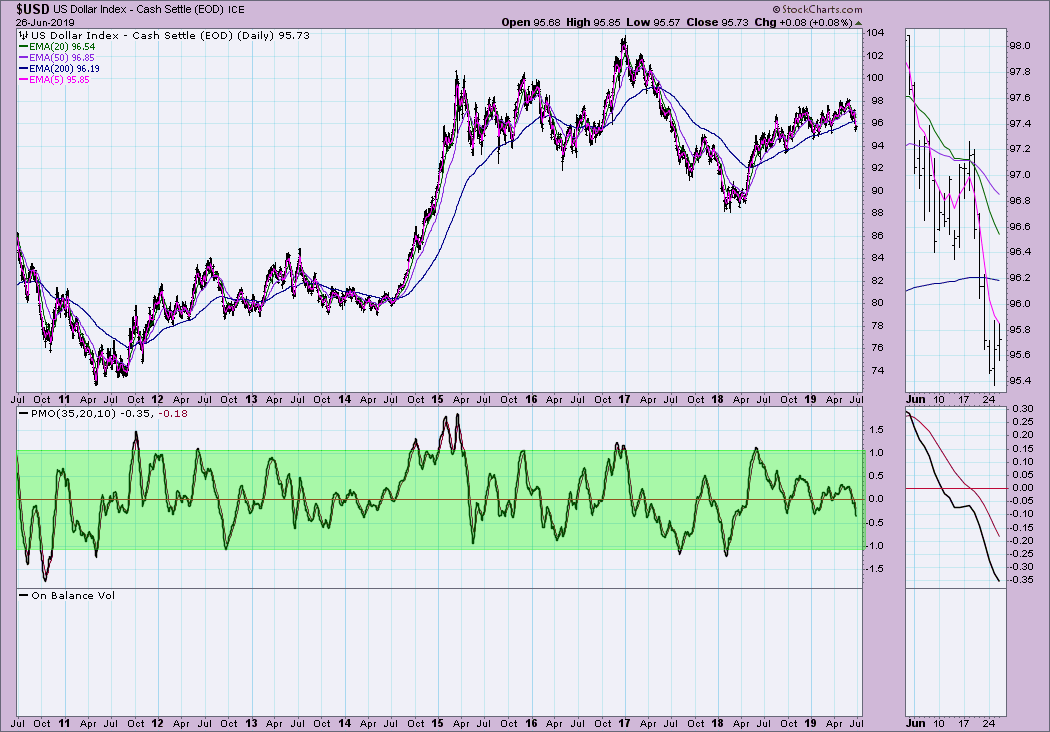
DOLLAR (UUP)
IT Trend Model: BUY as of 2/7/2019
LT Trend Model: BUY as of 5/25/2018
UUP Daily Chart: I've annotated multiple areas of support for UUP. It has managed to bounce off the April low.
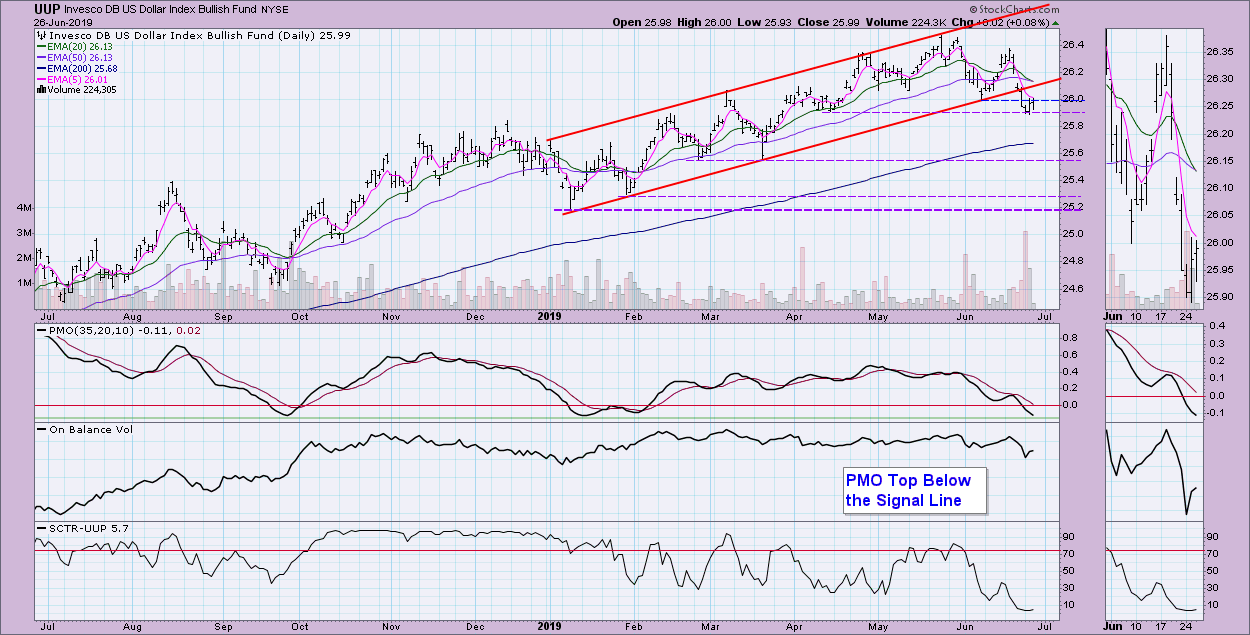
The PMO is reaching annual lows, but could move much lower if you look at a longer-term daily chart.
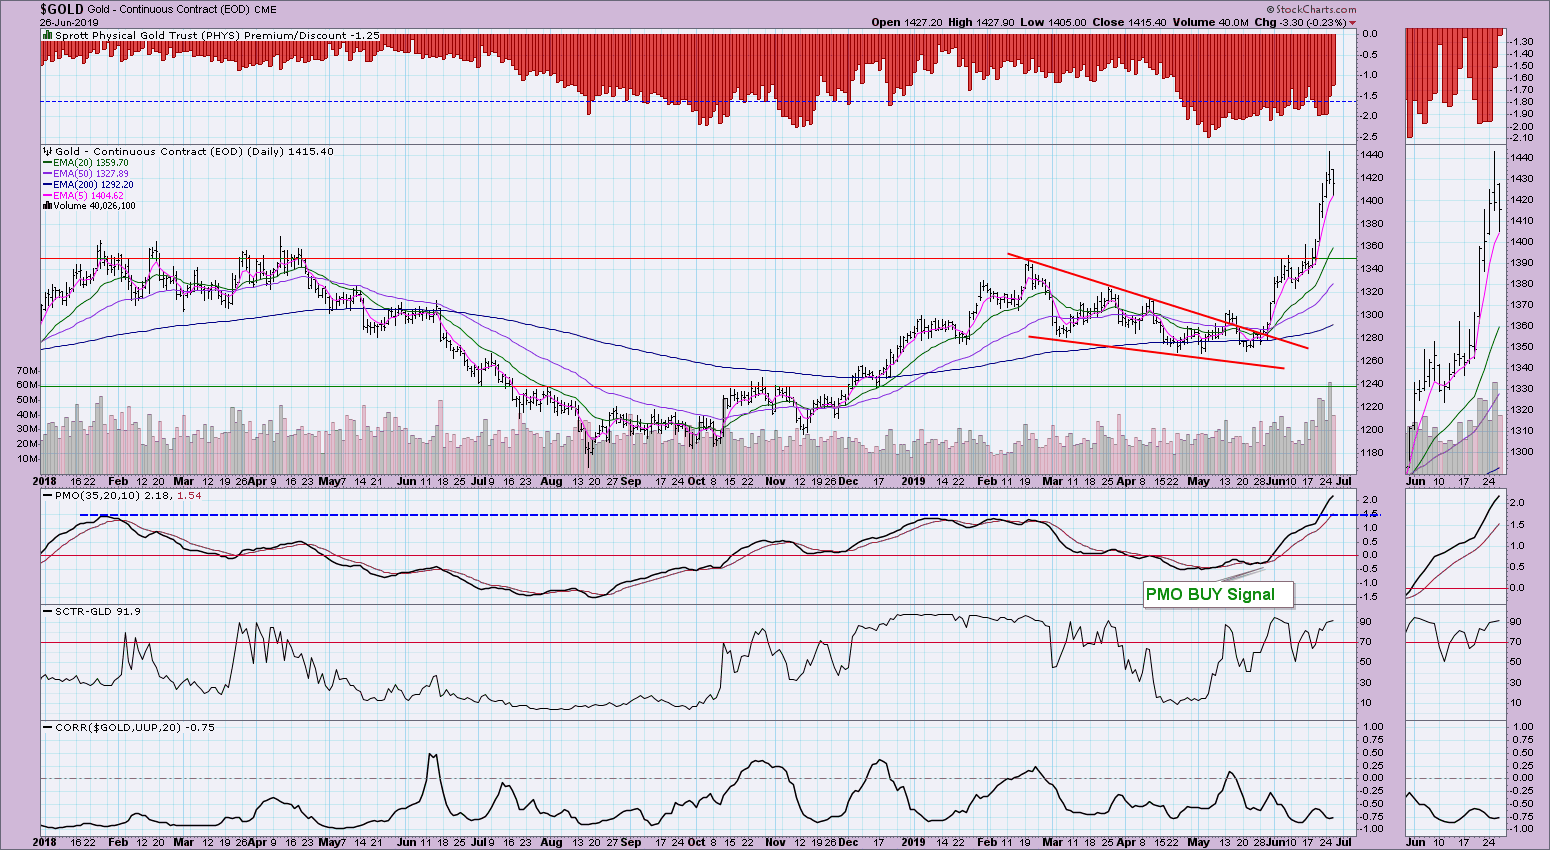
GOLD
IT Trend Model: BUY as of 6/3/2019
LT Trend Model: BUY as of 1/8/2019
GOLD Daily Chart: Gold finally pulled back after a meteoric rise. There can be little question that price is overbought, but does this mean we need to move bearish? In the short-term, the answer is likely yes. Discounts have lowered, but they are still on the high side overall. The PMO certainly looks worrisome as it sailed back the highs in early 2019 and January of 2018.
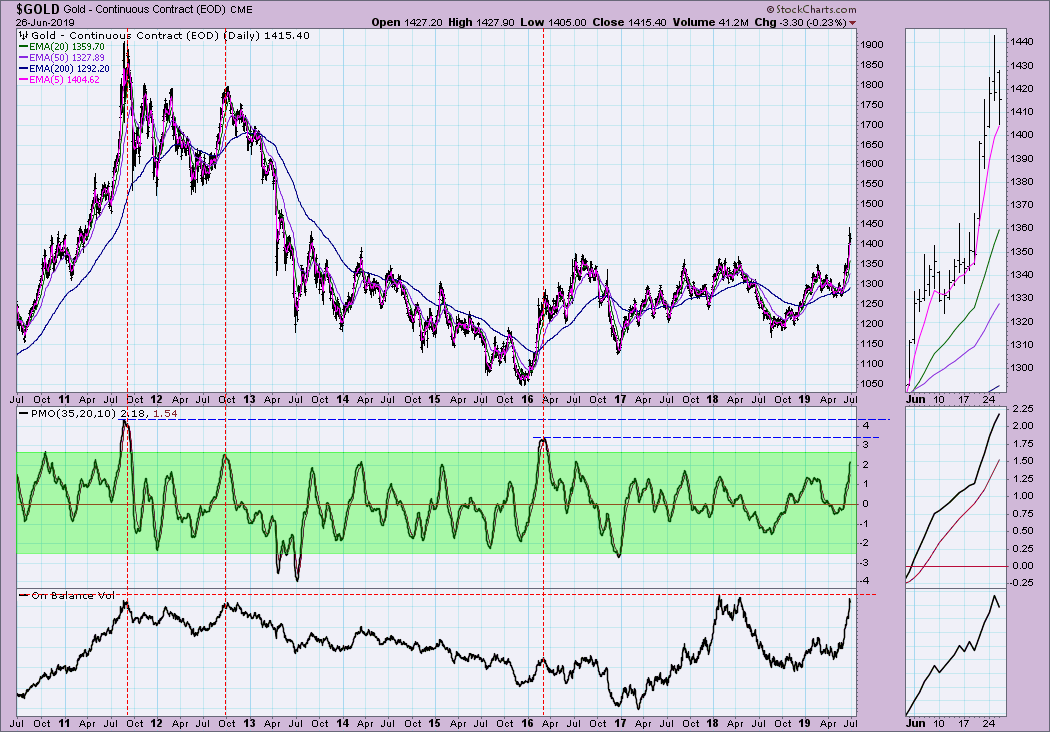
Note on the long-term daily chart below that the PMO range is between -2.5 and +2.5. A reading of 2.18 is somewhat overbought, but we can see that it was over 4.0 in 2011 and at 3.5 in 2016. Until the PMO rolls over, I remain bullish on Gold. I suspect the 1370 level will hold as support on a throwback to the breakout point. I don't think we need to get bearish in the intermediate term. If you are trading Gold short-term and don't want to follow it down to support (at that 1370 level) as it digests this multi-year breakout, then think bearish.
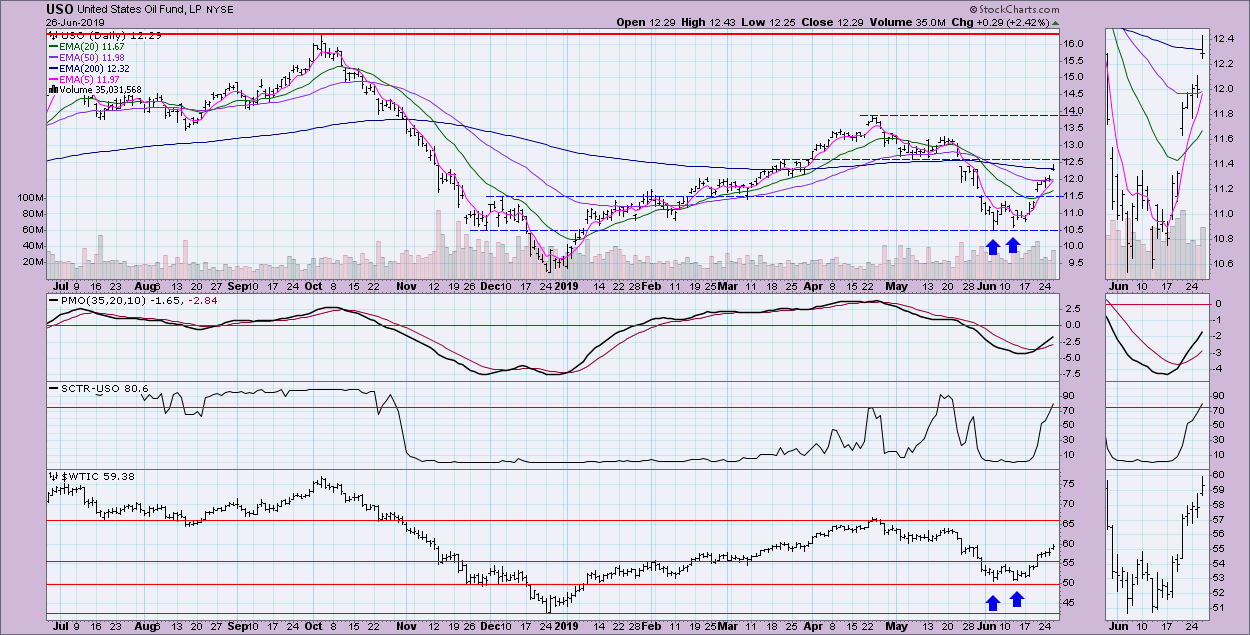
CRUDE OIL (USO)
IT Trend Model: Neutral as of 5/30/2019
LT Trend Model: SELL as of 6/4/2019
USO Daily Chart: USO is nearing the minimum upside target of the short-term double-bottom. As stated, this is a "minimum" upside target, so it could push through $12.50. Resistance is at the April top, but it could struggle at the May tops at $13.25. However, the PMO is very positive and the SCTR has soared quickly into the "hot zone" above 75.
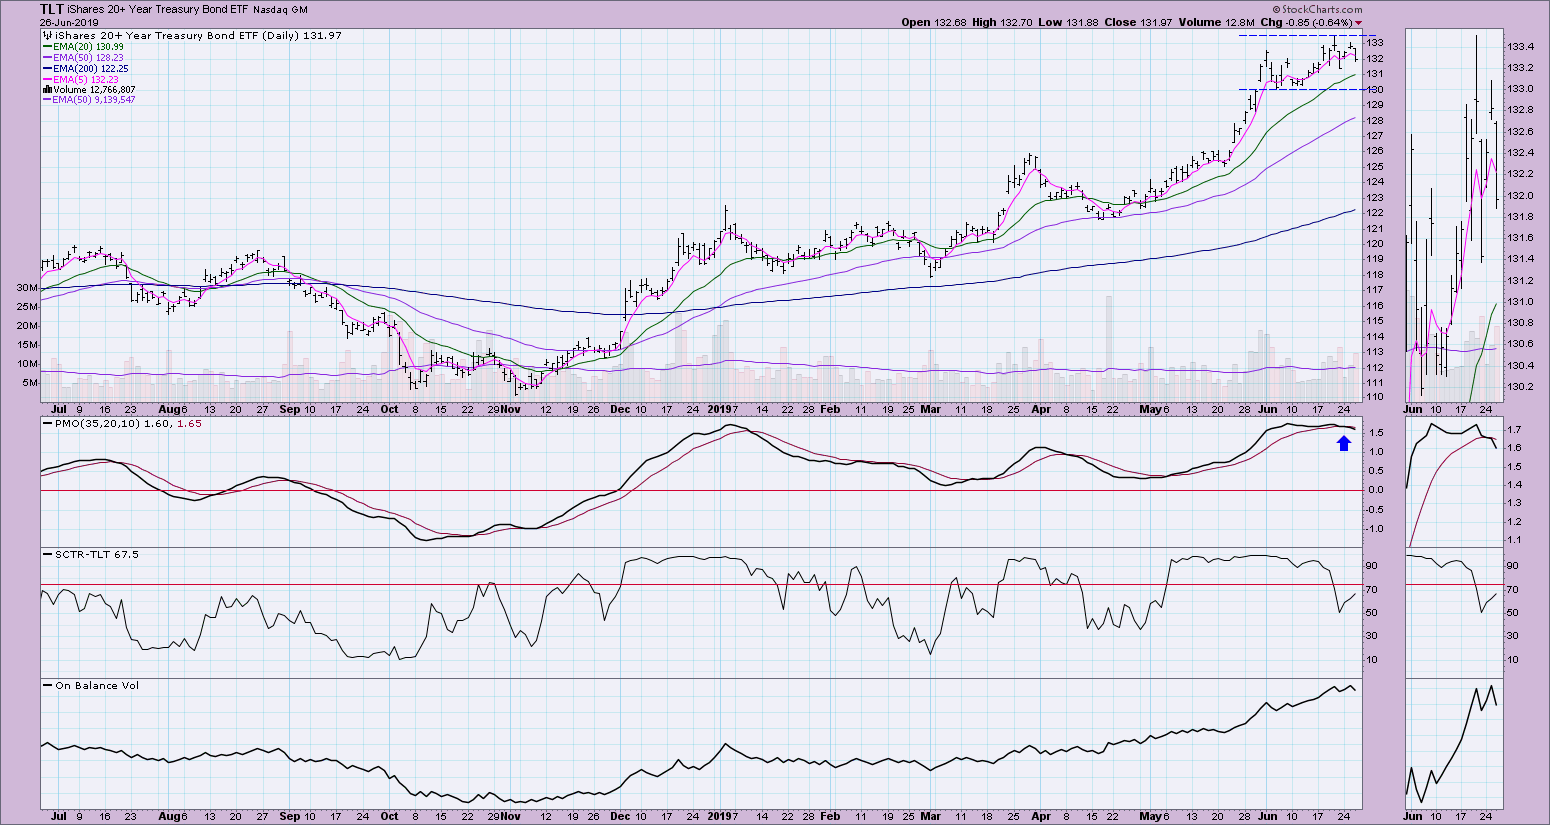
BONDS (TLT)
IT Trend Model: BUY as of 12/6/2018
LT Trend Model: BUY as of 1/2/2019
TLT Daily Chart: Following a parabolic rise in May, Bonds seem to have lost their shine. The PMO has triggered a SELL signal in overbought territory, which suggests lower prices. However, I'm not seeing much deterioration on the OBV right now, so I'm partial to price moving within this current trading range (between $130 and $133.50).
Technical Analysis is a windsock, not a crystal ball.
Happy Charting!
- Erin
Email: erinh@stockcharts.com
**Don't miss any of the DecisionPoint commentaries! Go to the "Notify Me" box toward the end of this blog page to be notified as soon as they are published.**
NOTE: The signal status reported herein is based upon mechanical trading model signals, specifically, the DecisionPoint Trend Model. They define the implied bias of the price index based upon moving average relationships, but they do not necessarily call for a specific action. They are information flags that should prompt chart review. Further, they do not call for continuous buying or selling during the life of the signal. For example, a BUY signal will probably (but not necessarily) return the best results if action is taken soon after the signal is generated. Additional opportunities for buying may be found as price zigzags higher, but the trader must look for optimum entry points. Conversely, exit points to preserve gains (or minimize losses) may be evident before the model mechanically closes the signal.
Helpful DecisionPoint Links:
DecisionPoint Shared ChartList and DecisionPoint Chart Gallery
Price Momentum Oscillator (PMO)
Swenlin Trading Oscillators (STO-B and STO-V)


