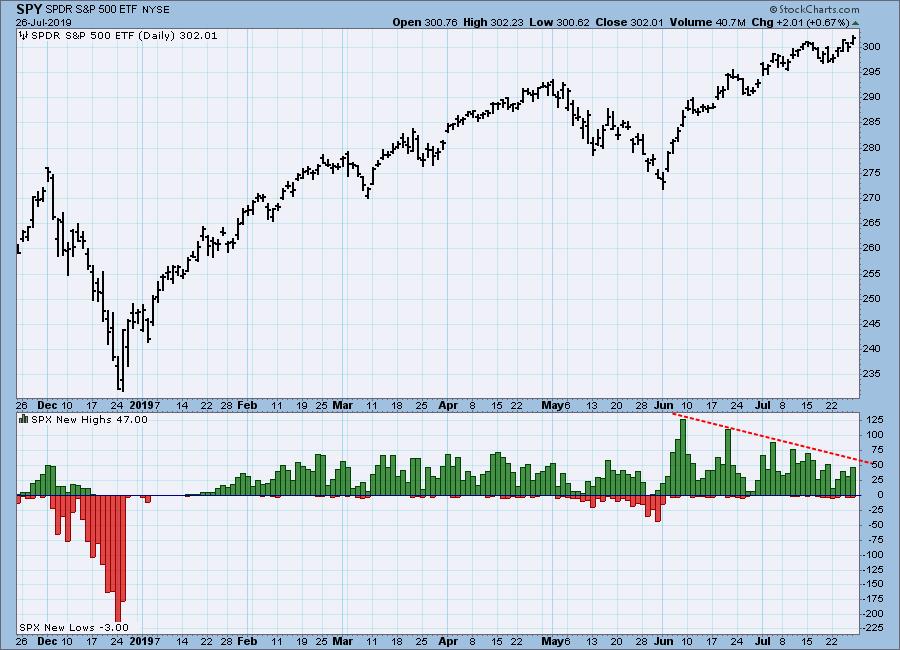
The S&P 500 Index has been making all-time highs for over a month, but new highs for S&P 500 component stocks has been fading since the rally initiation spike in early-June. This indicates that participation is narrowing and that largest-cap stocks are doing most of the work. This is not a healthy circumstance, at least in the short term.
The DecisionPoint Weekly Wrap presents an end-of-week assessment of the trend and condition of the stock market (S&P 500), the U.S. Dollar, Gold, Crude Oil, and Bonds.
Watch the latest episode of DecisionPoint on StockCharts TV's YouTube channel here!
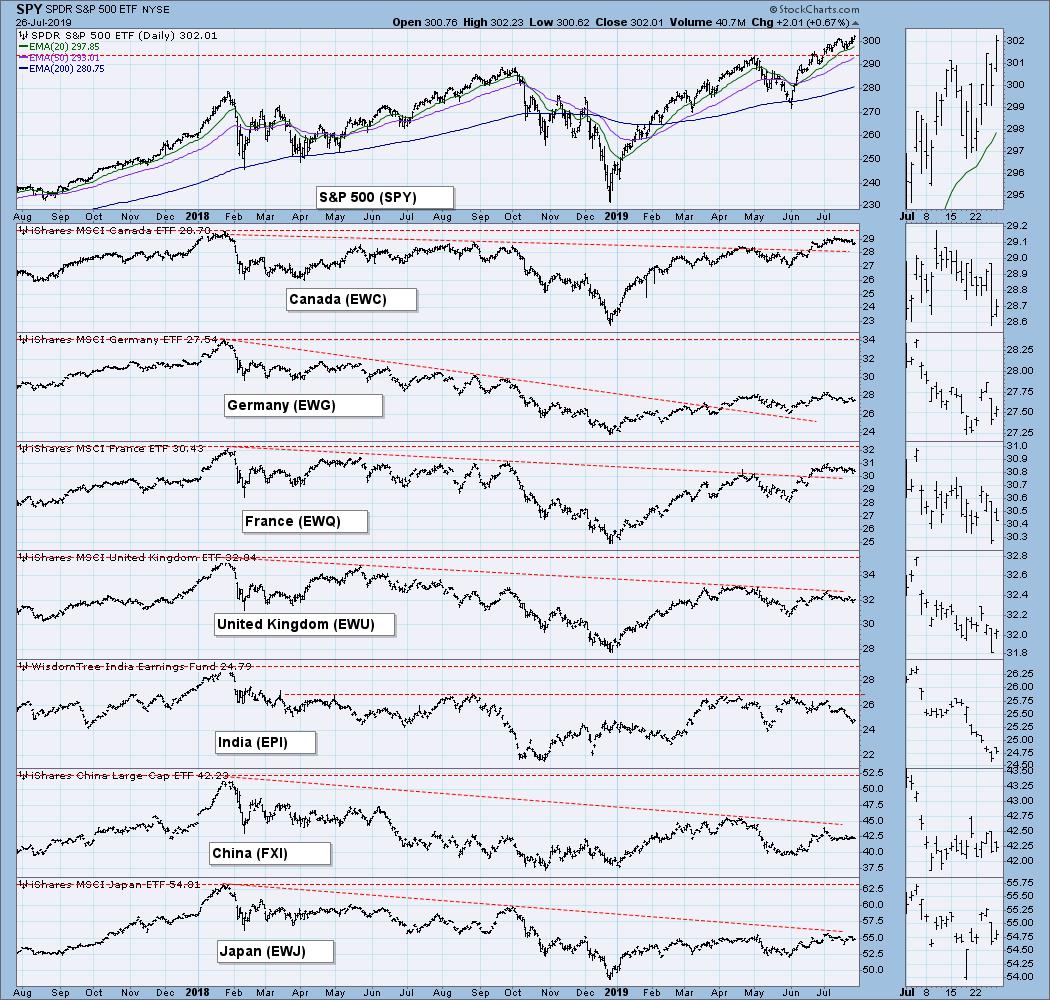
GLOBAL MARKETS
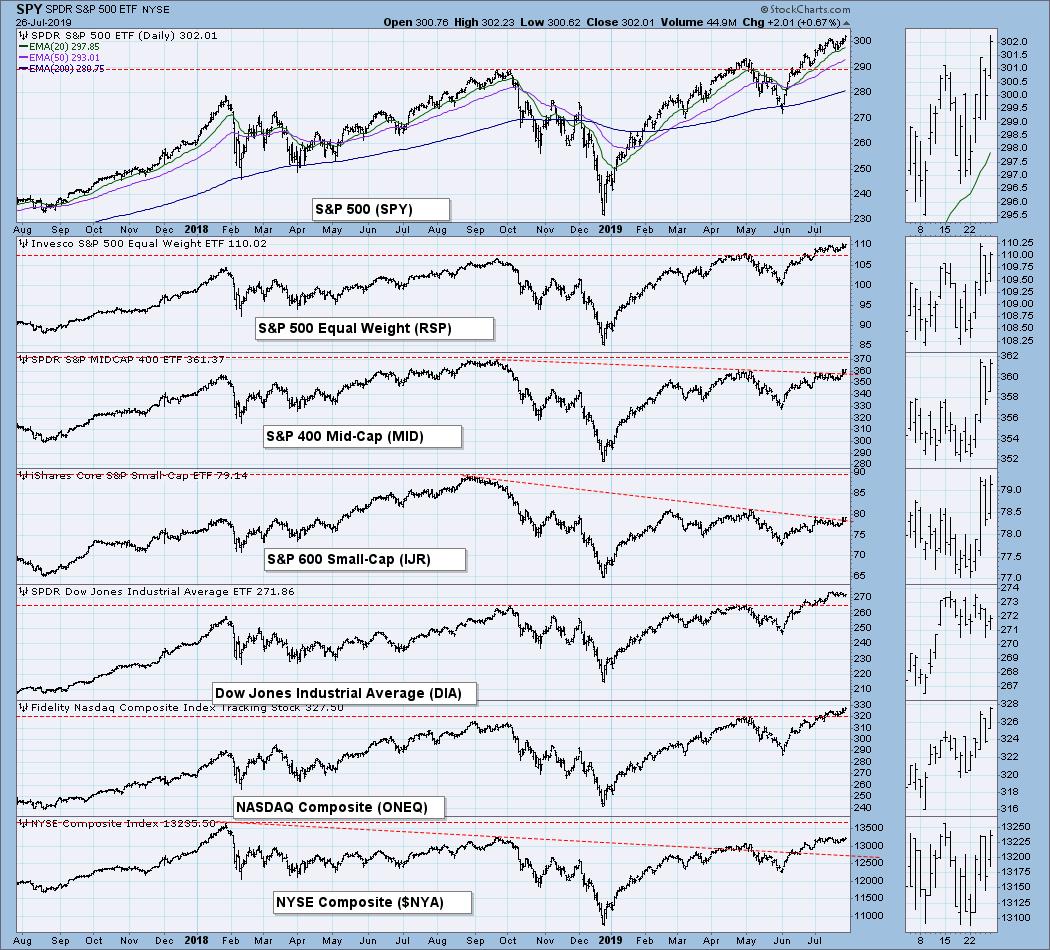
BROAD MARKET INDEXES
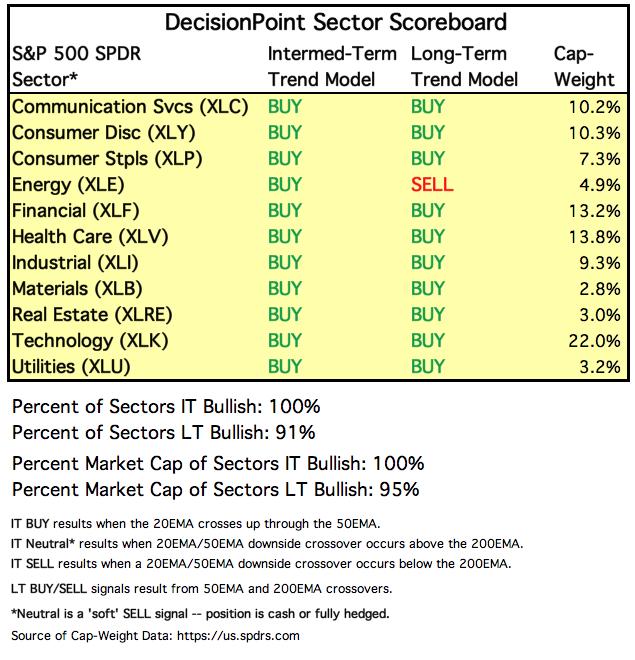
SECTORS
Each S&P 500 Index component stock is assigned to one, and only one, of 11 major sectors. This is a snapshot of the Intermediate-Term and Long-Term Trend Model signal status for those sectors.
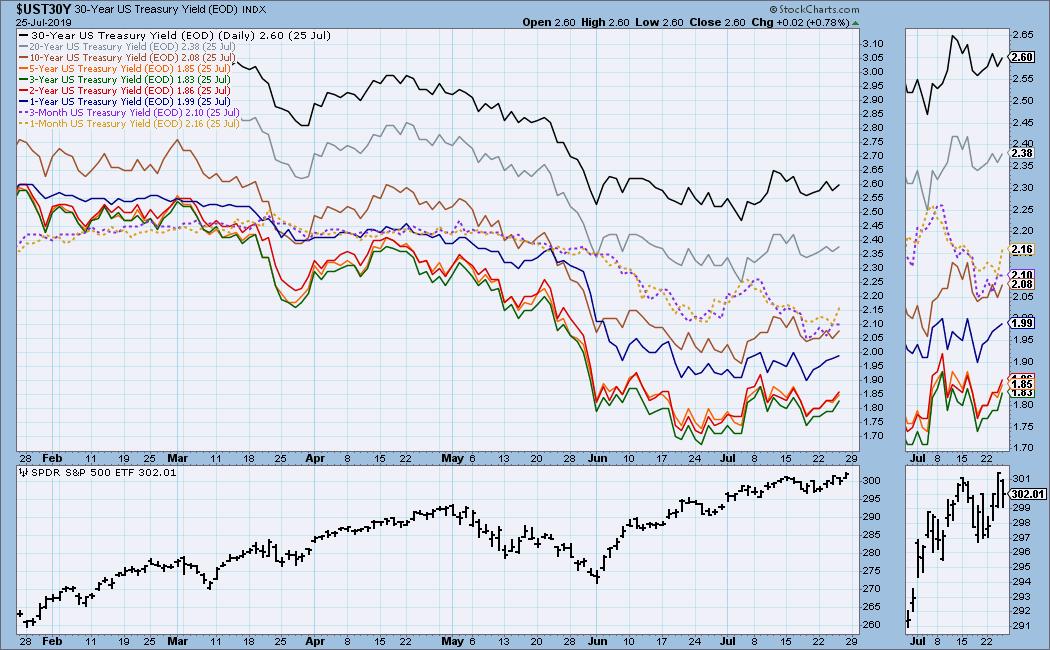
INTEREST RATES
Because some interest rates are currently inverted, I will be including a chart so we can monitor the situation. In normal circumstances the longer money is borrowed the higher the interest rate that must be paid. When rates are inverted, the reverse is true. It is generally believed that rate inversions result from "a flight to safety." On the chart below, notice that the one-month and three month T-Bills (dotted lines) pay a higher interest rate than the one year through the 10-year T-Bonds. Inversions are a serious problem for the stock market.
STOCKS
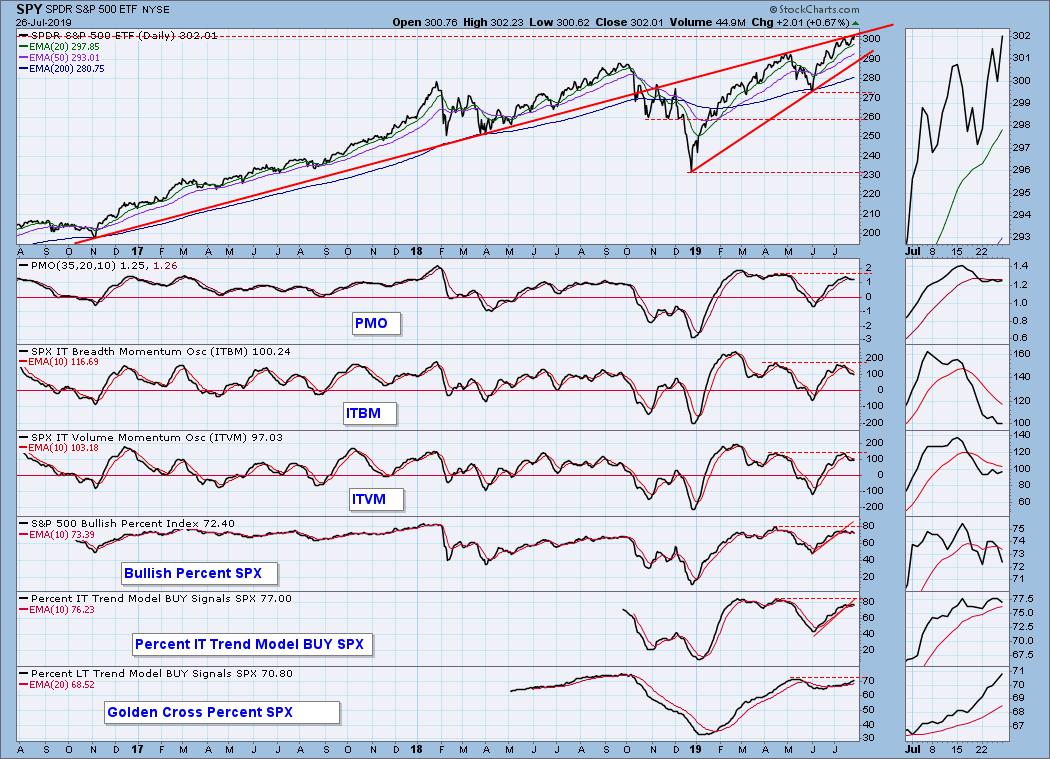
IT Trend Model: BUY as of 6/11/2019
LT Trend Model: BUY as of 2/26/2019
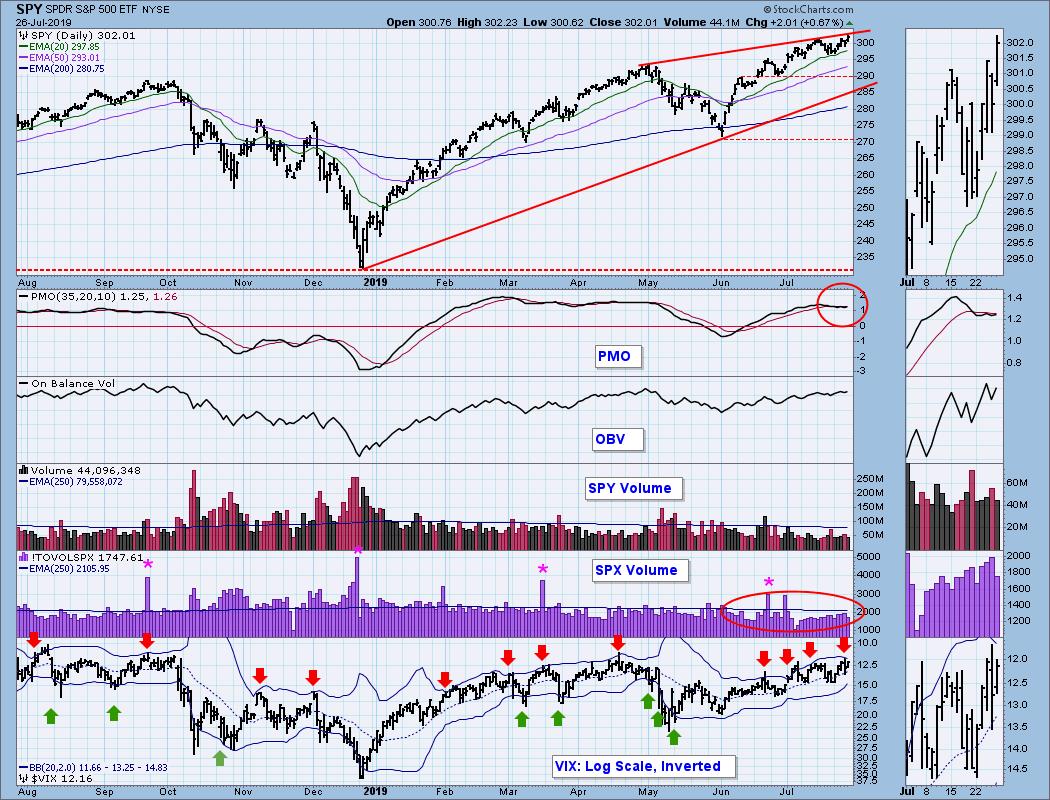
SPY Daily Chart: Price has hit the top of a rising wedge, and the VIX reached the top Bollinger Band, so I'm looking for some short-term weakness. The OBV for SPY is not confirming the new price highs, although OBV for $SPX does. The OBV divergence for SPY shows that trades are getting complacent, happy to sit on their SPY longs.
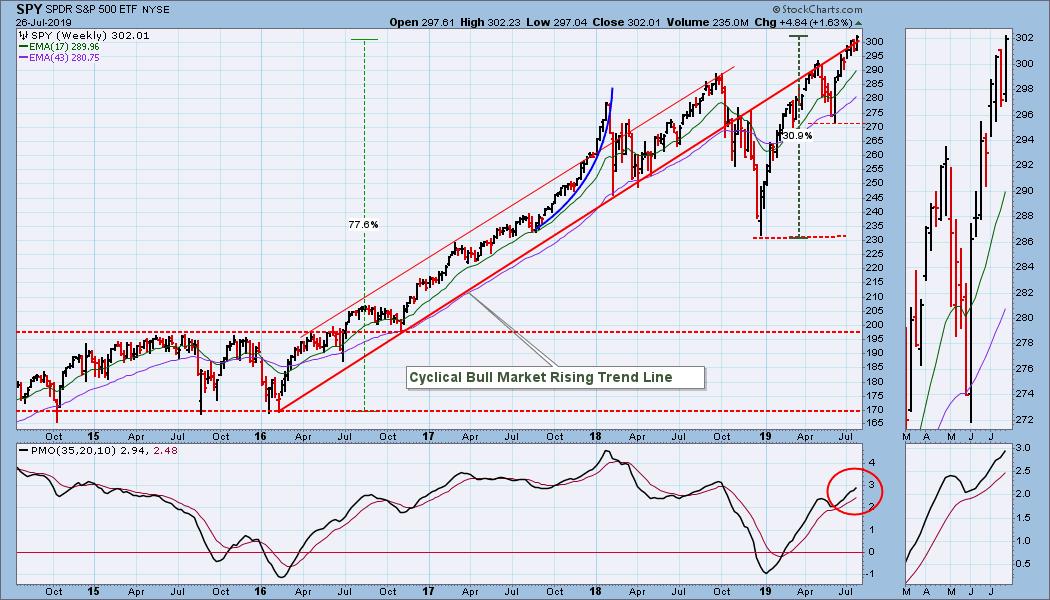
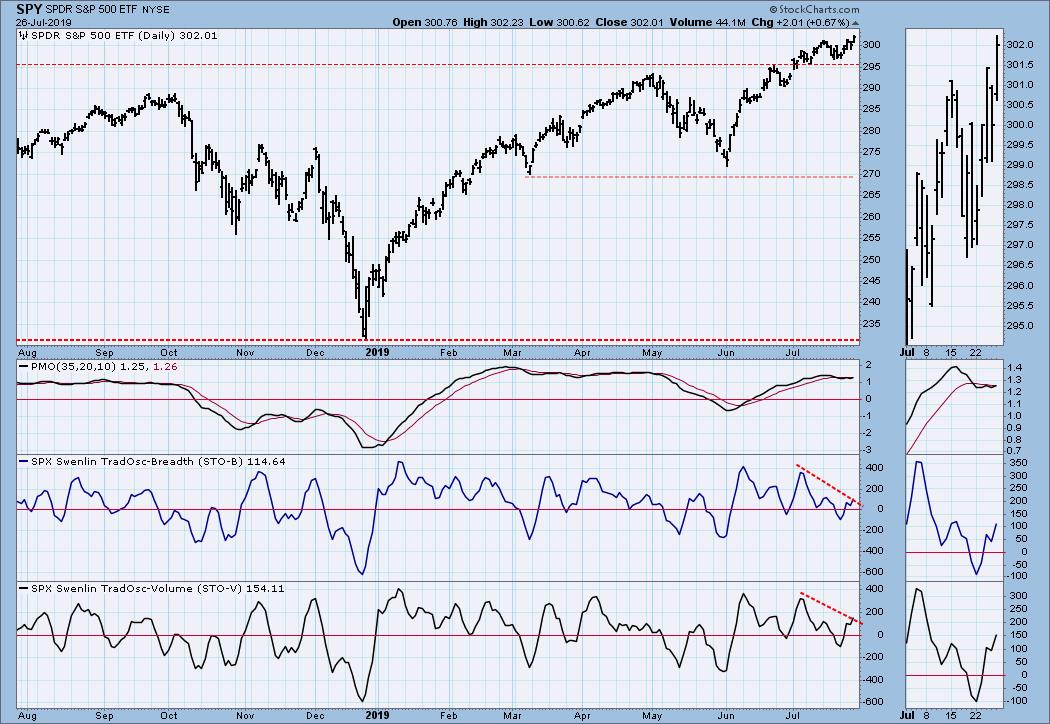
SPY Weekly Chart: Trend lines are not of much use here, but the picture is positive. The weekly PMO is overbought.
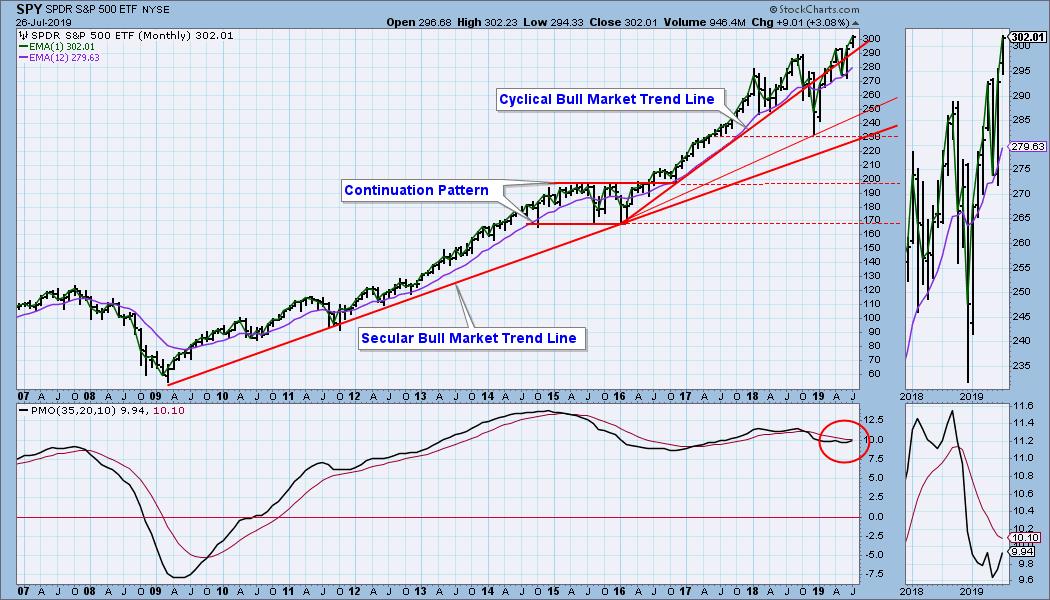
SPY Monthly Chart: While this chart is not quite final, not much is likely to change by the middle of next week. The cyclical bull market trend line has been recaptured, but I don't think it has much relevance at this point. The monthly PMO is overbought, but it has been overbought for more than eight years.
Climactic Market Indicators: The most significant item on this chart for this week was that the VIX touched (well, almost touched) the upper Bollinger Band. As usual I'll be looking for some weakness in the very short term.
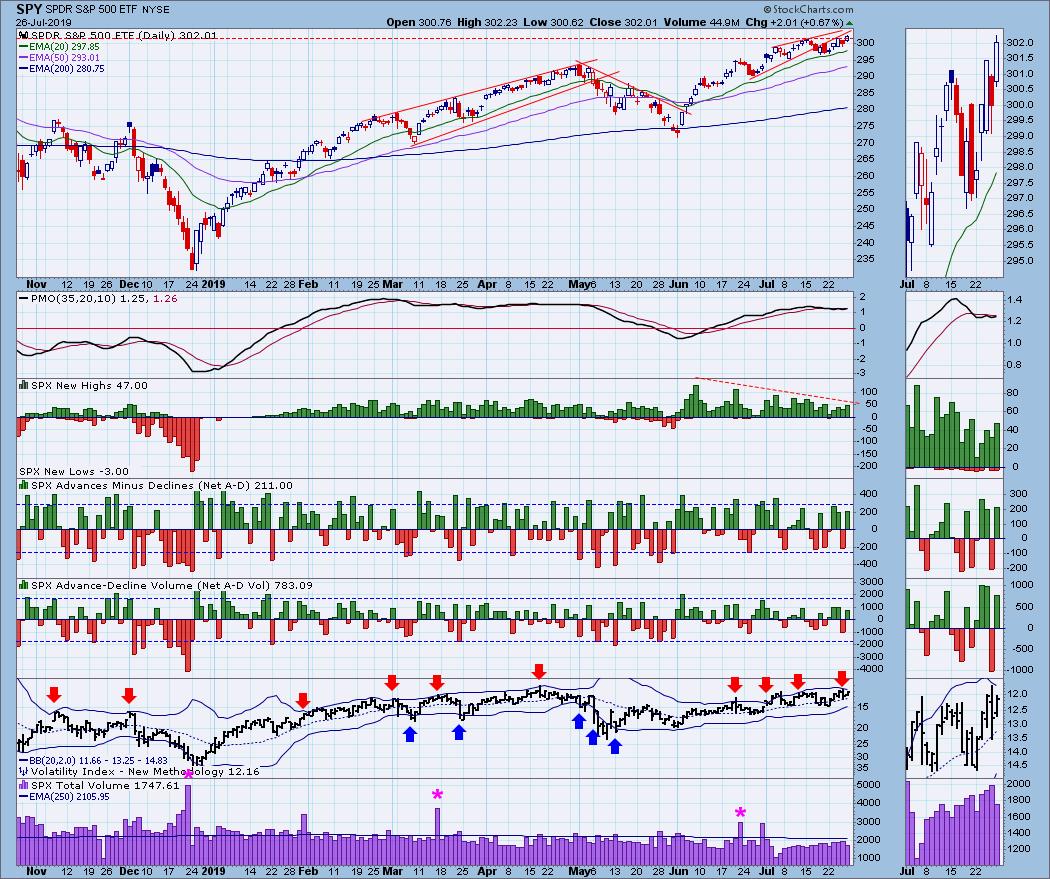
Short-Term Market Indicators: They are about neutral, and there is room to go either way. The negative divergences haven't been a problem for the market.
Intermediate-Term Market Indicators: These indicators are fairly overbought and toppy.
CONCLUSION: The market is waiting for the Fed announcement on Wednesday next week. Let's not drive ourselves crazy trying to predict that one, except to say that a quarter point wouldn't be a surprise to anyone. Fundamentals aside, the market is intermediate-term overbought, and I think it ought to head lower after any turbulence resulting from the Fed announcement.
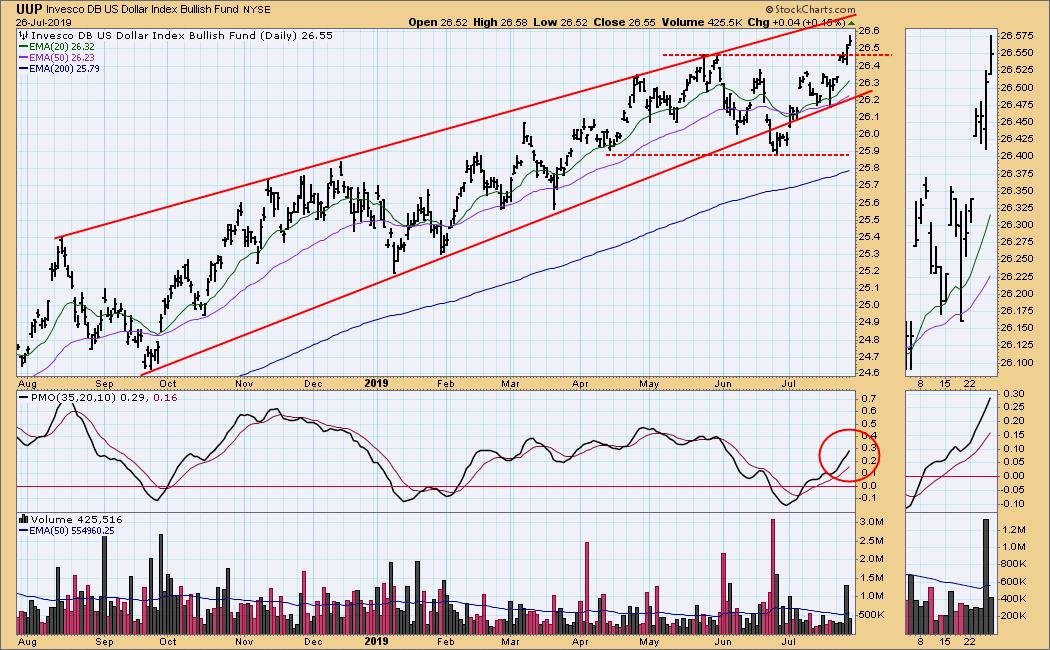
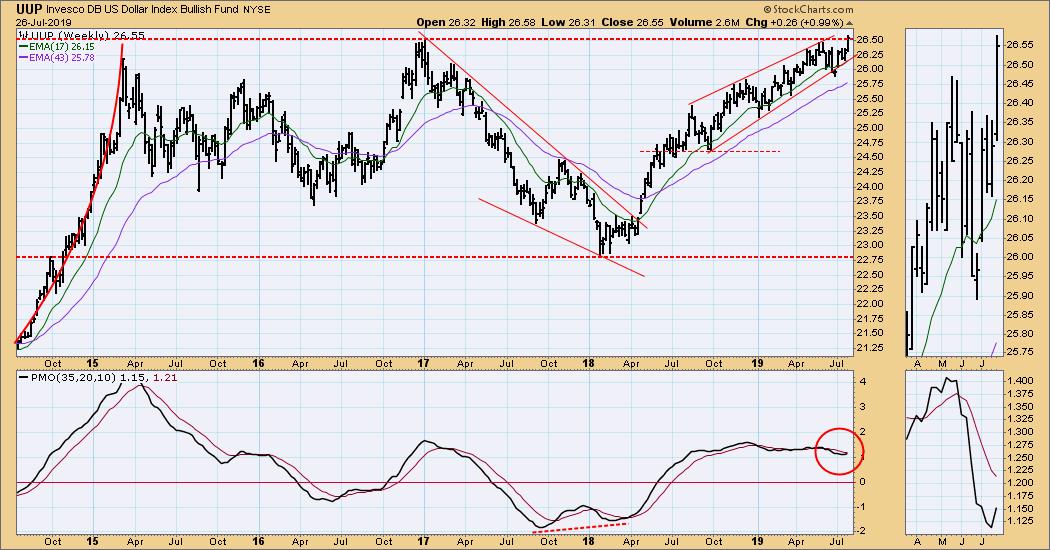
DOLLAR (UUP)
IT Trend Model: BUY as of 7/5/2019
LT Trend Model: BUY as of 5/25/2018
UUP Daily Chart: This week UUP moved to new highs, taking out the resistance line drawn across the May highs. The large rising wedge still dominates the chart and gives us an idea where the limits of the advance might be.
UUP Weekly Chart: A line drawn across the 2017 top was also penetrated this week, and the weekly PMO is positive.
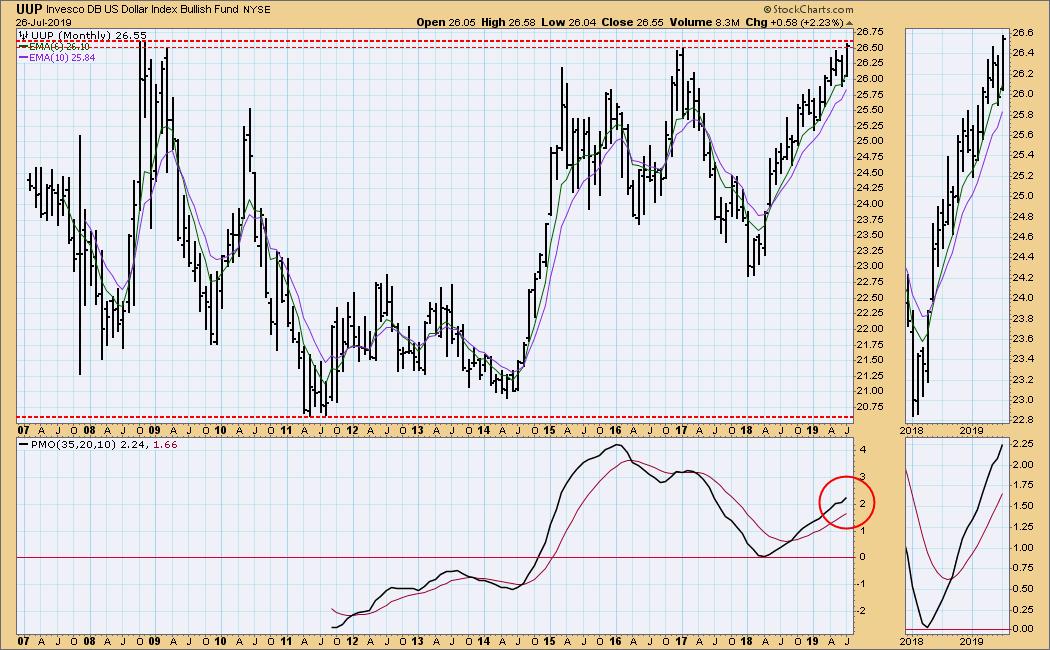
UUP Monthly Chart: The monthly chart won't be final until next Wednesday, but when we take a peek, we can see that the 2008 top defines another line of resistance still to be overcome.
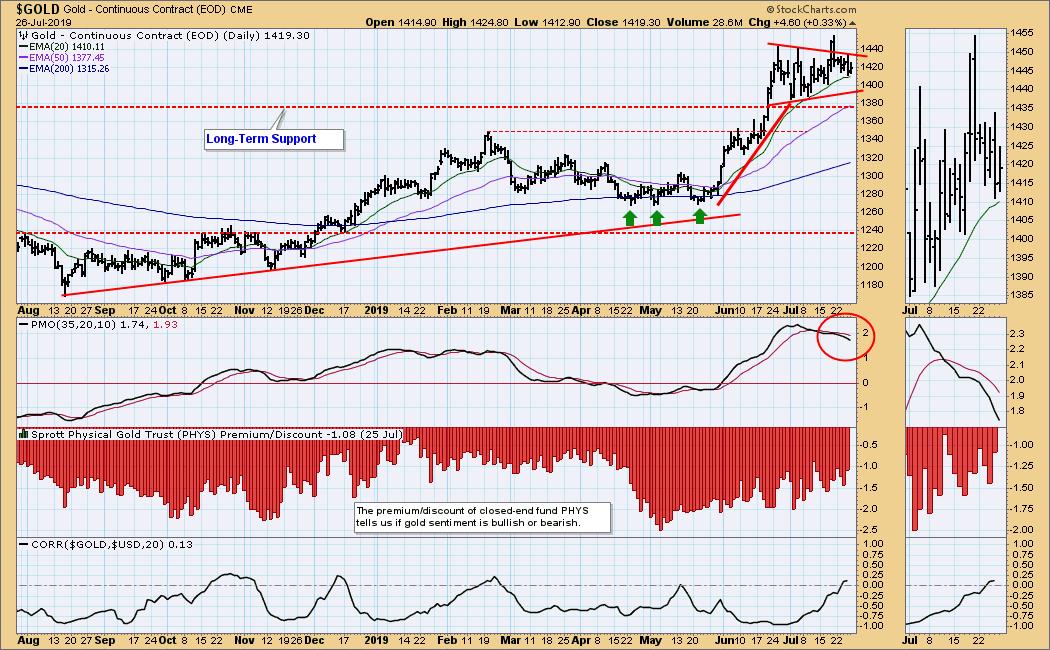
GOLD
IT Trend Model: BUY as of 6/3/2019
LT Trend Model: BUY as of 1/8/2019
GOLD Daily Chart: The advance from late-May and subsequent consolidation still looks like a flag formation to me. An upside breakout should take place fairly soon.
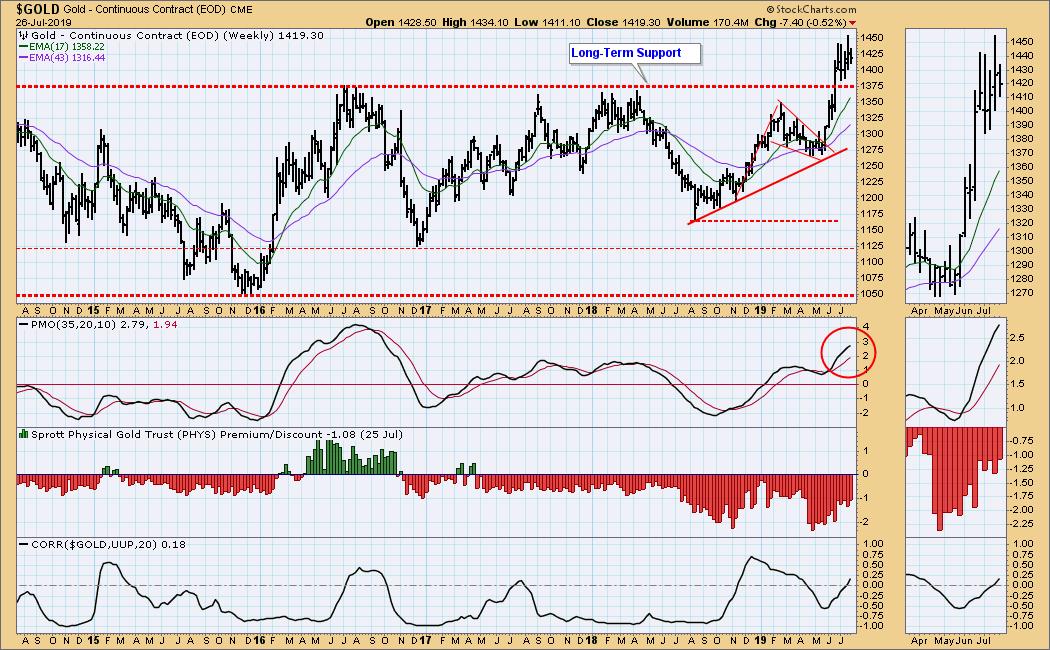
GOLD Weekly Chart: Gold has advanced almost +40% since its 2015 bear market low. It has been a torturous journey, keeping sentiment bearish for most of that time. In June price broke above a line of long-term resistance, and it has been consolidating above the line. This is a very positive picture.
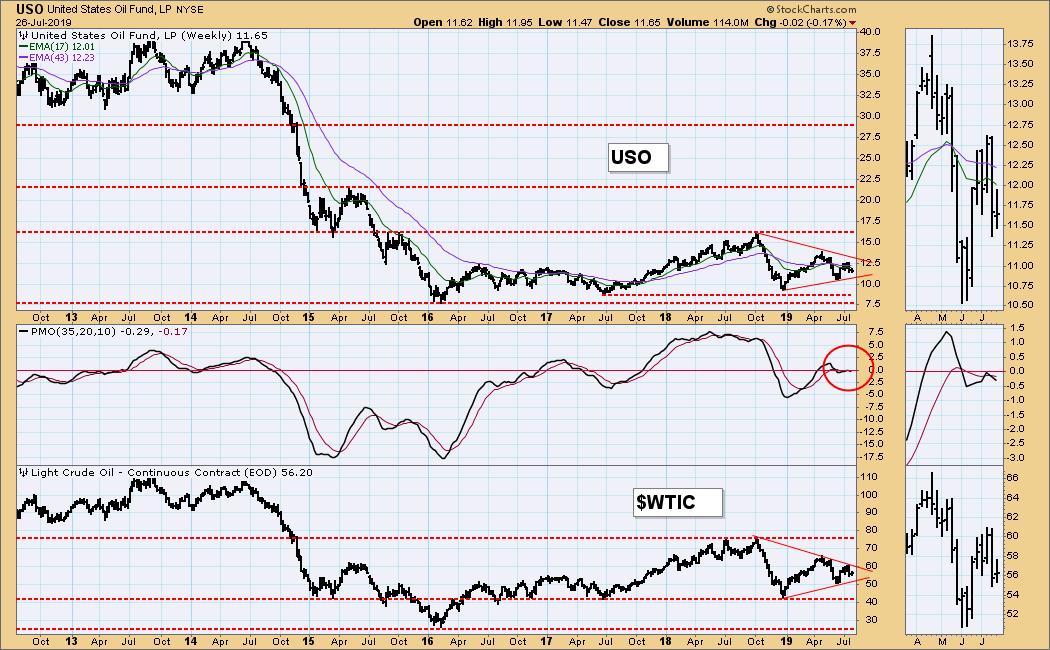
CRUDE OIL (USO)
IT Trend Model: NEUTRAL as of 5/30/2019
LT Trend Model: SELL as of 6/4/2019
USO Daily Chart: A double top broke down and filled the June up gap. Currently, price seems indecisive and the daily PMO is neutral.
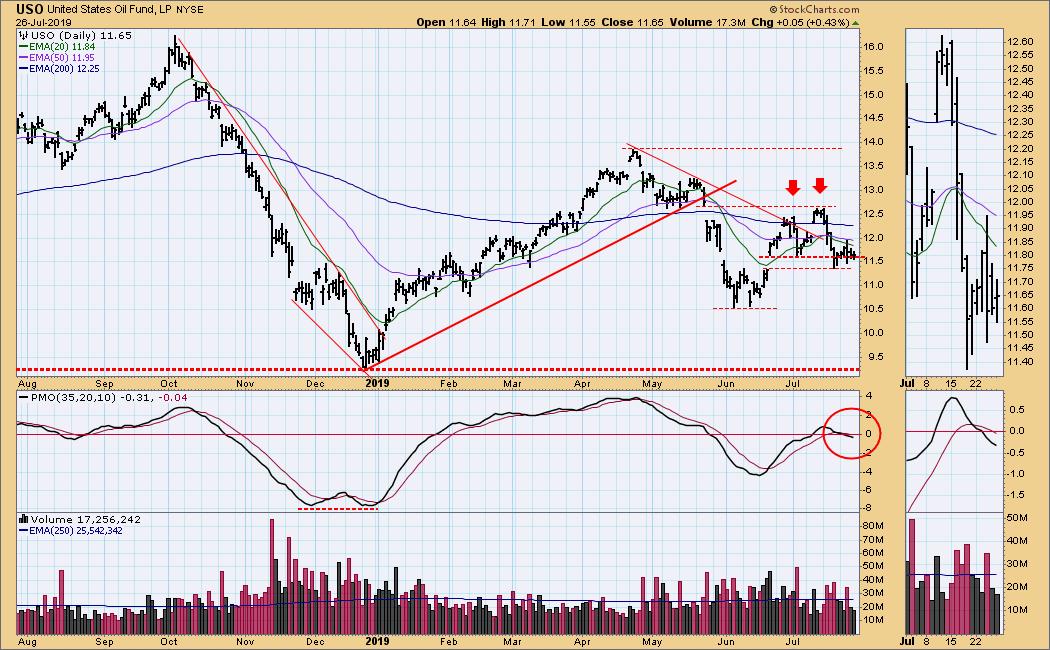
USO Weekly Chart: Both USO and WTIC are being squeezed into a corkscrew. When those formations are resolved, I expect that the current trading ranges will still dominate price movement.
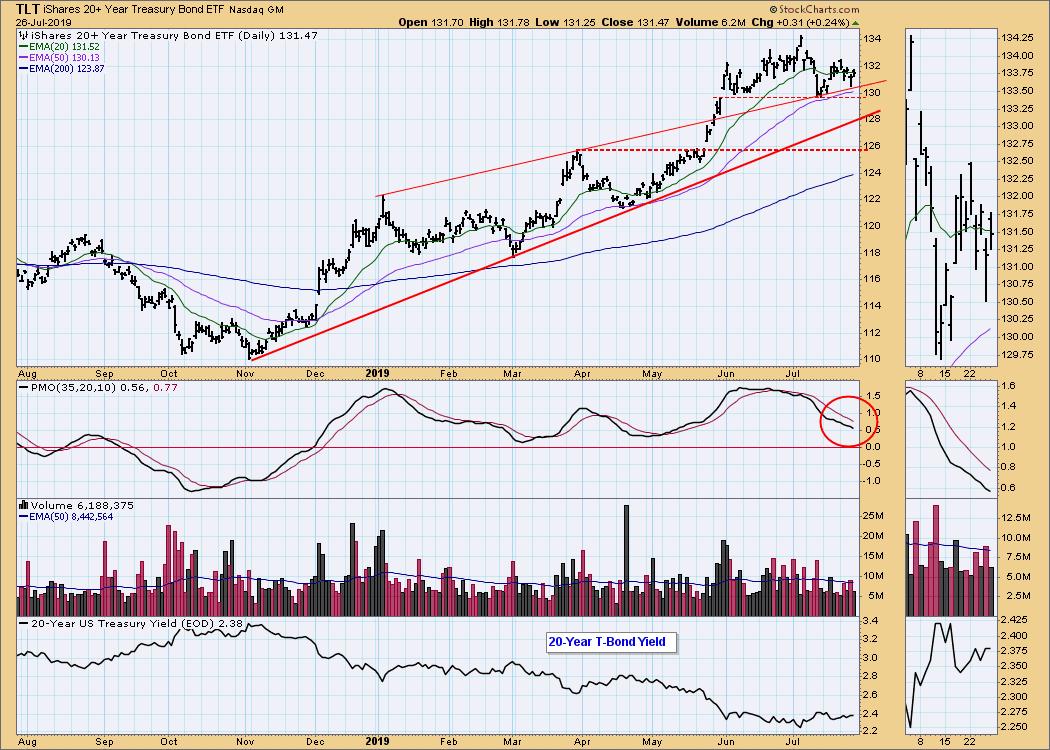
BONDS (TLT)
IT Trend Model: BUY as of 12/6/2018
LT Trend Model: BUY as of 1/2/2019
TLT Daily Chart: Price appears to be topping in this time frame, and the daily PMO is falling below the signal line.
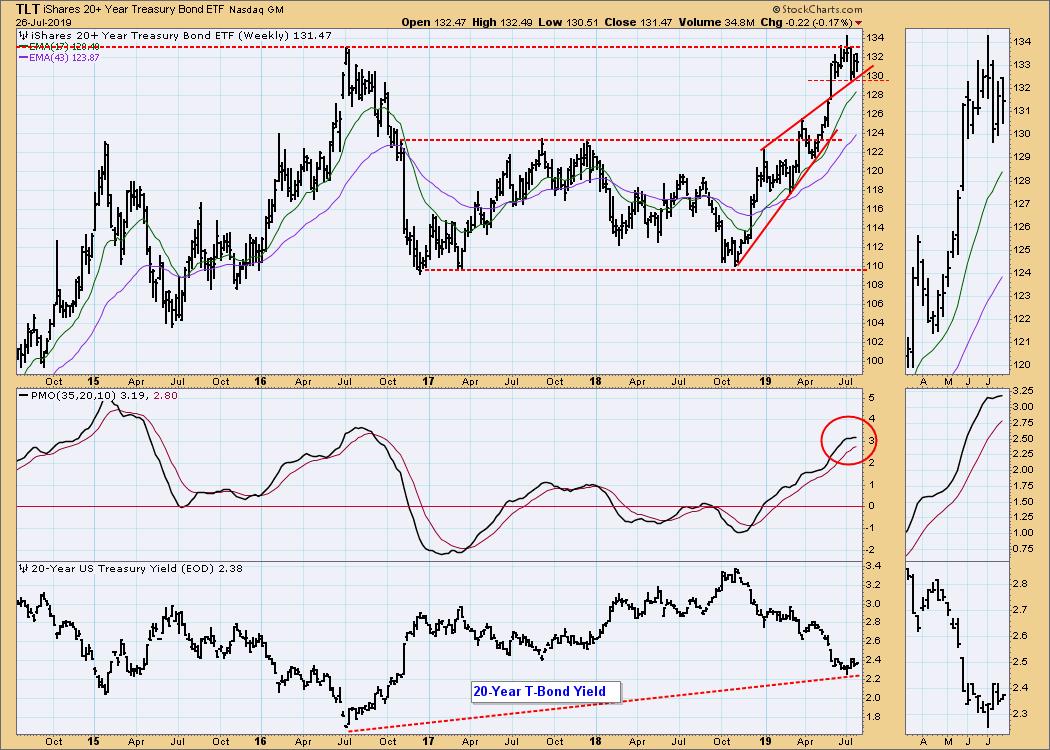
TLT Weekly Chart: Price has been consolidating below the long-term line of resistance drawn across the 2016 top. It has long been my opinion that that line would stop any further advance, but it is likely that yield will go lower, and by necessity price will have to go higher.
**Don't miss any of the DecisionPoint commentaries! Go to the "Notify Me" box toward the end of this blog page to be notified as soon as they are published.**
Technical Analysis is a windsock, not a crystal ball.
Happy Charting! - Carl
NOTE: The signal status reported herein is based upon mechanical trading model signals, specifically, the DecisionPoint Trend Model. They define the implied bias of the price index based upon moving average relationships, but they do not necessarily call for a specific action. They are information flags that should prompt chart review. Further, they do not call for continuous buying or selling during the life of the signal. For example, a BUY signal will probably (but not necessarily) return the best results if action is taken soon after the signal is generated. Additional opportunities for buying may be found as price zigzags higher, but the trader must look for optimum entry points. Conversely, exit points to preserve gains (or minimize losses) may be evident before the model mechanically closes the signal.
Helpful DecisionPoint Links:
DecisionPoint Shared ChartList and DecisionPoint Chart Gallery
Price Momentum Oscillator (PMO)
Swenlin Trading Oscillators (STO-B and STO-V)


