 Sometimes, you get more than you bargained for. That said, you stand a much better chance of finding those successful (and many times parabolic) stocks when you start with a good analysis process. The DecisionPoint Analysis Process does just that. I find my prospective investments using various technical scans, but ultimately the final decision is based on a few important indicators: the Price Momentum Oscillator (PMO), the On-Balance Volume (OBV) and the DecisionPoint Trend Models.
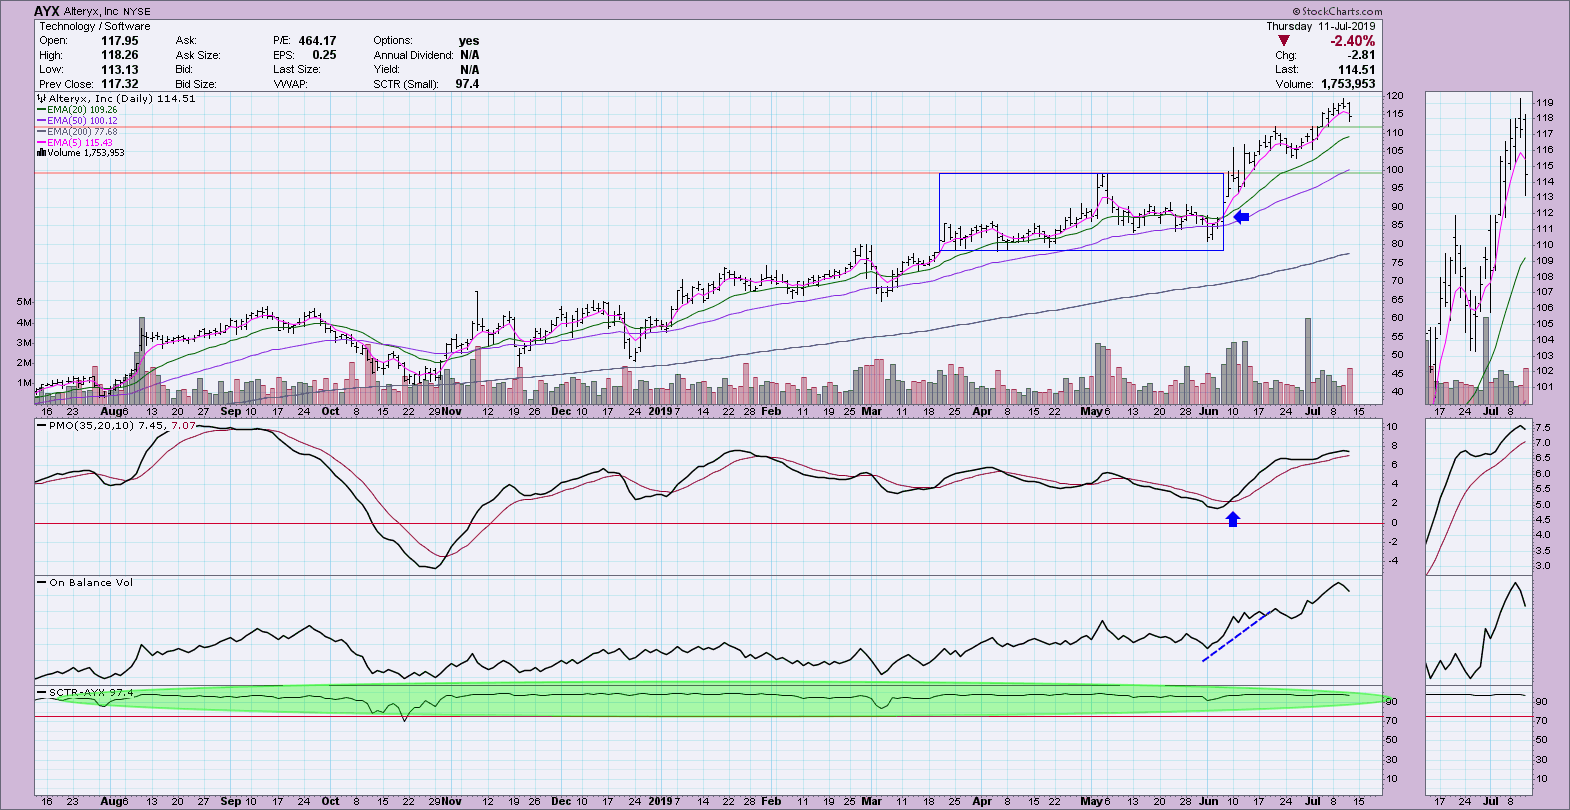
The winner is Alteryx Inc (AYX), which I believe I talked about on MarketWatchers LIVE back in June. To find it, I used a scan that considers my Price Momentum Oscillator (PMO) and the DecisionPoint Trend Models. Let's look more closely at the factors that made this an attractive investment. It's funny that, despite a negative day like today, I'm still loving this stock. Today's pullback makes it even more interesting for those who aren't in just yet. However, I'm not adding to my initial investment (full disclosure). Also, of course, past performance isn't indicative of future returns. This is a teachable moment, not a recommendation to buy. You need to evaluate the merits of getting in using your analysis process. Now that we've gotten the disclaimer out of the way, let's examine the chart more closely.
This stock initially appeared in a scan back in June as the PMO was turning up in oversold territory and the 5-EMA had just crossed above the 20-EMA (a Short-Term Trend Model BUY signal). Price broke out just after that. I had set my upside target based on the height of the trading range it was currently in. I added that height to the top back in May, which was $120. I haven't reached it yet. I set the stop at $77 (the lows in April). The OBV was clearly confirming the interest level in this stock and the StockCharts Technical Rank (SCTR) has been in the "hot zone" above 75 for nearly the entire year.
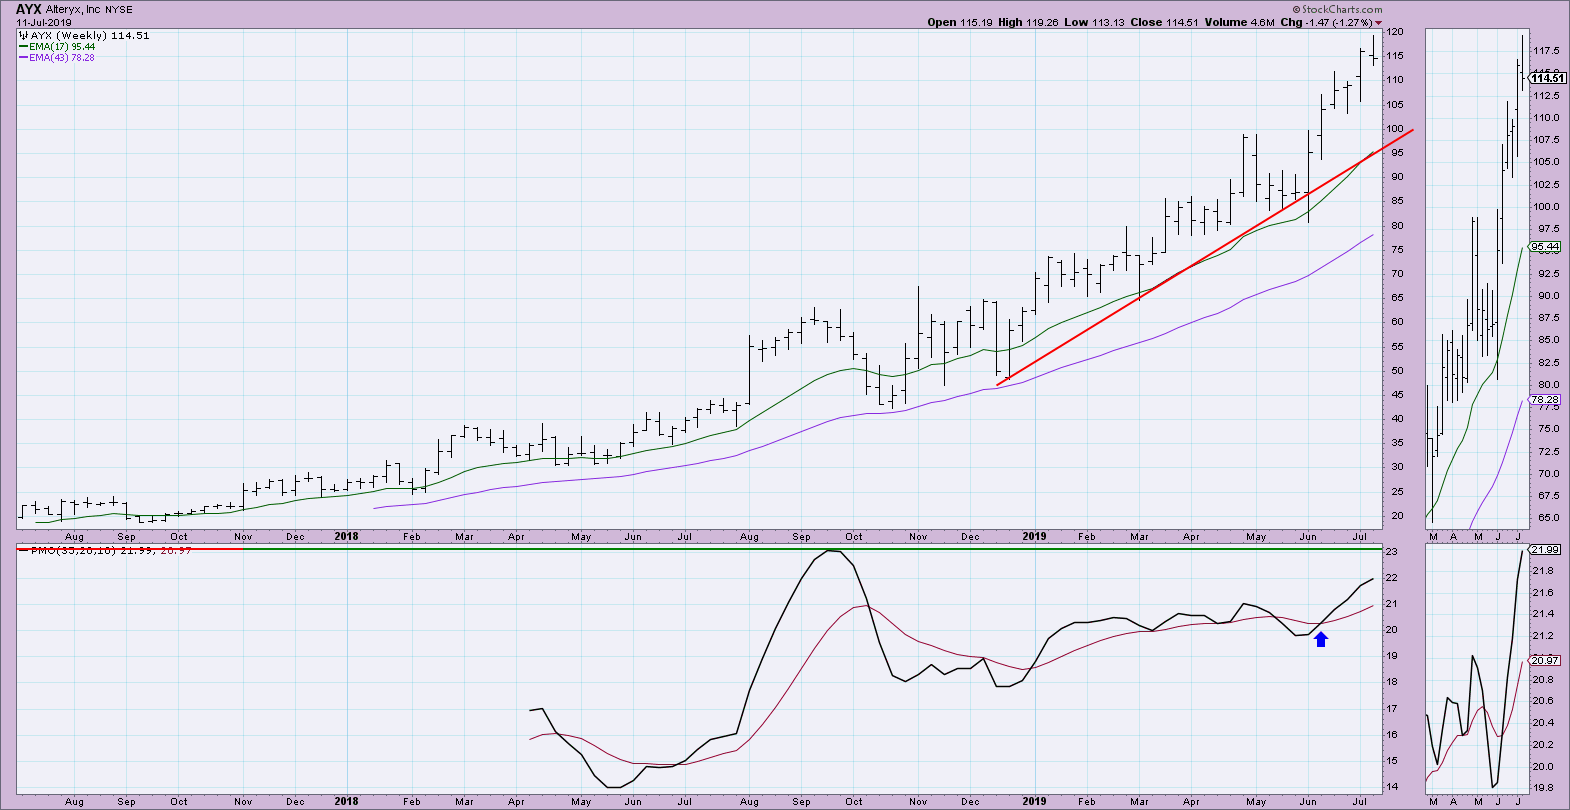
 Given today's decline, I reviewed the weekly chart. Price on the daily chart just turned down below my $120 target. My stop is now moved up to $100. The PMO and the price bar for AYX this week is looking healthy. The PMO is rising and isn't in overbought territory. My caveat would be that we don't have that much data on AYX as it hasn't been trading that long.
 Conclusion: I am thrilled so far with the performance of AYX. However, I will be keeping a close watch on the weekly PMO and my support/stop level at $100. This is not a recommendation to buy - I'm only pointing out what my analysis is telling me and sharing that with my loyal readers and viewers. My job is to instruct and educate. The link to my basic PMO scan blog article is below.
Watch the latest episode of DecisionPoint with Carl & Erin Swenlin LIVE on Fridays 4:30p EST or on the StockCharts TV YouTube channel here!
Technical Analysis is a windsock, not a crystal ball.
Happy Charting! - Erin
erinh@stockcharts.com
Helpful DecisionPoint Links:
DecisionPoint Shared ChartList and DecisionPoint Chart Gallery
Price Momentum Oscillator (PMO)
Swenlin Trading Oscillators (STO-B and STO-V)


