
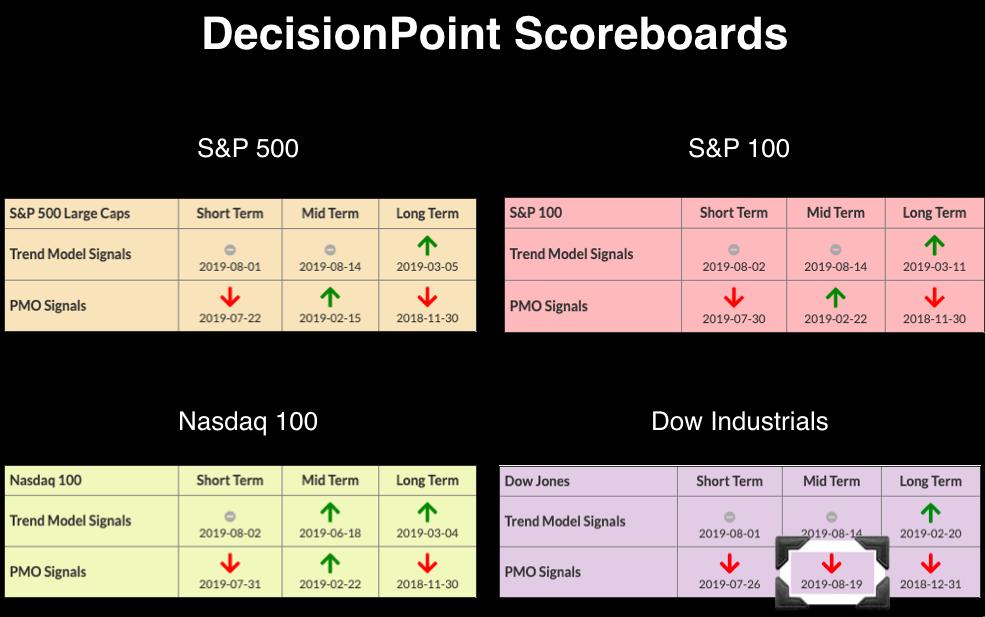
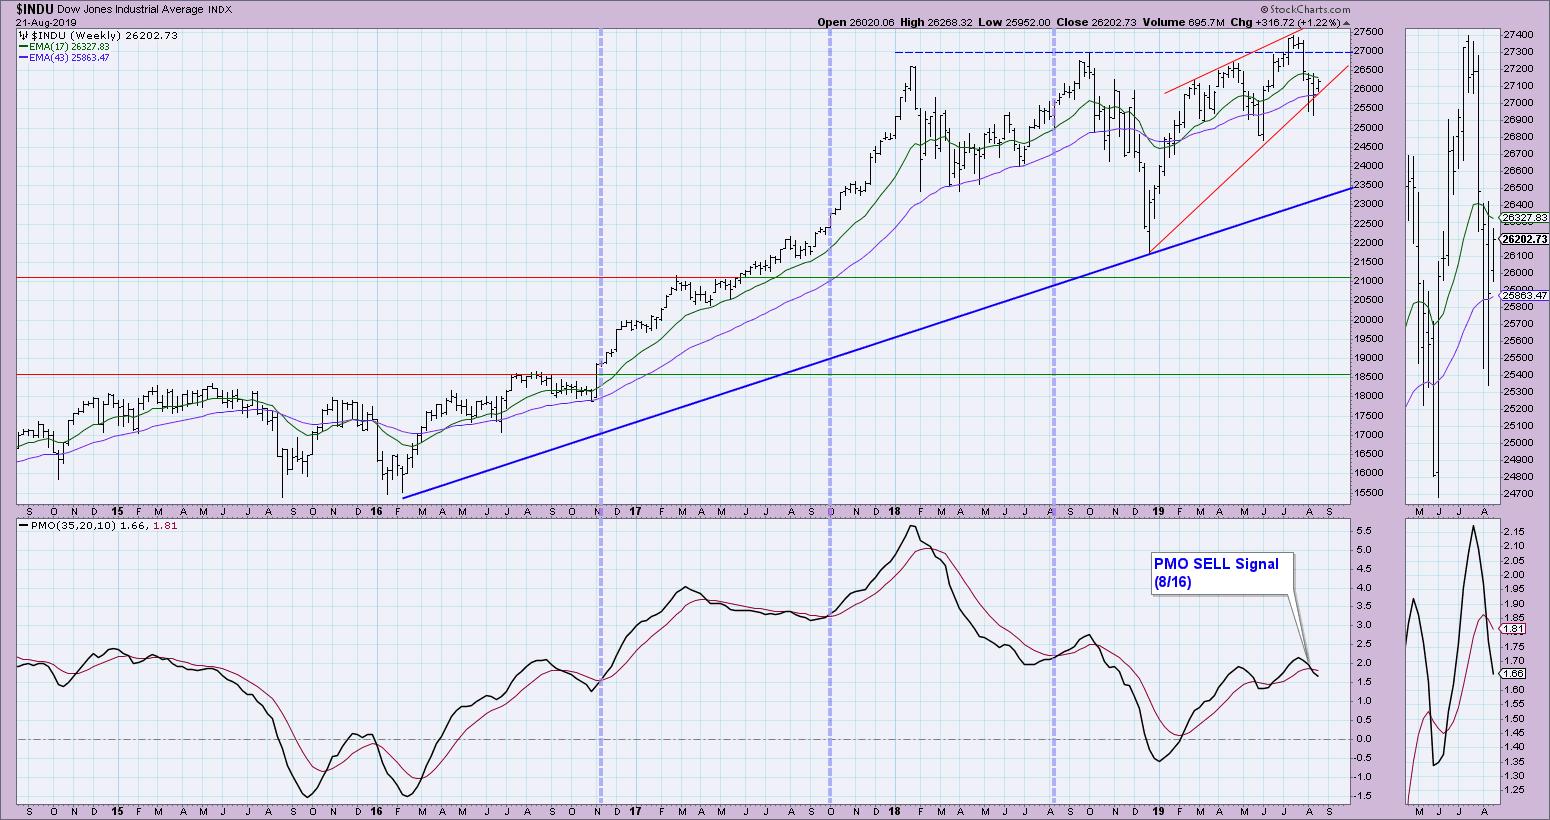
 The market continues to churn and consolidate sideways this week. The good news is that our indicators are starting to perk up. As of last Friday, the Dow generated a new IT Price Momentum Oscillator (PMO) SELL signal. Basically, the weekly PMO dropped below its signal on Friday. Amazingly, the other three indexes just barely missed the same signal by less than a hundredth of a point.
The Dow weekly chart below shows a bearish rising wedge that is trying to execute with a breakdown.
The DecisionPoint Alert presents a mid-week assessment of the trend and condition of the stock market (S&P 500), the U.S. Dollar, Gold, Crude Oil and Bonds.
Watch the latest episode of DecisionPoint on StockCharts TV's YouTube channel here!
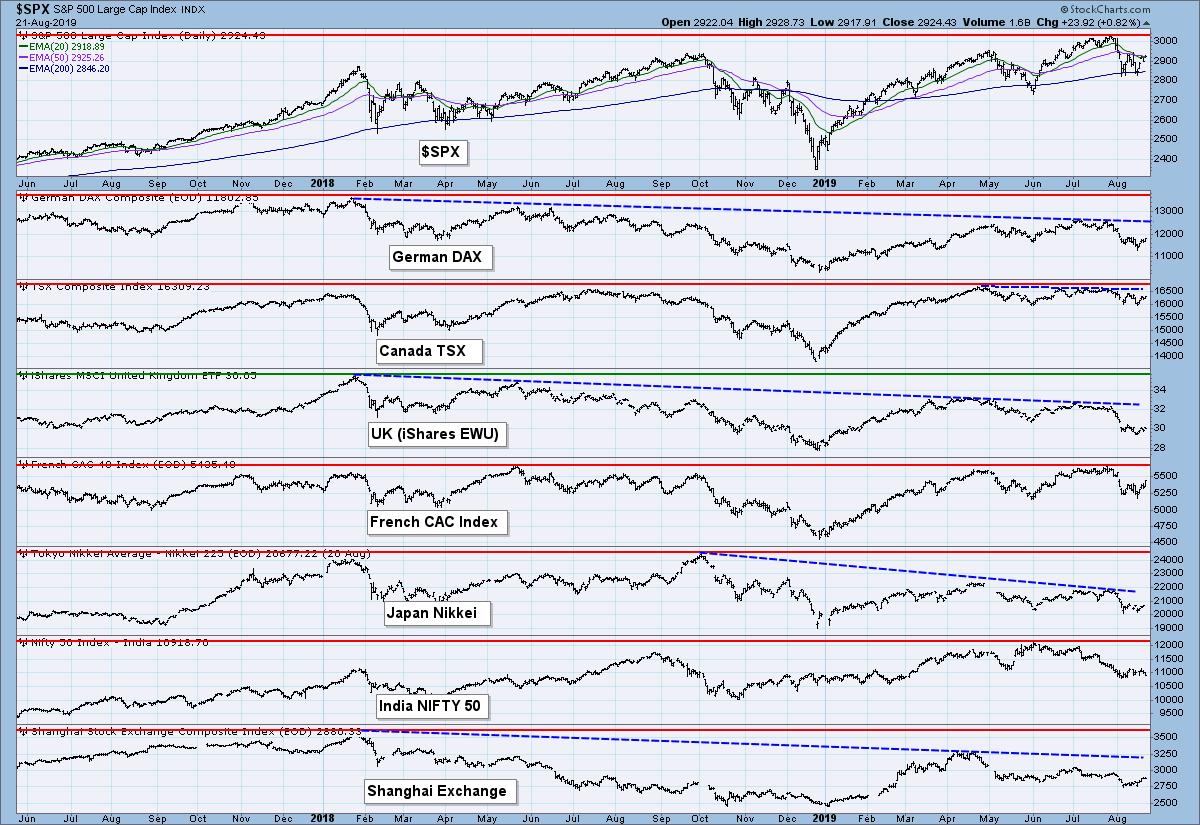
GLOBAL MARKETS
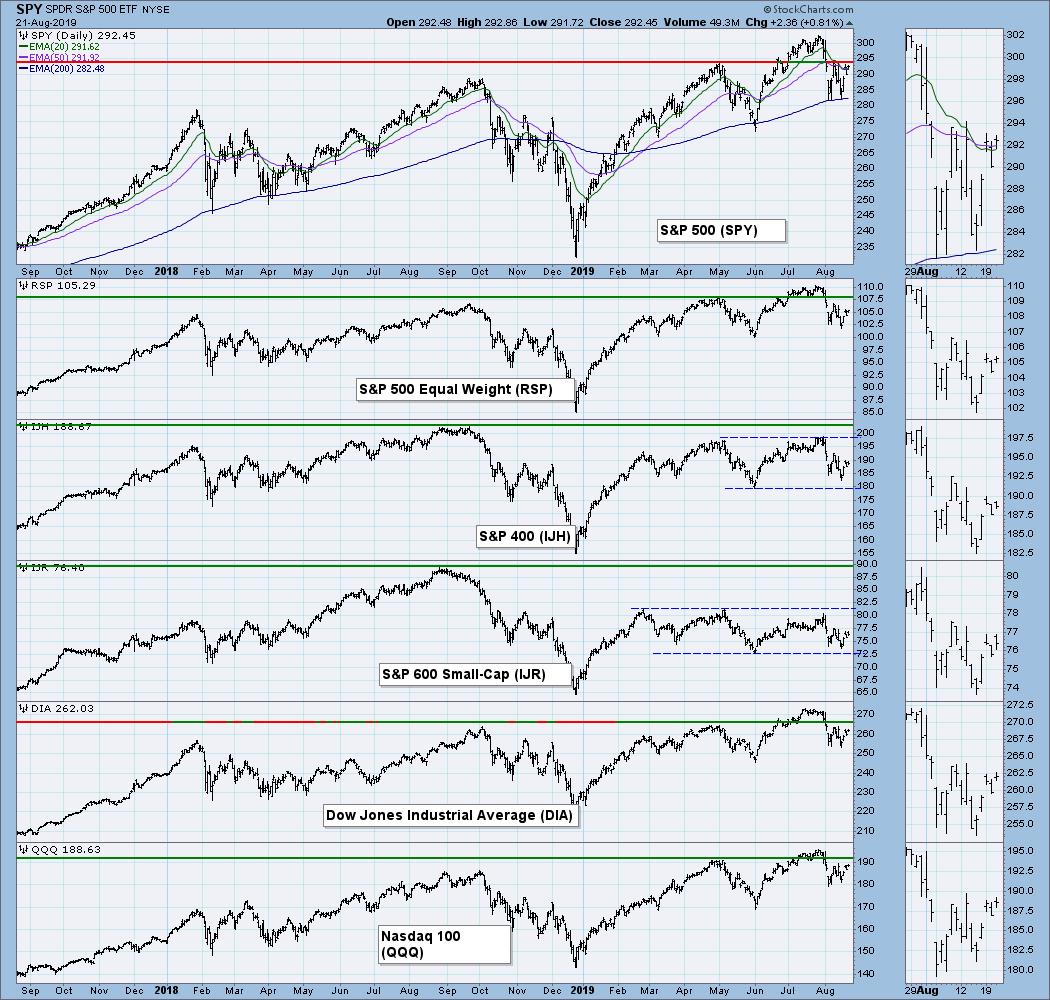
BROAD MARKET INDEXES
SECTORS
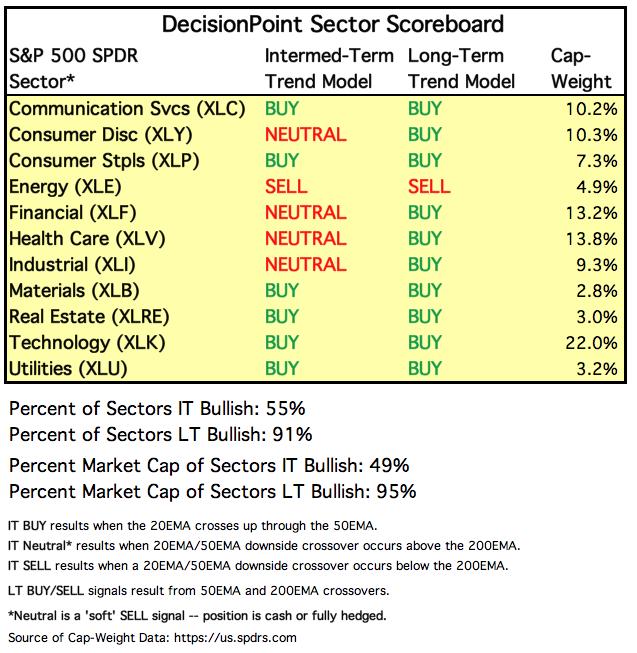
Each S&P 500 Index component stock is assigned to one, and only one, of eleven major sectors. This is a snapshot of the Intermediate-Term and Long-Term Trend Model signal status for those sectors.
STOCKS
IT Trend Model: Neutral as of 8/14/2019
LT Trend Model: BUY (SPY) as of 2/26/2019
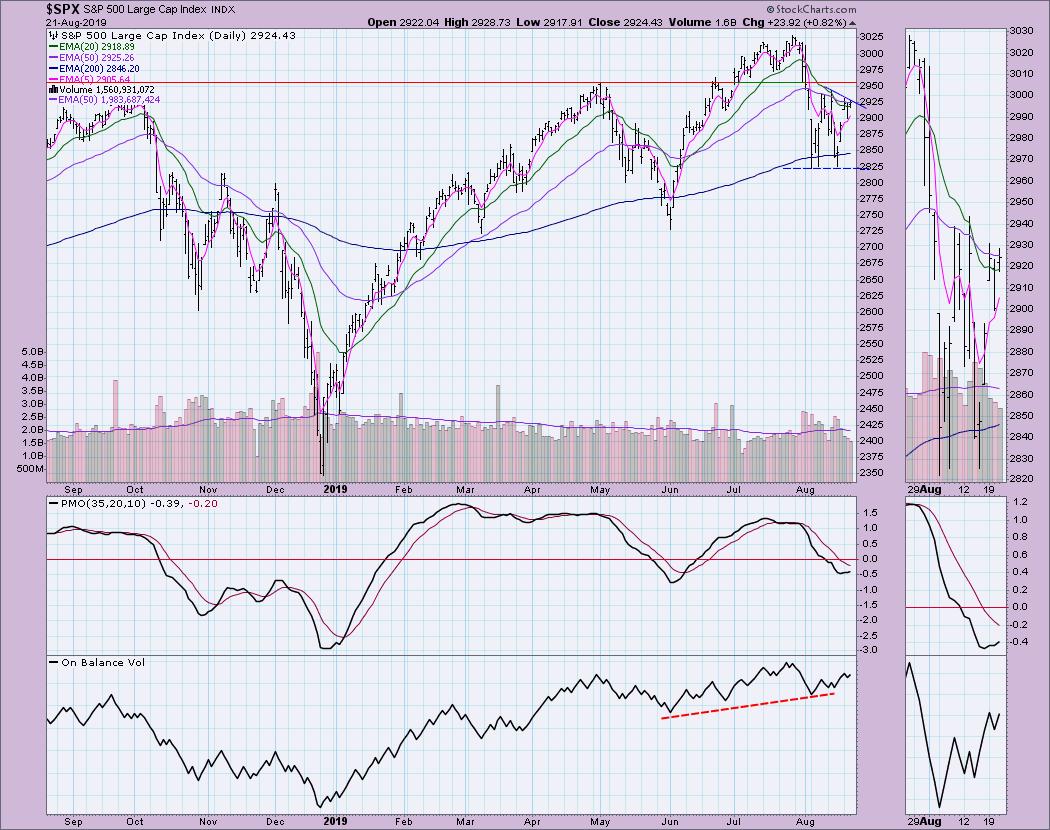
SPY Daily Chart: So far this week, the SPX has been unable to challenge the short-term top from last week. In fact, we are currently seeing declining tops. Price did manage to trade and close above the 20-EMA, which is a definite improvement. The PMO is also turning up and rising bottoms are appearing on the OBV, both of which are somewhat encouraging. Overall volatility is making trading challenging.
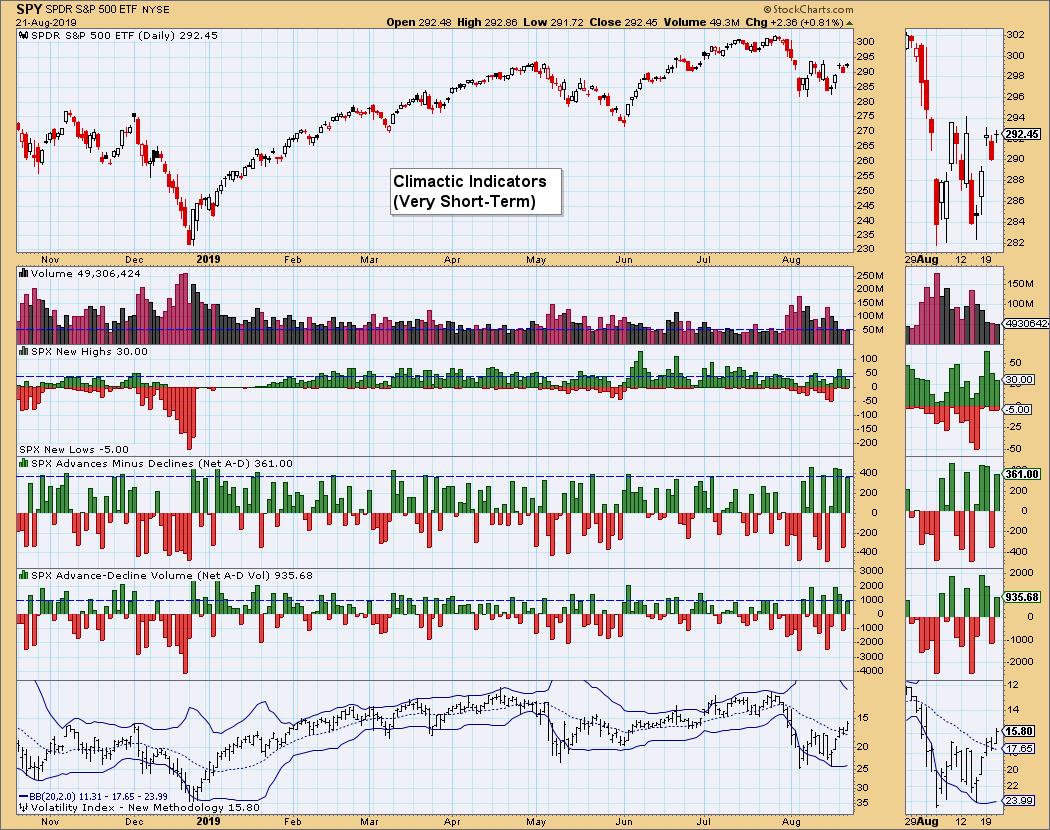
Climactic Market Indicators: We saw some climactic readings on breadth today to the positive side. The VIX is rising and is now above the moving average. We might be seeing a buying initiation, but I would've liked to see volume higher, along with more New Highs.
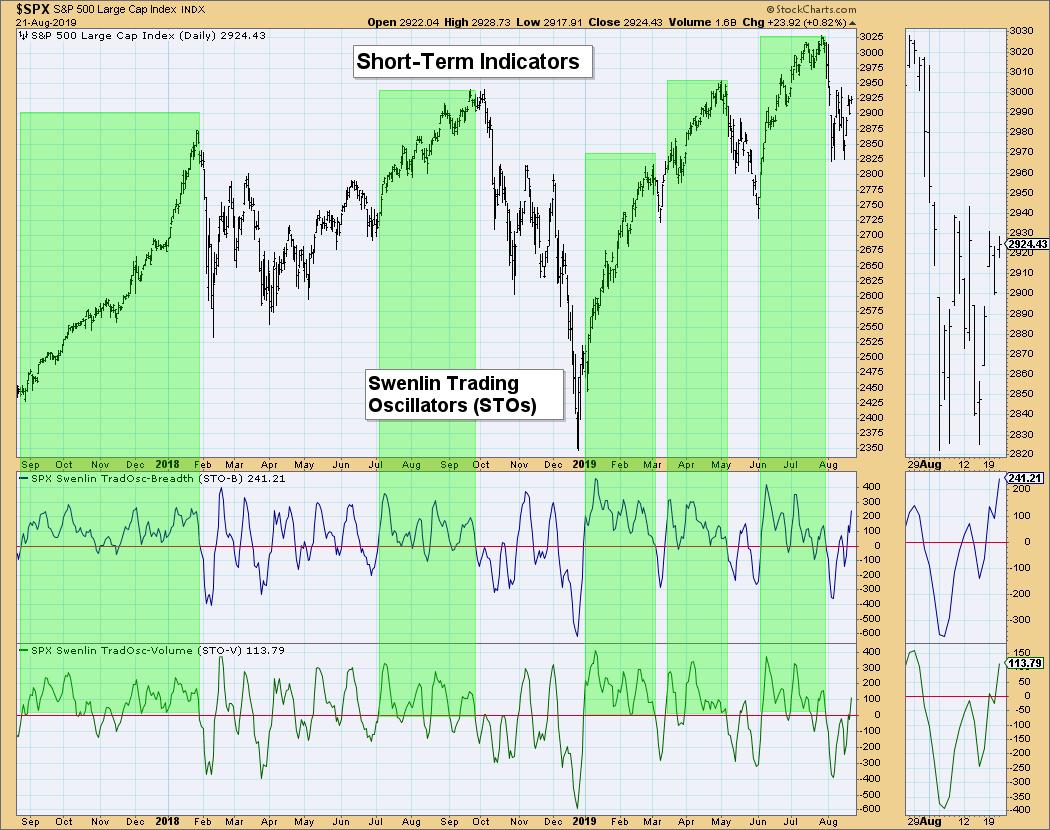
Short-Term Market Indicators: We are seeing steep rising bottoms on these oscillators. In comparison, the price bottoms are mostly flat. I would read this as a positive divergence. However, they are already getting overbought. That said, I do like the thrust behind their moves upward.
Intermediate-Term Market Indicators: I like that we finally got a positive crossover on the ITBM. The ITVM seems to be lagging and we really need to see the volume indicator join. Price follows volume, after all.
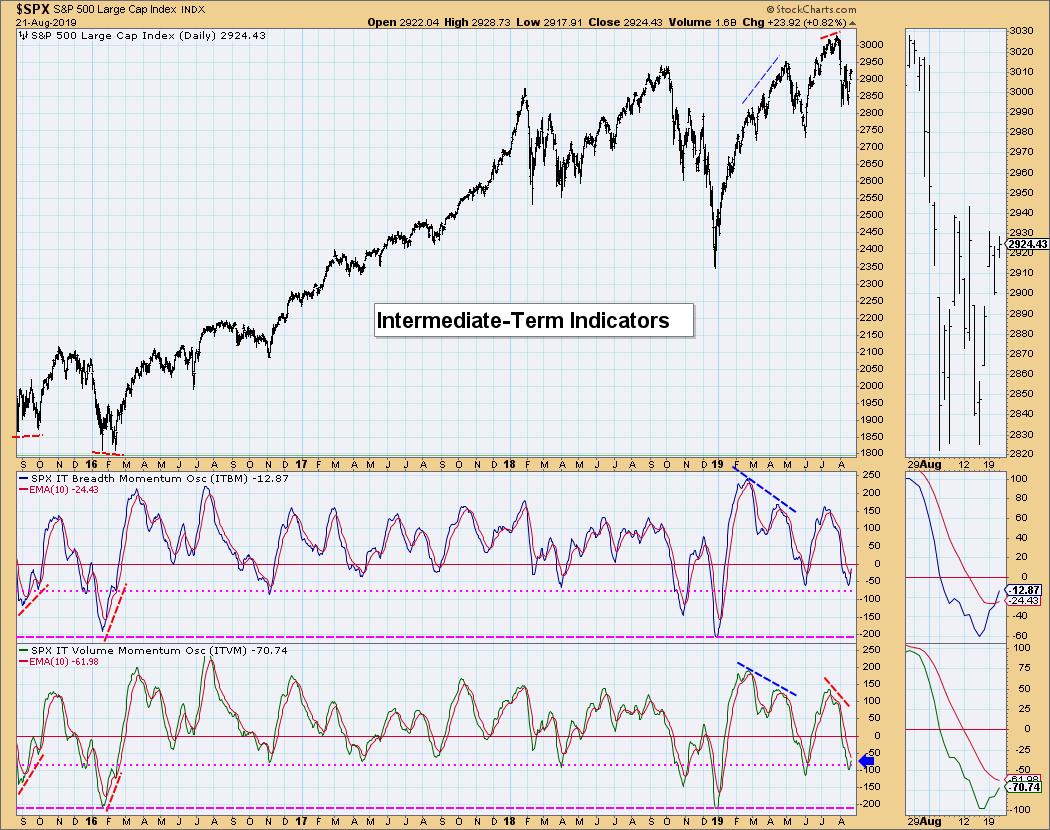
Conclusion: The markets are rocky and I don't think we are completely out of the woods right now. However, indicators are looking more bullish, which should at least instill more confidence. The question is how long before we see another possible pullback or correction. Watch the Swenlin Trading Oscillators, as I believe they will be a great barometer. They are close to overbought. A top here would like be an attention flag to tighten stops.
DOLLAR (UUP)
IT Trend Model: BUY as of 2/7/2019
LT Trend Model: BUY as of 5/25/2018
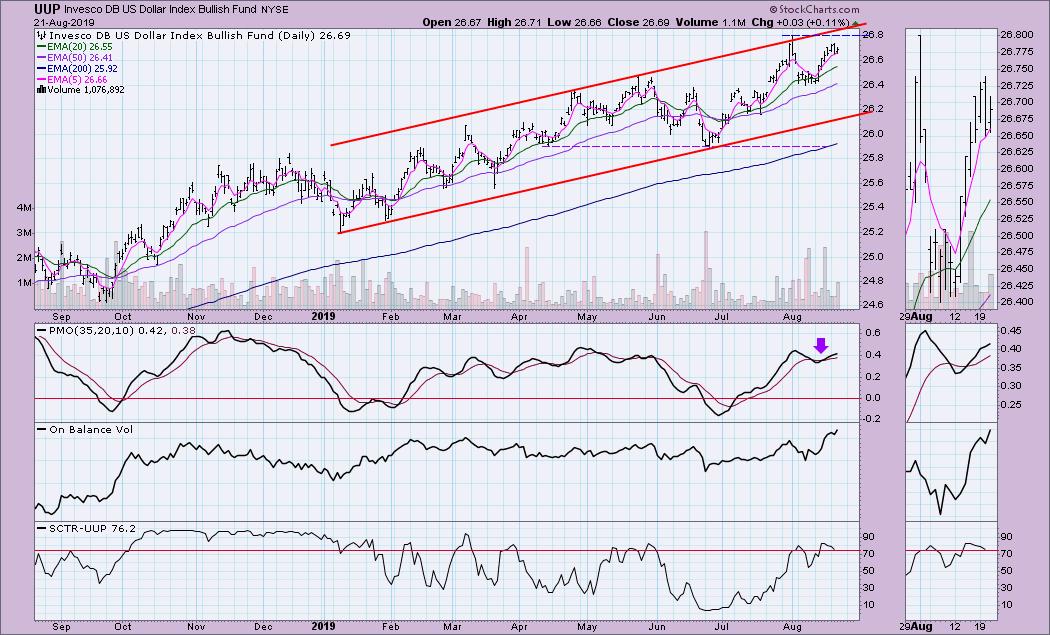
UUP Daily Chart: UUP is traveling safely within an intermediate-term rising trend channel. It didn't quite reach the high for the year before turning down, but the rising PMO and very positive OBV suggest it should make another run at it soon.
GOLD
IT Trend Model: BUY as of 6/3/2019
LT Trend Model: BUY as of 1/8/2019
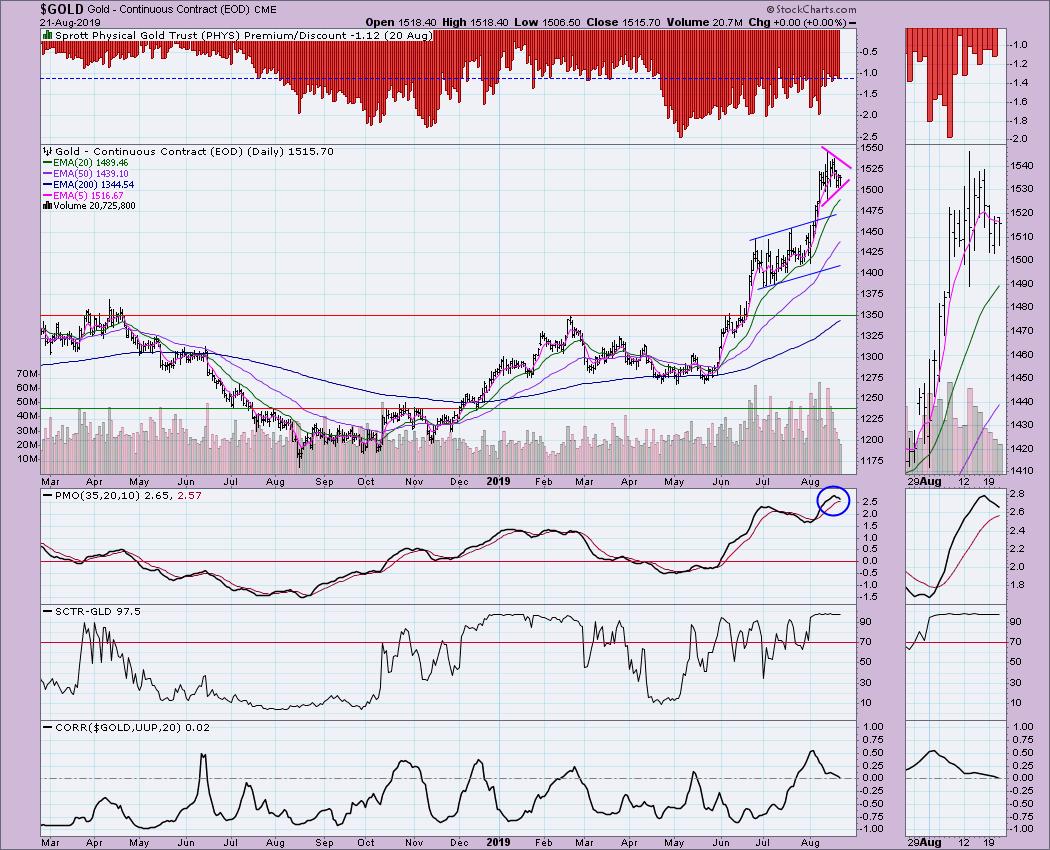
GOLD Daily Chart: Gold is pausing and has formed a symmetrical triangle. These are continuation patterns. It appears we are taking a breather before another move to the upside. I am bothered by the PMO top in overbought territory, but we could see it unwind if we continue to consolidate sideways.
CRUDE OIL (USO)
IT Trend Model: Neutral as of 5/30/2019
LT Trend Model: SELL as of 6/4/2019
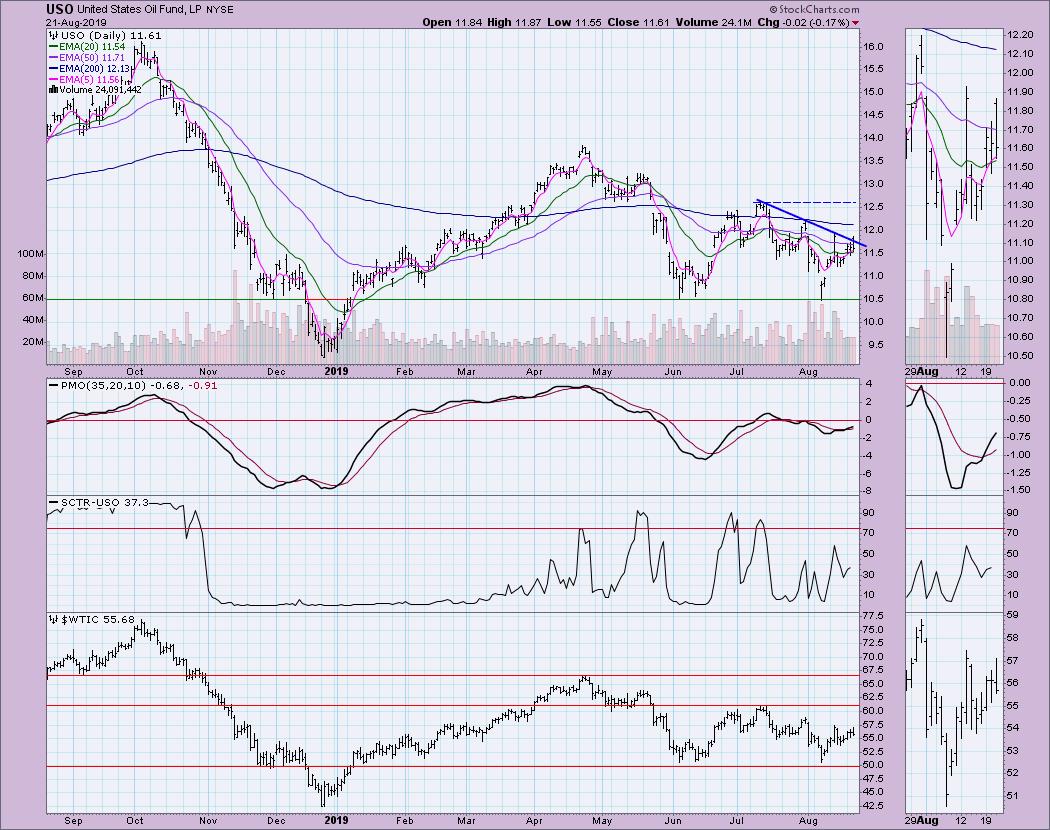
USO Daily Chart: Oil nearly broke above the declining tops trend line that has held since July. There's a nice PMO BUY signal, so I am expecting a breakout.
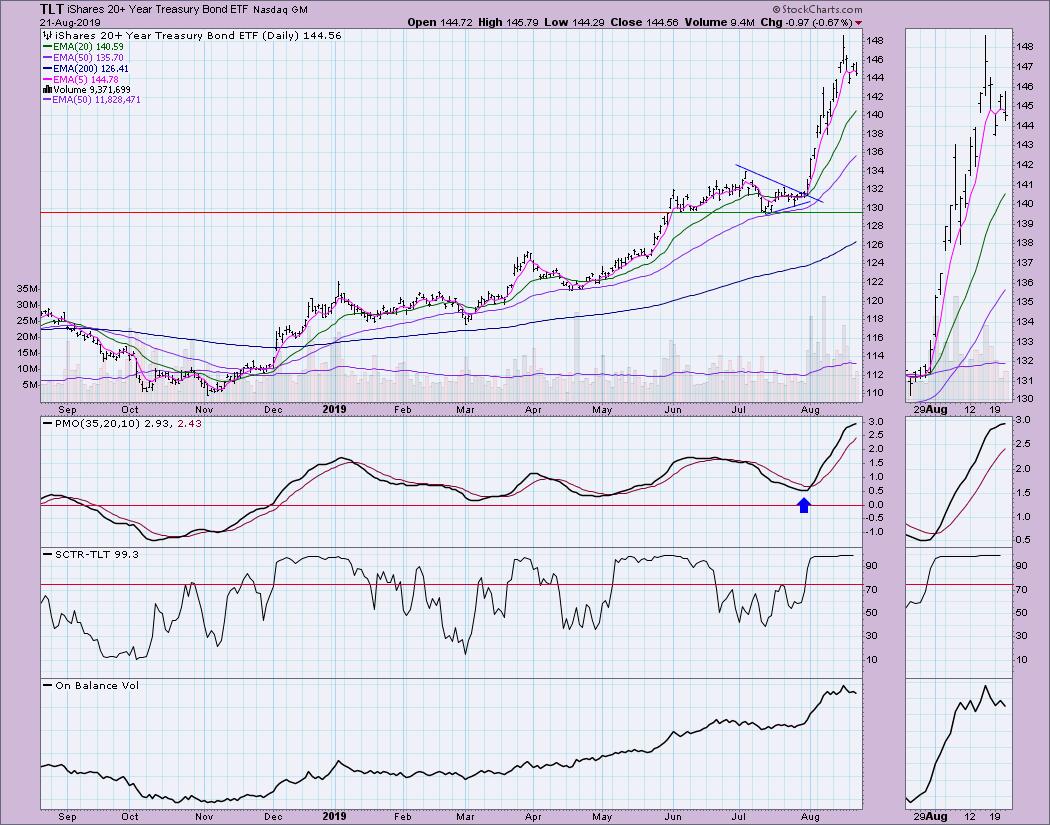
BONDS (TLT)
IT Trend Model: BUY as of 12/6/2018
LT Trend Model: BUY as of 1/2/2019
TLT Daily Chart: Bonds are pausing and rightly so. The mania appears to be over. I would look for some consolidation, similar to what is going on in Gold, so that the PMO can move lower and back into its normal range.
Technical Analysis is a windsock, not a crystal ball.
Happy Charting! - Erin
Email: erinh@stockcharts.com
**Don't miss any of the DecisionPoint commentaries! Go to the "Notify Me" box toward the end of this blog page to be notified as soon as they are published.**
NOTE: The signal status reported herein is based upon mechanical trading model signals, specifically, the DecisionPoint Trend Model. They define the implied bias of the price index based upon moving average relationships, but they do not necessarily call for a specific action. They are information flags that should prompt chart review. Further, they do not call for continuous buying or selling during the life of the signal. For example, a BUY signal will probably (but not necessarily) return the best results if action is taken soon after the signal is generated. Additional opportunities for buying may be found as price zigzags higher, but the trader must look for optimum entry points. Conversely, exit points to preserve gains (or minimize losses) may be evident before the model mechanically closes the signal.
Helpful DecisionPoint Links:
DecisionPoint Shared ChartList and DecisionPoint Chart Gallery
Price Momentum Oscillator (PMO)
Swenlin Trading Oscillators (STO-B and STO-V)


