
In today's Diamond Report, I decided to look at only three stocks as I want to discuss not only their daily charts, but their weekly charts as well. Seeing strength in both timeframes can provide the option to trade in the shorter term or in the longer term. As for me, I remain less than optimistic about a breakout to new all-time highs and therefore will remain on the sidelines in 60% cash. Watch this week's edition of the DecisionPoint show to get more insight on the current market conditions. (You can find it on the DecisionPoint playlist on the StockCharts YouTube channel.)
Welcome to "DecisionPoint Daily Diamonds", a newsletter in which we highlight five "diamonds in the rough" taken from the results of one of my DecisionPoint scans. Remember, these are not recommendations to buy or sell, but simply stocks that I found interesting. The objective is to save you the work of the initial, tedious culling process, but you need to apply your own analysis and to see if these stocks pique your interest. There are no guaranteed winners here.
Current Market Outlook:
Market Trend: Currently have new Short-Term Trend Model BUY signals on the DP Scoreboard Indexes. The NDX has a new PMO BUY signal, but the SPX, OEX and Dow have some distance to travel before they will move from their PMO SELL signals.
Market Condition: The market is overbought. Weak internals with Price Momentum Oscillator SELL Signals on DP Scoreboard Indexes in IT and LT.
Market Environment: It is important to consider the "odds" for success. Here are the current percentages on the Silver and Golden Cross Indexes:
- Silver Cross: 51.8% SPX ITTM Buy Signals (20-EMA > 50-EMA)
- Golden Cross: 64.2% SPX LTTM Buy Signals (50-EMA > 200-EMA)
Diamond Index:
- Diamond Scan Results: 34
- Diamond Dog Scan Results: 0
- Diamond Bull/Bear Ratio: 34
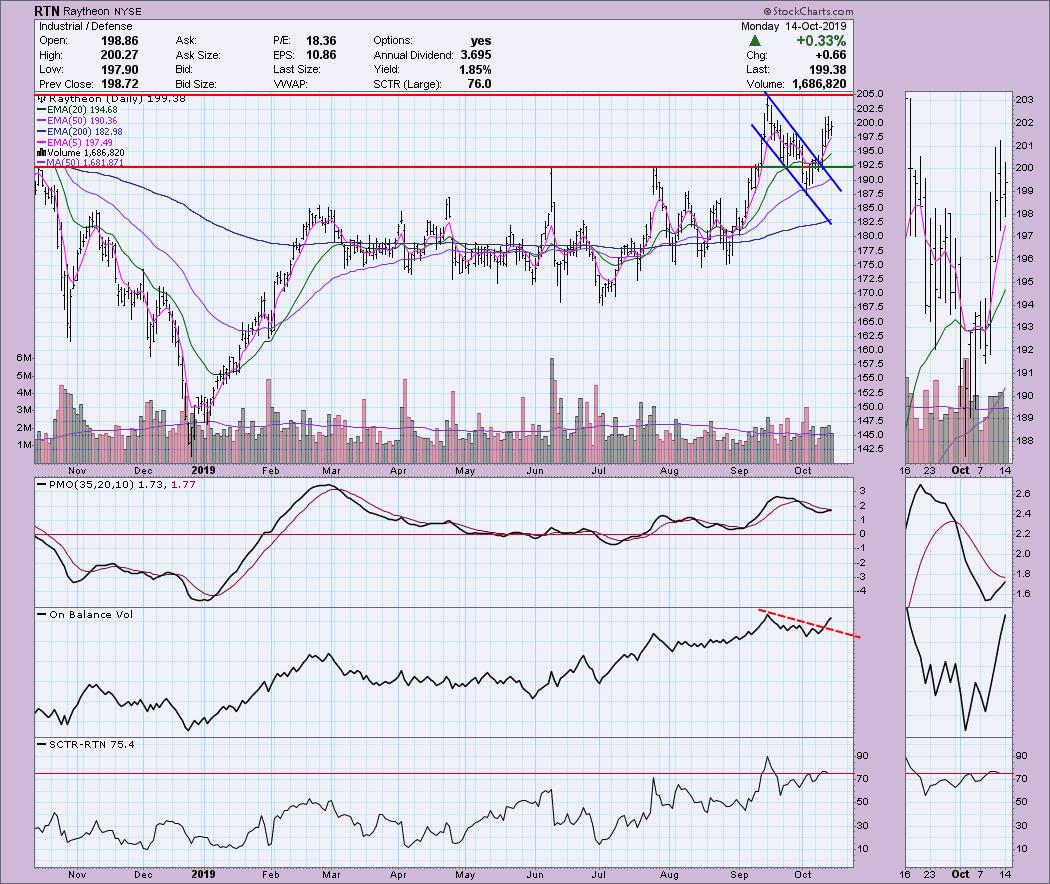
Raytheon (RTN) - Earnings: 10/24/2019
Raytheon experienced a nice breakout from a fairly steep declining trend channel. Overhead resistance hasn't yet hit and I like that, following the big rally, it began to consolidate the move. The PMO remained in an uptrend and should give us a BUY signal very soon. The EMAs are strongly configured, with faster ones on top and a healthy margin between each EMA. The PMO is somewhat overbought but the OBV looks strong.
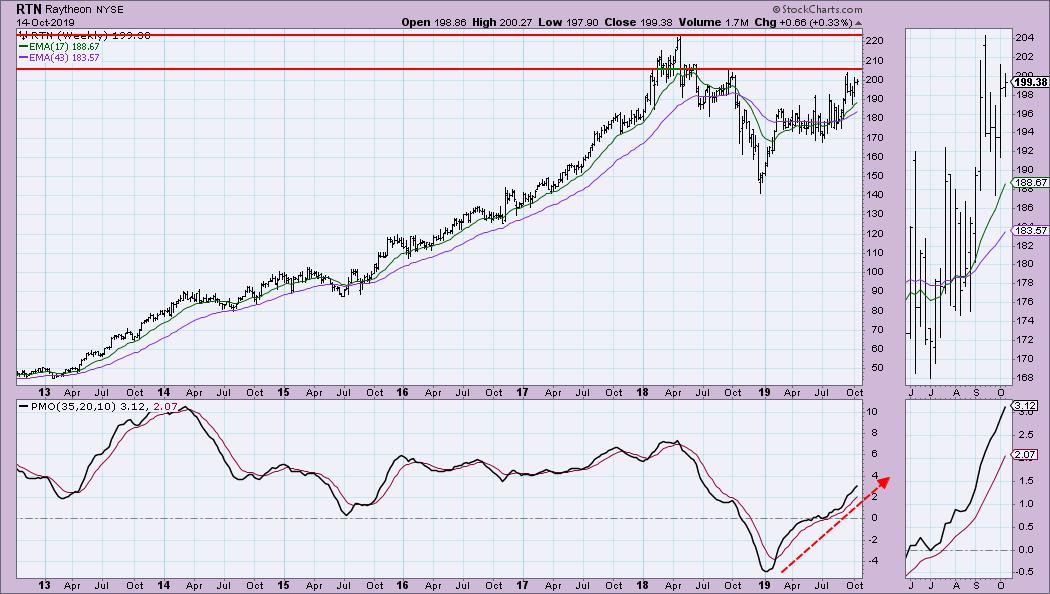
The weekly chart does show strong overhead resistance at both 2018 tops. I still expect a breakout given the rising PMO, which is far from overbought.
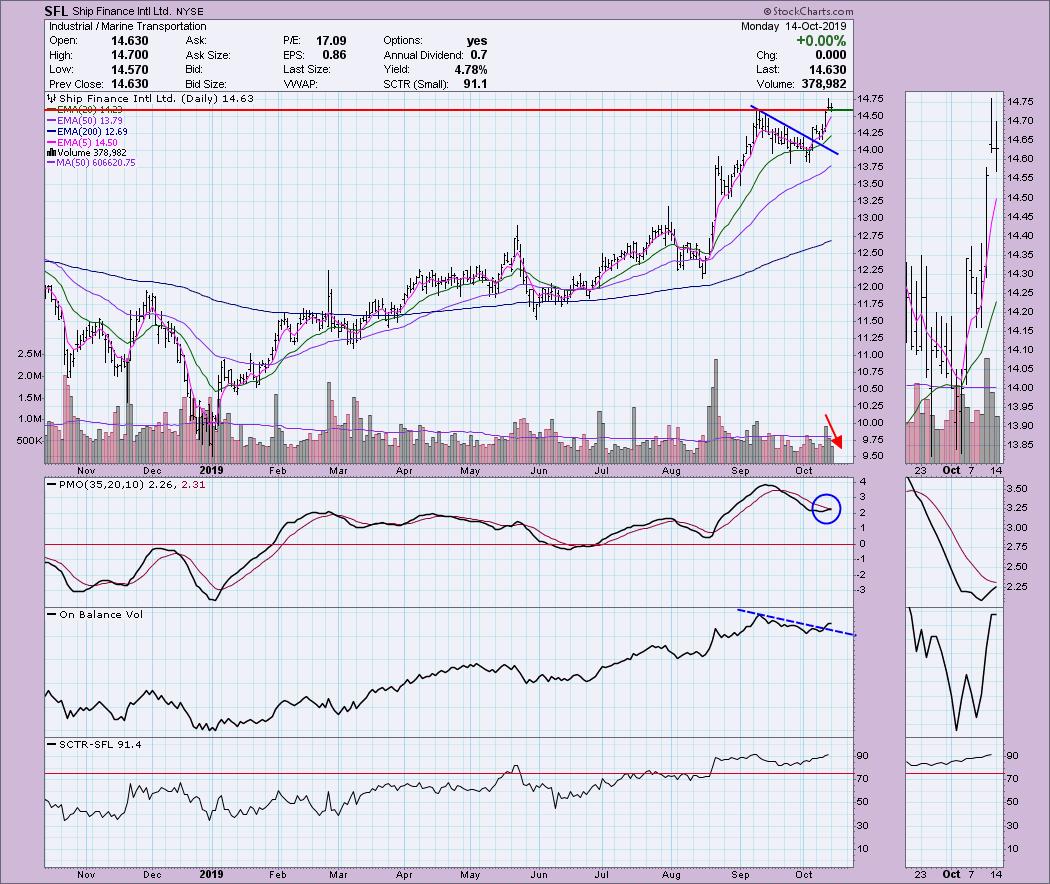
Ship Finance Intl (SFL) - Earnings: 11/18 - 11/22/2019
SFL broke out from a declining trend, then pulled back. On Thursday, it popped higher; then, on Friday, it consolidated the move. The volume coming in on the last three days of rally isn't overly encouraging, but the OBV saw a breakout and did top before passing the top from earlier in September. Although the current price top is above the September price, the OBV did not provide a higher top. This is a reverse divergence, which could be a problem. The SCTR remains strong and the PMO is about to give us a BUY signal, so I might forgive the volume issue.
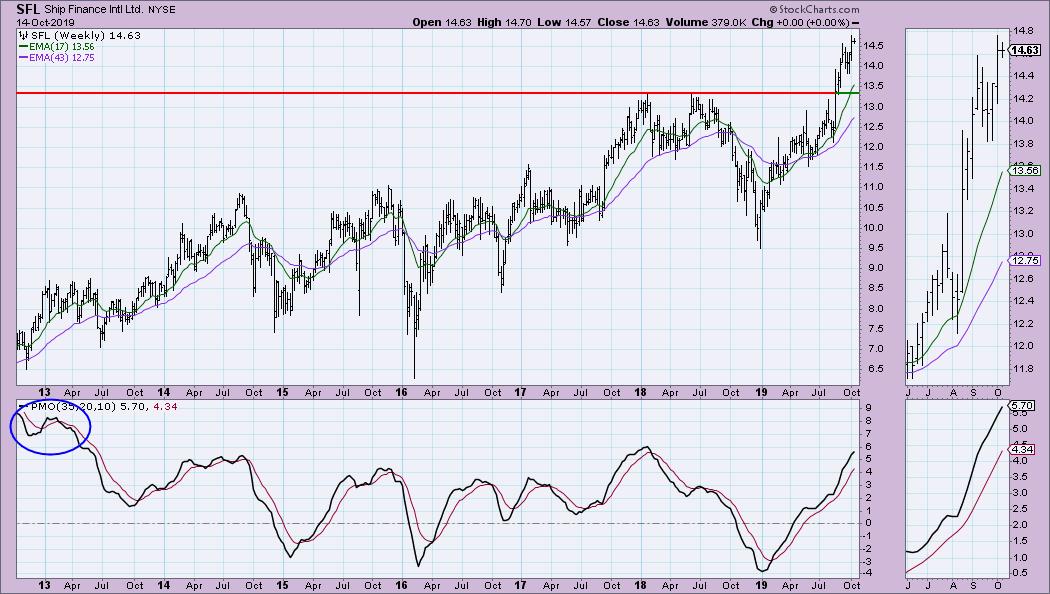
The weekly chart shows a strong breakout to new highs this year and a strongly rising PMO. The PMO may be considered overbought, but let's note that we saw much higher PMO readings back in 2013.
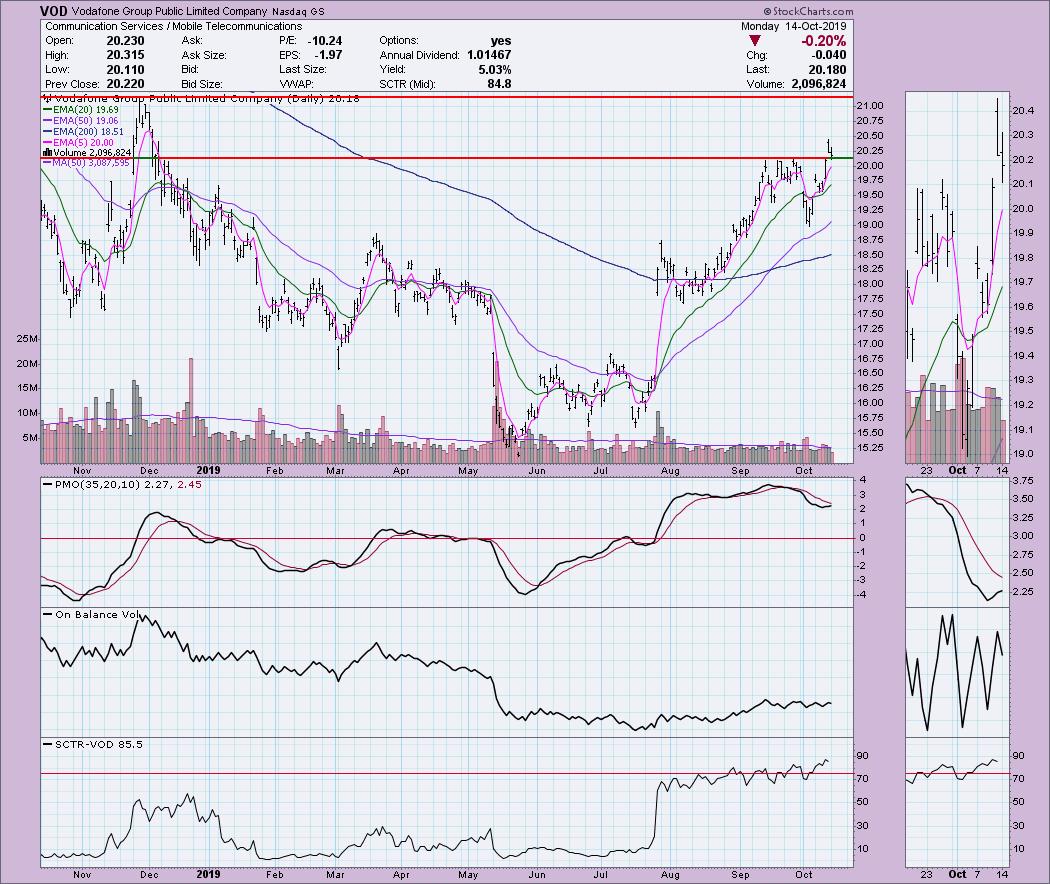
Vodafone Group Public Limited Co (VOD) - Earnings: 10/24/2019
VOD broke out on Friday. Since then, it has pulled back just far enough to close Friday's gap, before then closing above support at the September tops. The PMO is on the overbought side, but it is about to trigger a BUY signal. The OBV is unfortunately showing a reverse divergence. Higher price tops need to be supported by rising volume and we aren't seeing that. In any case, the upside potential is pretty good.
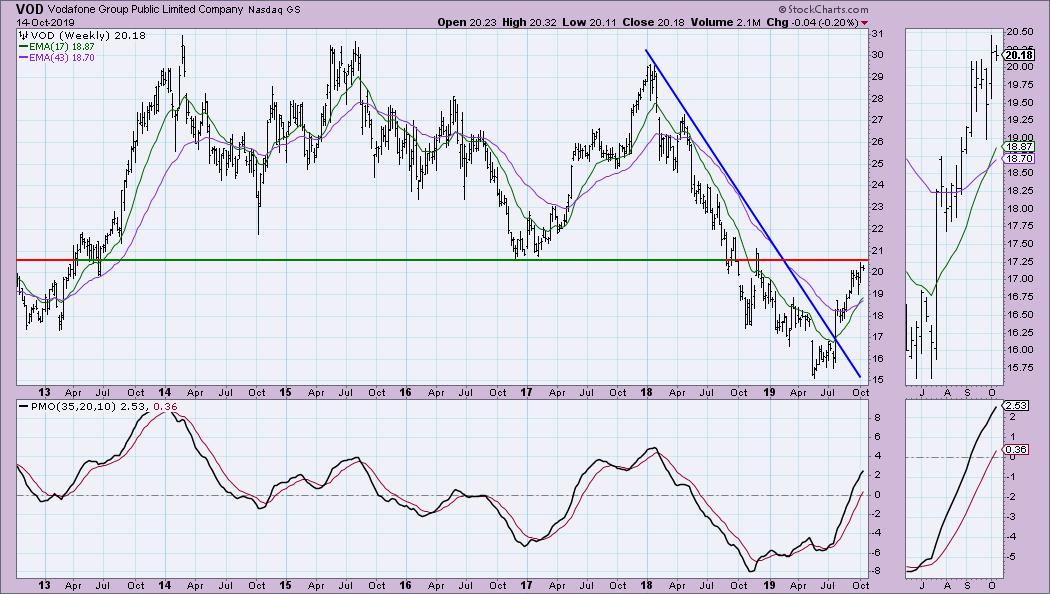
The weekly chart is encouraging as it shows the break from the declining trend in the summer. There is a positive crossover between the 17/43-EMAs and the PMO is not overbought yet. The issue is overhead resistance formed at the 2016/17 lows. If it breaks above current overhead resistance on the weekly chart, upside potential is tasty.
Full Disclosure: I do not own any of the stocks above and I am not planning on purchasing these or any additional stocks at this time. I'm currently about 60% in cash and watching my stops closely.
Watch the latest episode of DecisionPoint with Carl & Erin Swenlin LIVE on Mondays 5:00p EST or on the StockCharts TV YouTube channel here!
Technical Analysis is a windsock, not a crystal ball.
Happy Charting!
- Erin
erinh@stockcharts.com
NOTE: The stocks reported herein are from mechanical trading model scans that are based upon moving average relationships, momentum and volume. DecisionPoint analysis is then applied to get five selections from the scans. The selections given should prompt readers to do a chart review using their own analysis process. This letter is not a call for a specific action to buy, sell or short any of the stocks provided. There are NO sure things or guaranteed returns on the daily selection of "diamonds in the rough."
Helpful DecisionPoint Links:
DecisionPoint Shared ChartList and DecisionPoint Chart Gallery
Price Momentum Oscillator (PMO)
Swenlin Trading Oscillators (STO-B and STO-V)
**Don't miss DecisionPoint Commentary! Add your email below to be notified of new updates"**


