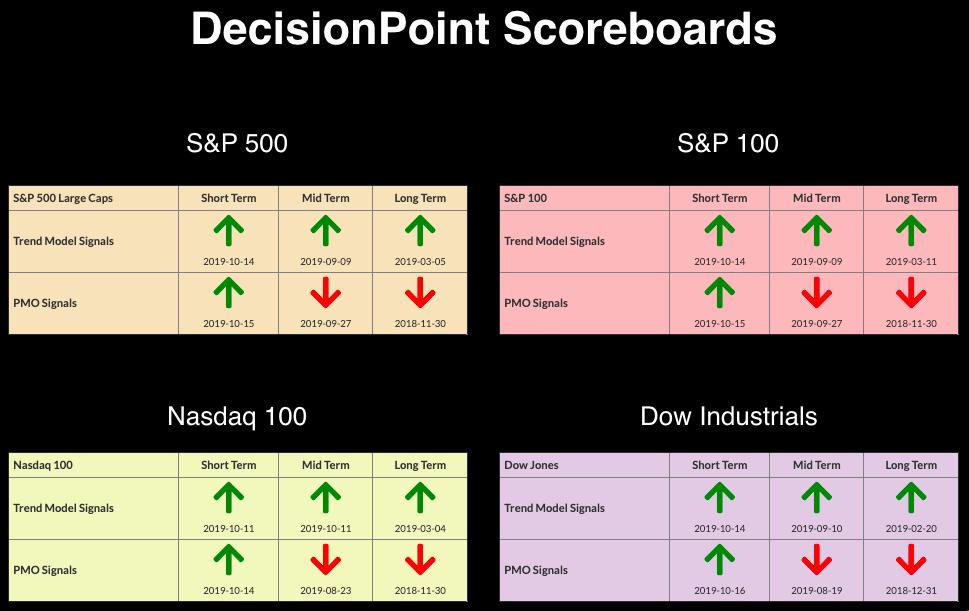
 The market continues to reach new all-time highs, but DecisionPoint remains cautious. The negative divergences on our Swenlin Trading Oscillators (STOs) is concerning and tempers the euphoria of reaching those all-time highs. Volume has been under the annual average and the Silver and Gold Cross Indexes tell us that less than 2/3 of SPX components have 20-EMAs above their 50-EMAs. Given the new all-time highs, this should be higher. The DecisionPoint Scoreboards tell us that the market is trending in the right direction overall; a look at the weekly PMOs suggests we will see IT PMO BUY signals on the Scoreboard indexes. Carl will be looking at the weekly PMO in this Friday's DecisionPoint Weekly Wrap.
The DecisionPoint Alert presents a mid-week assessment of the trend and condition of the stock market (S&P 500), the U.S. Dollar, Gold, Crude Oil and Bonds.
Watch the latest episode of DecisionPoint on StockCharts TV's YouTube channel here!
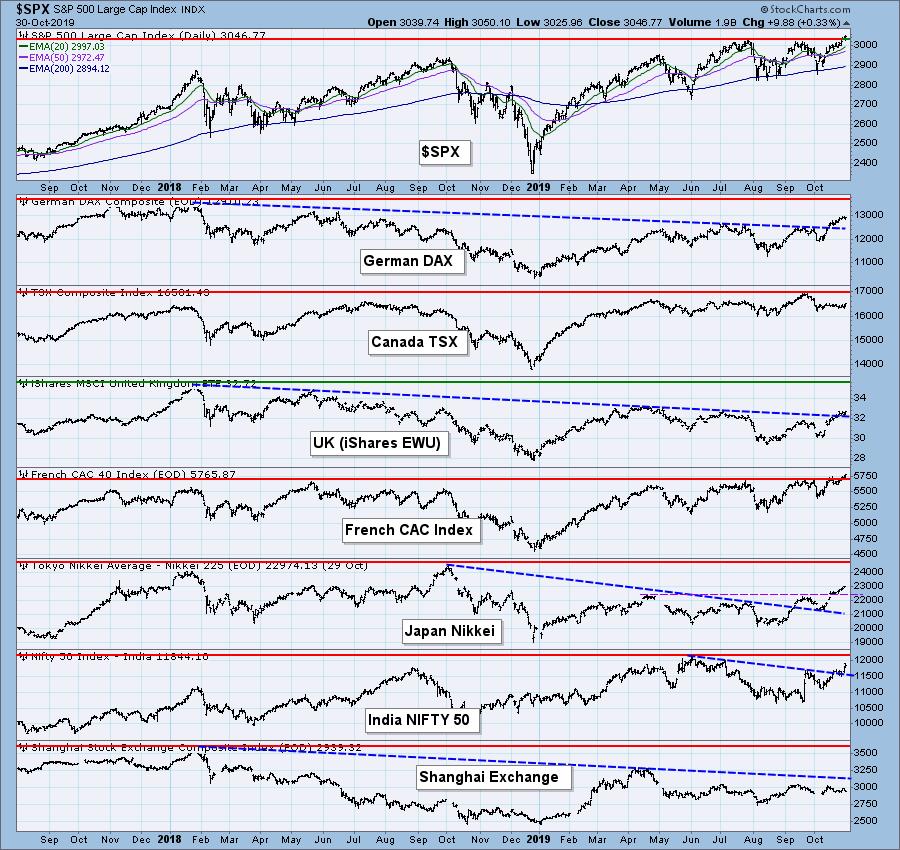
GLOBAL MARKETS
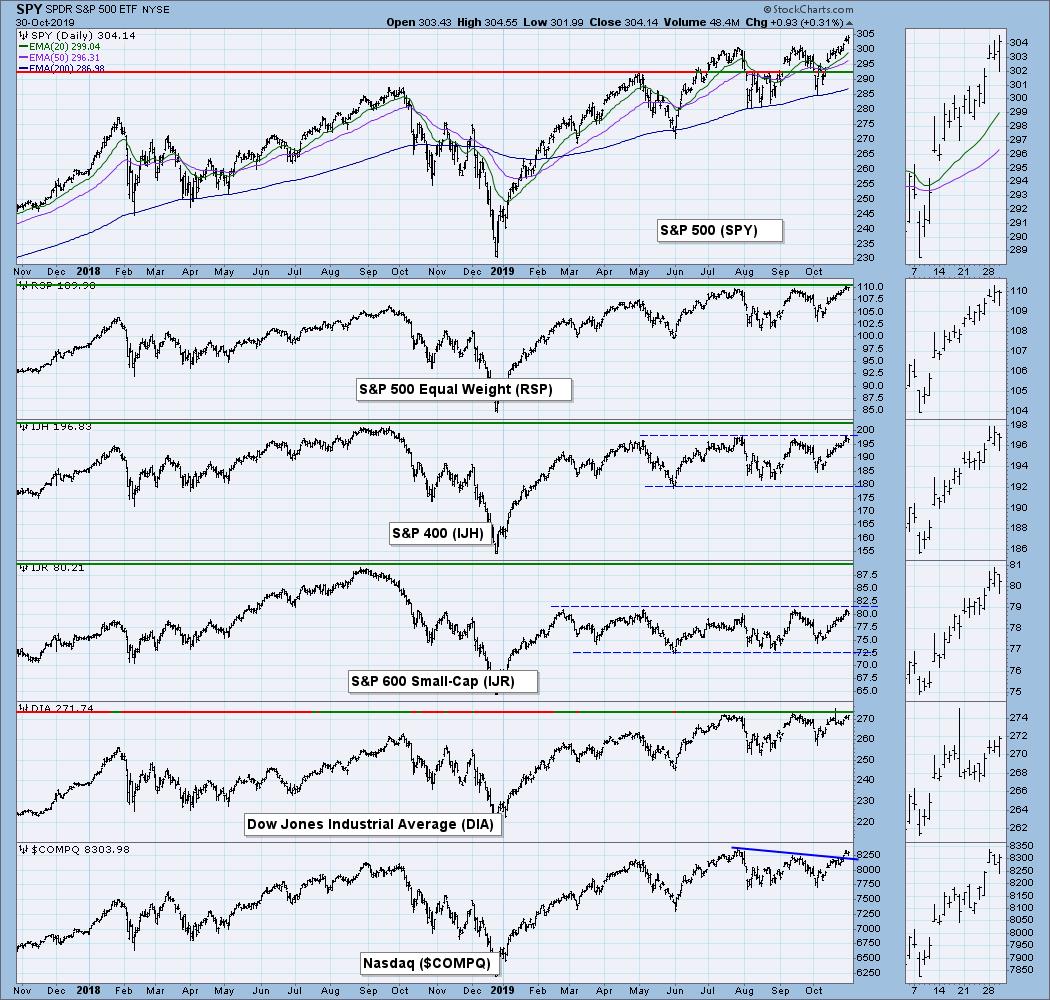
BROAD MARKET INDEXES
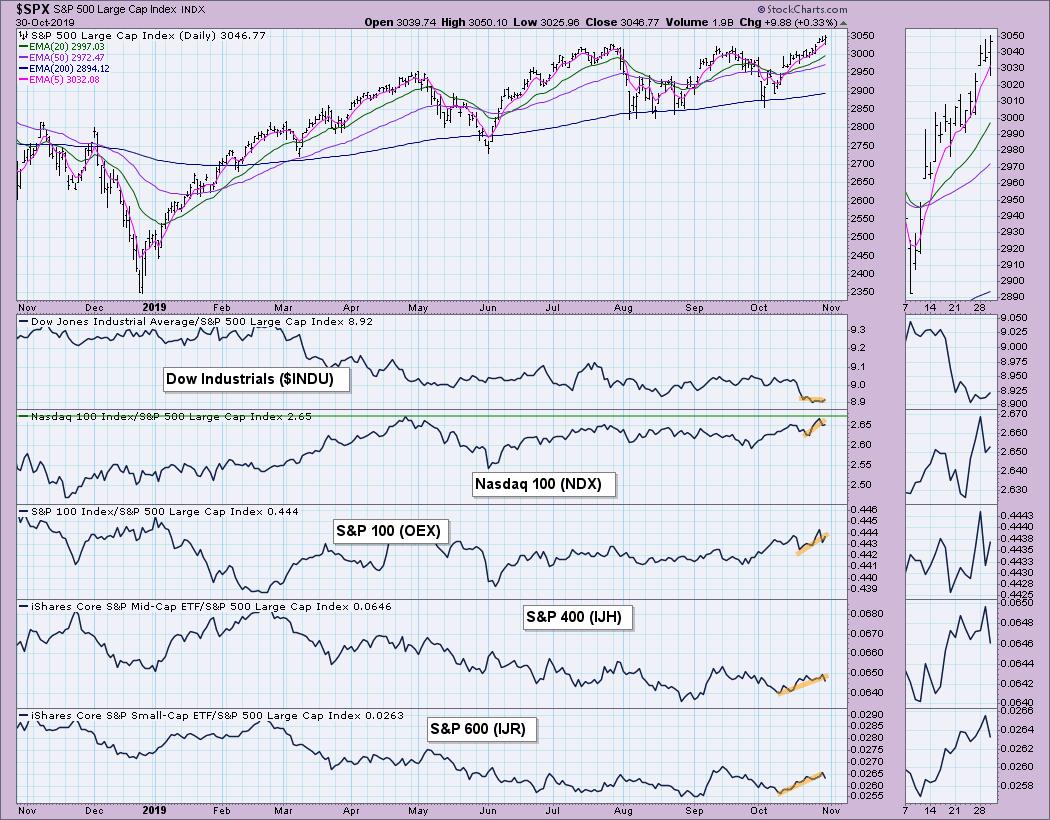
MARKET INDEXES PRICE RELATIVE TO SPX
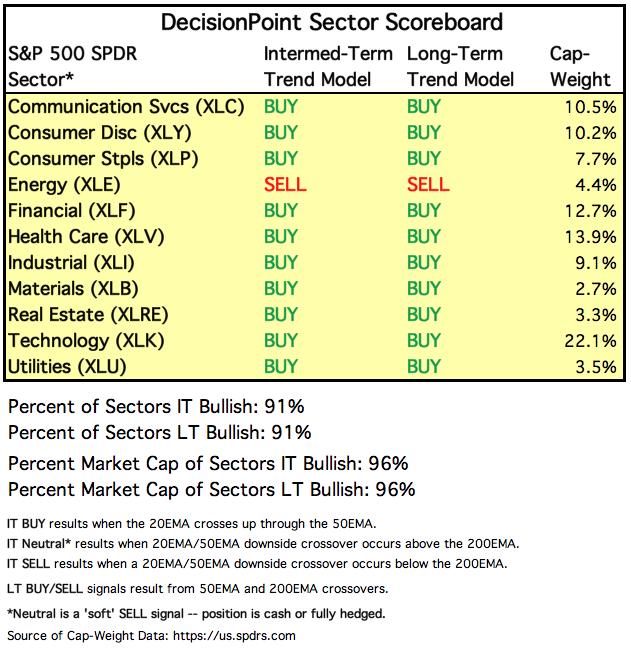
SECTORS
Each S&P 500 Index component stock is assigned to one, and only one, of eleven major sectors. This is a snapshot of the Intermediate-Term and Long-Term Trend Model signal status for those sectors.
STOCKS
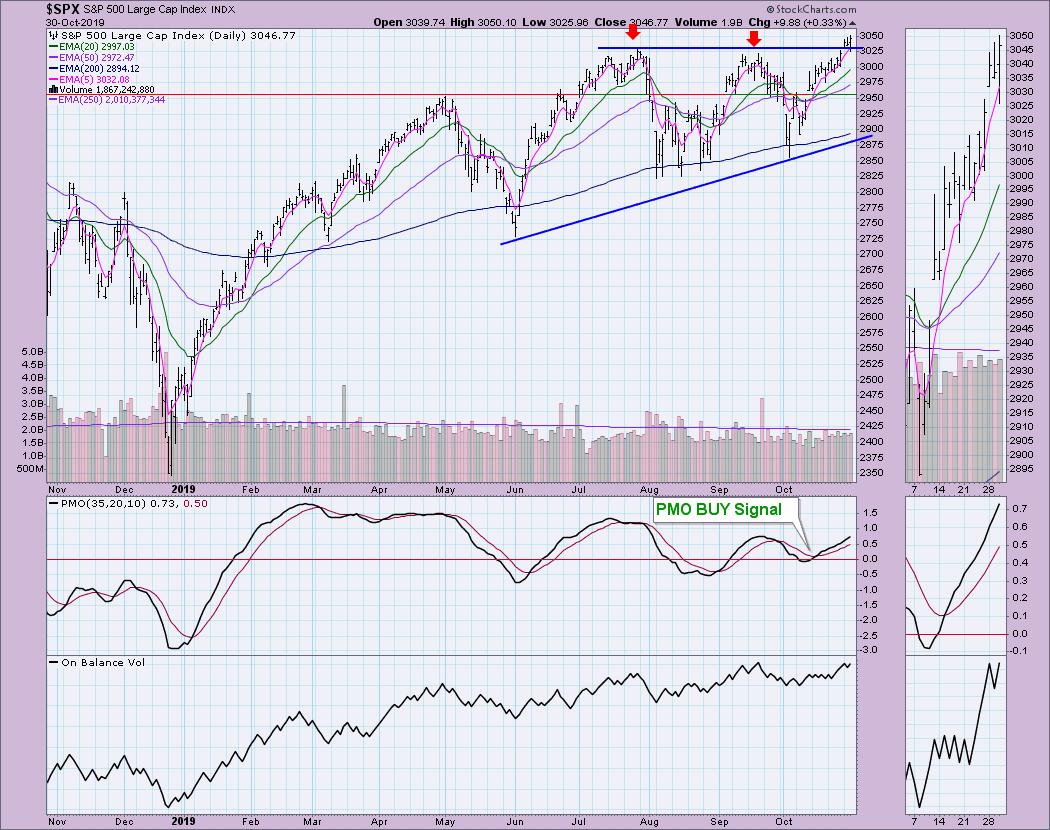
IT Trend Model: BUY as of 9/4/2019
LT Trend Model: BUY (SPY) as of 2/26/2019
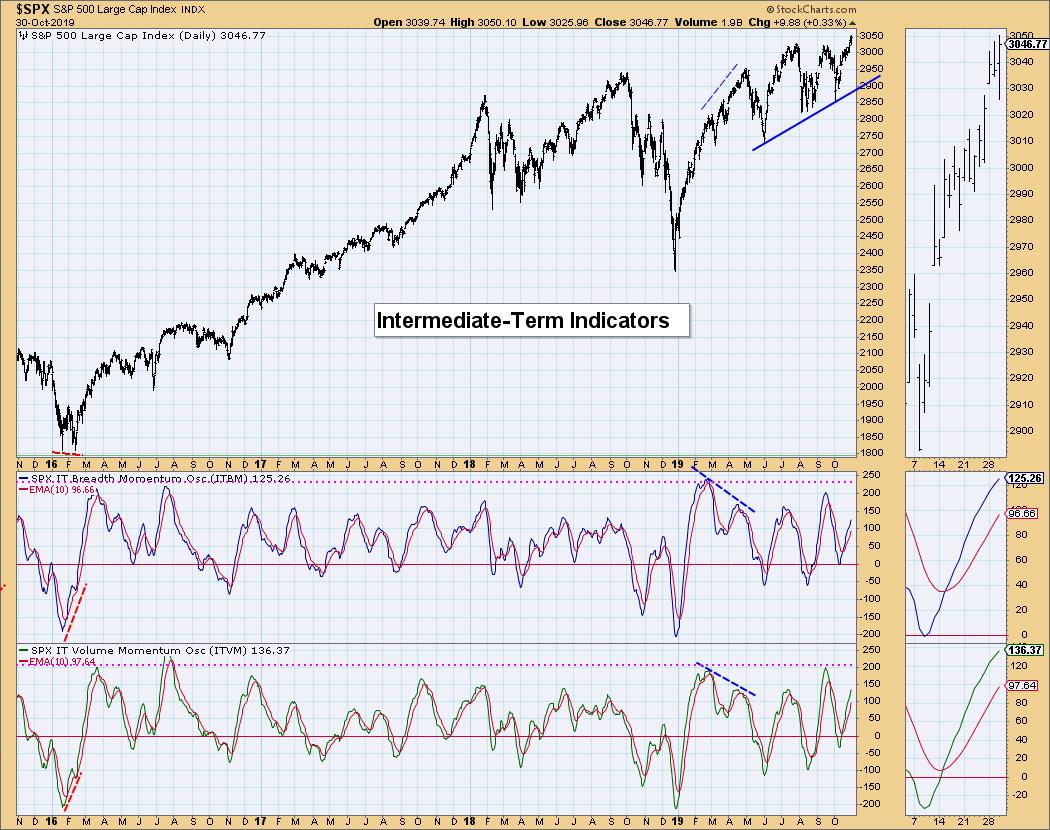
SPX Daily Chart: I continue to be skeptical of the bullish ascending triangle formation. I will change my thought process if we see a "decisive" breakout of 3% above the previous all-time highs. I had been considering Monday and Tuesday's price bars to likely be an island reversal, but today the gap was closed intraday and a new all-time high was set, so that pattern fell apart. If our short-term market indicators were confirming this breakout, I would certainly be more bullish.
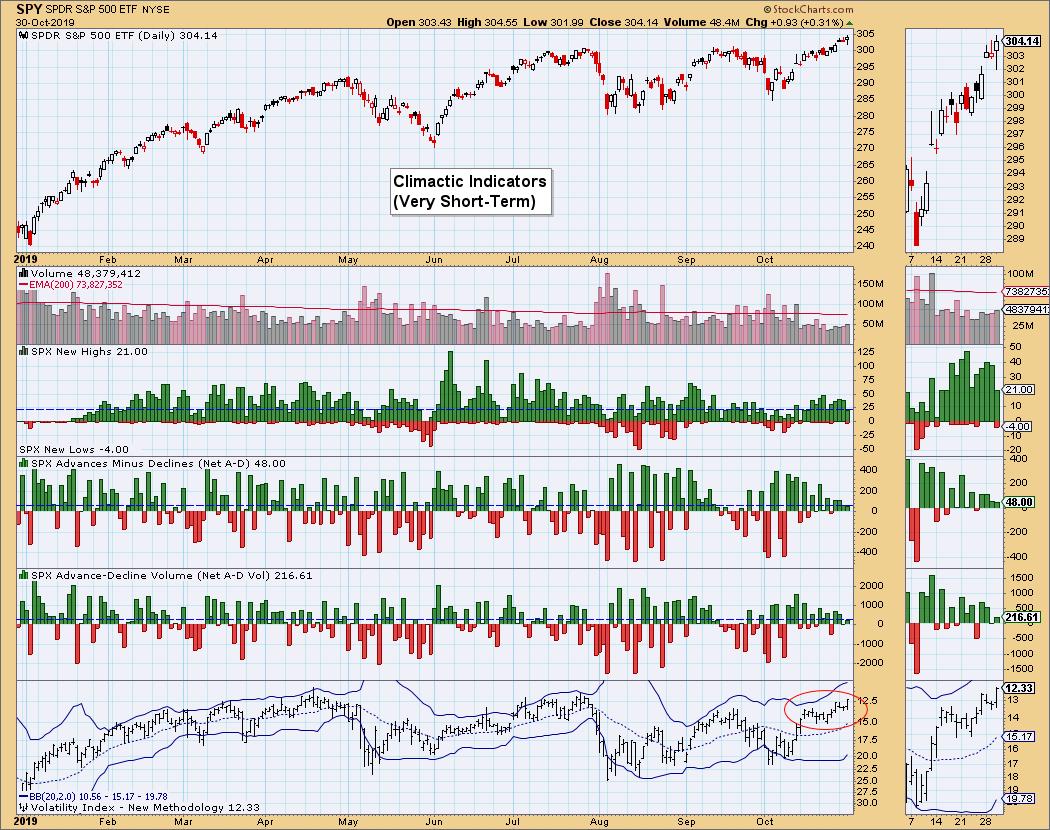
Climactic Market Indicators: New Highs dropped again today even as the all-time high was logged. The Advances Minus Declines shouldn't be moving lower either, but they are. The VIX is confirming and does have room to move toward the upper Bollinger Band. When I see the VIX penetrate the upper band, I look for a price decline. With that band being higher now, we could see more upside. However.....
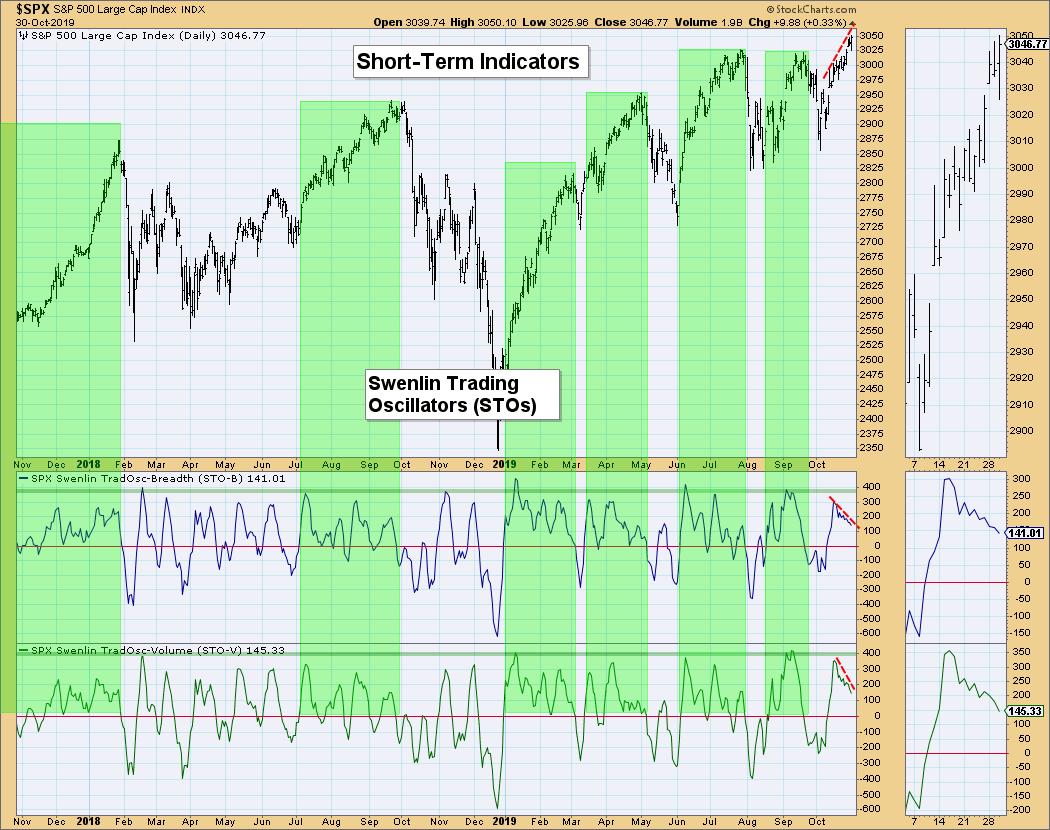
Short-Term Market Indicators: ...the short-term indicators are definitely NOT confirming this breakout to new all-time highs. I continue to look to this chart daily to see if the negative divergences are at least fading, but they are not. Today both Swenlin Trading Oscillators (STOs) continued to decline. The good news is that they do remain in positive territory and, typically, oscillation above the zero line is accompanied with price rises.
Intermediate-Term Market Indicators: I'm seeing a slight deceleration on the intermediate-term indicators, but all in all this chart is quite bullish. If you look at the rising bottoms trend line, you'll note that the rising trend could remain intact even if price falls down toward 2900.
Conclusion: I don't like to be a "Debby Downer" when the stock market is making new all-time highs, but that short-term indicator chart and the breadth numbers on the ultra-short-term indicator chart have me worried about the tenacity of this current rally. I remain cautiously bullish.
DOLLAR (UUP)
IT Trend Model: BUY as of 2/7/2019
LT Trend Model: BUY as of 5/25/2018
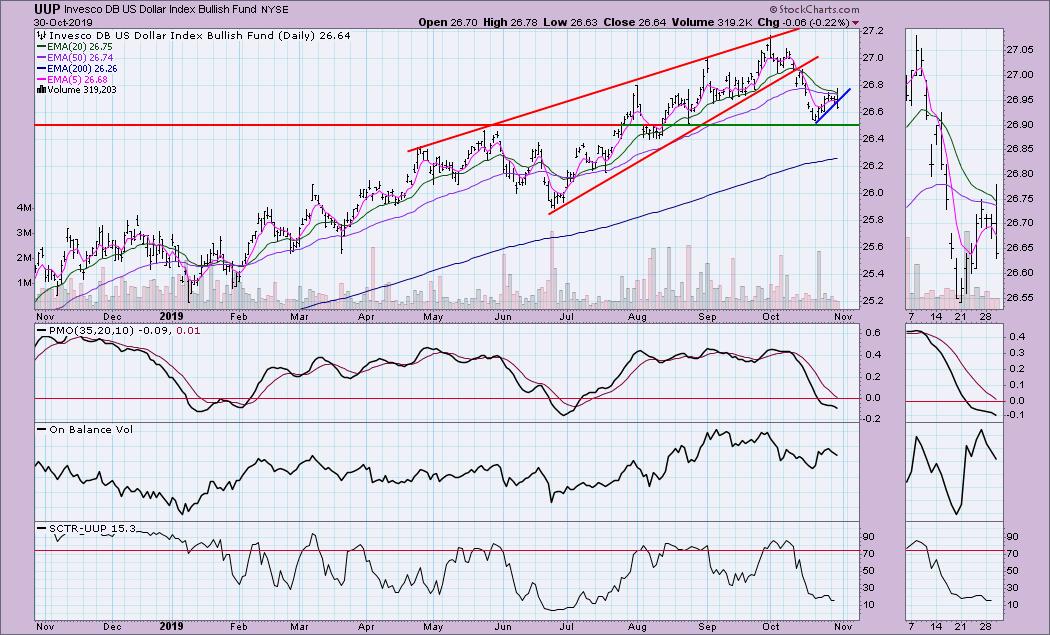
UUP Daily Chart: I was feeling better about the Dollar last week when we saw the bounce off support at the May high, but today's price action bothers me, as a short-term declining trend has been broken and the PMO has begun to accelerate lower.
GOLD
IT Trend Model: BUY as of 6/3/2019
LT Trend Model: BUY as of 1/8/2019
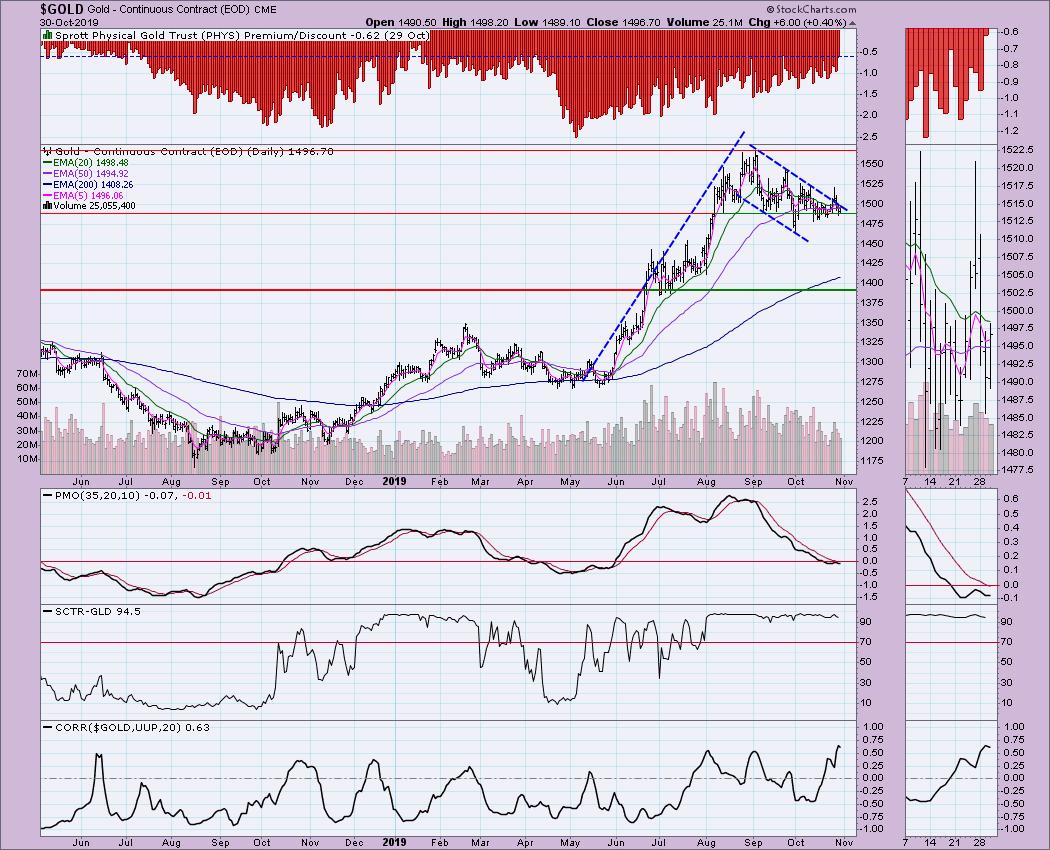
GOLD Daily Chart: It looked like the bull flag was going to execute last week but, instead, price dropped quickly on Friday. I'm happy to see that support is being held in the shorter term. I'm noting that discounts are starting to lower, which is currently bullish, but, when we start to see premiums, that would tell us that sentiment is very bullish - which of course is bearish for Gold, as sentiment is a contrarian indicator. The PMO is in oversold territory and is trying to turn back up. I'm still looking for a breakout and a move toward the September top. I'm not sold on the bull flag reaching its minimum upside target (which would be well over $2000), but a rally is due. If the market takes a header like the short-term indicators are suggesting, Gold would likely benefit.
CRUDE OIL (USO)
IT Trend Model: SELL as of 10/2/2019
LT Trend Model: SELL as of 6/4/2019
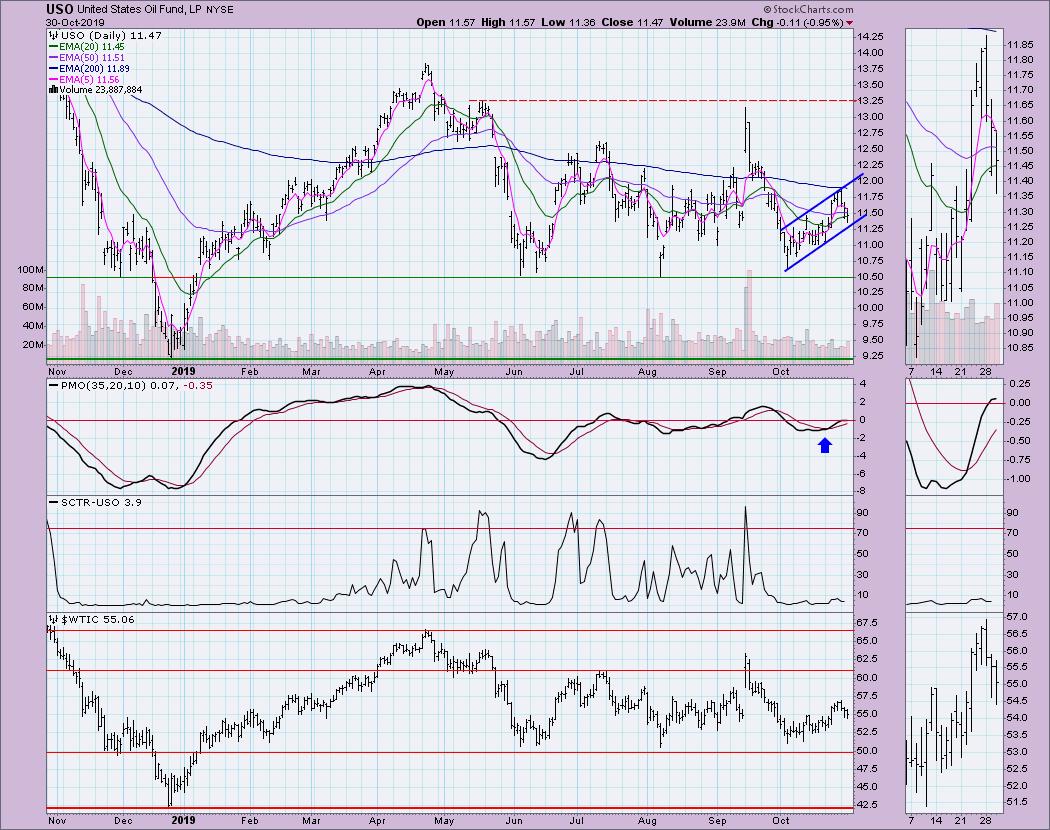
USO Daily Chart: Oil is having a difficult week so far, but the rising trend channel remains intact. I suspect we might be ready to head toward the top of the trading channel at the September top; it just might take a while to get there.
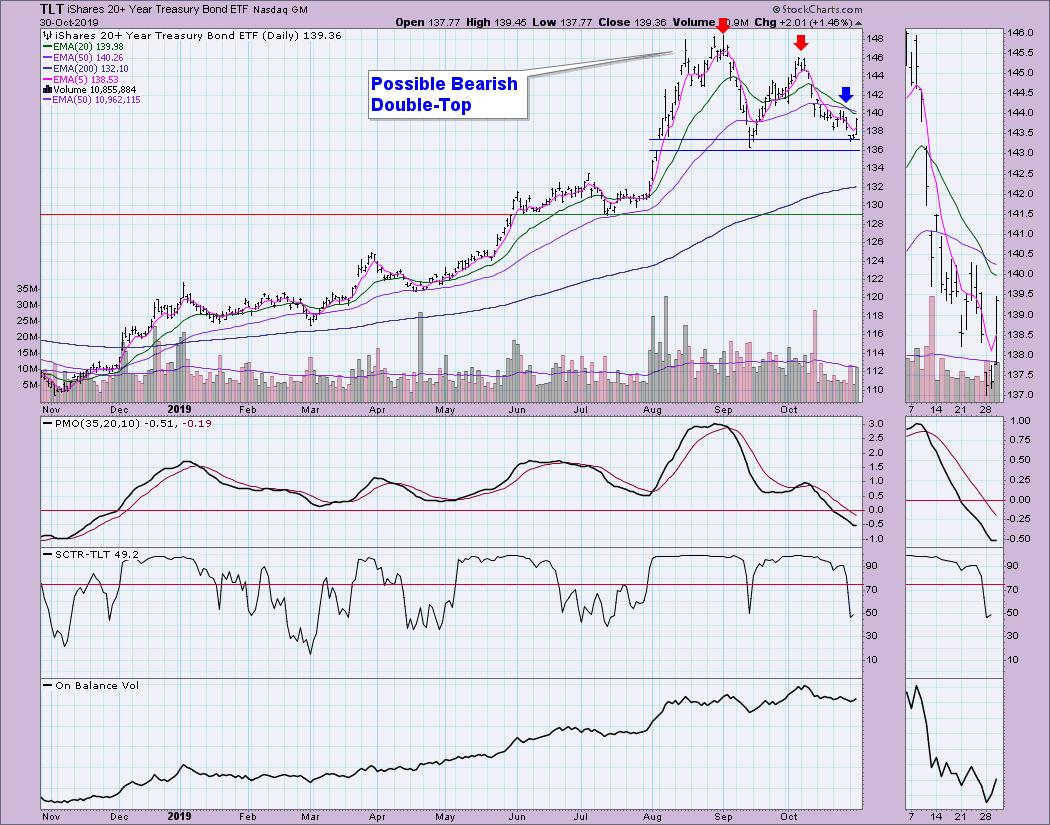
BONDS (TLT)
IT Trend Model: BUY as of 12/6/2018
LT Trend Model: BUY as of 1/2/2019
TLT Daily Chart: The double-top is still in play and, with the recent IT Trend Model Neutral signal, it is plausible it could execute. However, the PMO is turning up in oversold territory. The OBV is currently confirming the downtrend with its declining tops.
Technical Analysis is a windsock, not a crystal ball.
Happy Charting! - Erin
Email: erinh@stockcharts.com
**Don't miss any of the DecisionPoint commentaries! Go to the "Notify Me" box toward the end of this blog page to be notified as soon as they are published.**
NOTE: The signal status reported herein is based upon mechanical trading model signals, specifically the DecisionPoint Trend Model. These define the implied bias of the price index based upon moving average relationships, but they do not necessarily call for a specific action. They are information flags that should prompt chart review. Further, they do not call for continuous buying or selling during the life of the signal. For example, a BUY signal will probably (but not necessarily) return the best results if action is taken soon after the signal is generated. Additional opportunities for buying may be found as price zigzags higher, but the trader must look for optimum entry points. Conversely, exit points to preserve gains (or minimize losses) may be evident before the model mechanically closes the signal.
Helpful DecisionPoint Links:
DecisionPoint Shared ChartList and DecisionPoint Chart Gallery
Price Momentum Oscillator (PMO)
Swenlin Trading Oscillators (STO-B and STO-V)


