
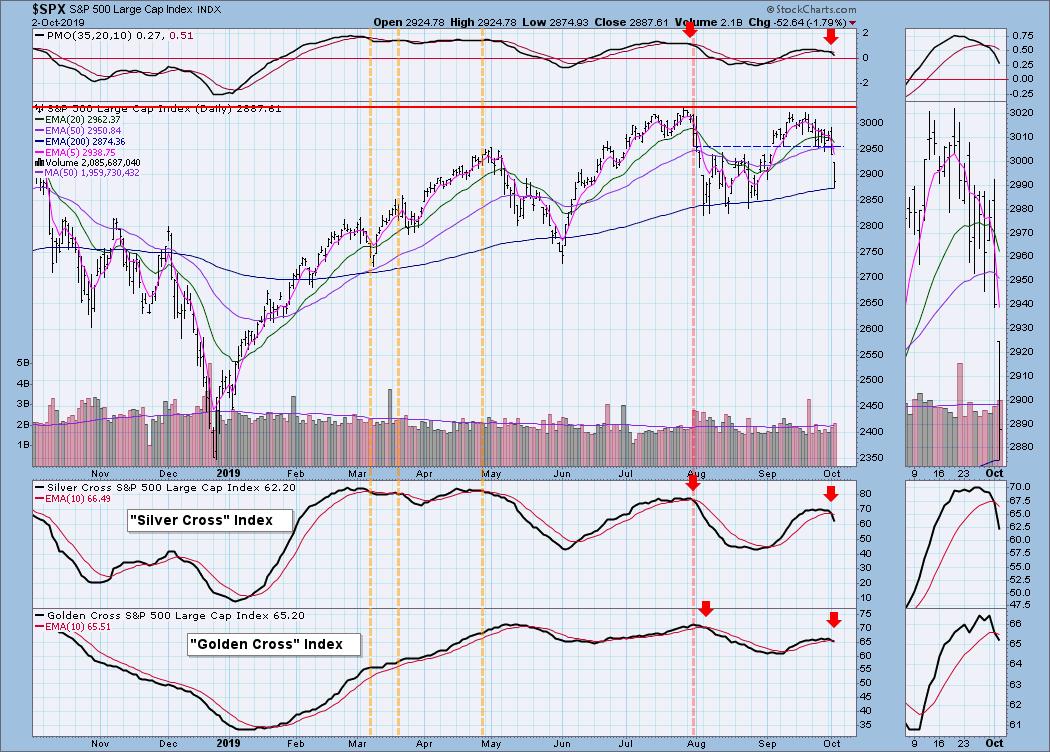
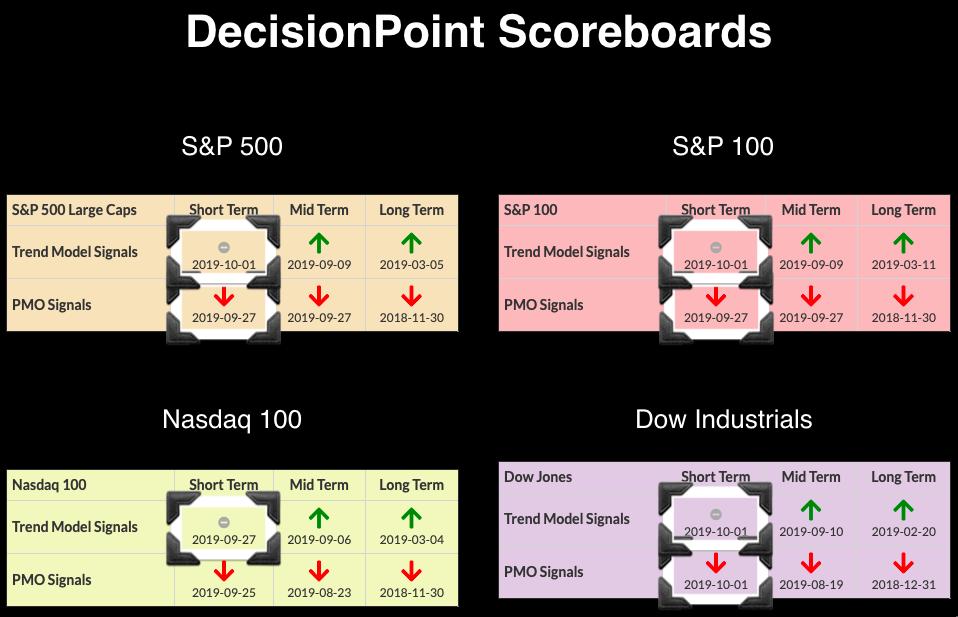
The newly minted "Golden Cross Index" and "Silver Cross Index" had negative crossovers today. I noticed that these negative crossovers tend to have serious consequences when the "stars" align on the Golden/Silver Cross Index and PMO indicators. This is in conjunction with all the other bearish signals this past week on the DecisionPoint Scoreboards. The Price Momentum Oscillators (PMOs) gave us an accurate warning last Friday with SELL signals, while yesterday the Short-Term Trend Model (STTM) triggered Neutral signals to remind us of the bearishness. Now, we have negative crossovers on the Gold and Silver Cross Indexes. USO triggered an Intermediate-Term Trend Model (ITTM) SELL signal today as Oil continues to travel downward.
The DecisionPoint Alert presents a mid-week assessment of the trend and condition of the stock market (S&P 500), the U.S. Dollar, Gold, Crude Oil and Bonds.
Watch the latest episode of DecisionPoint on StockCharts TV's YouTube channel here!
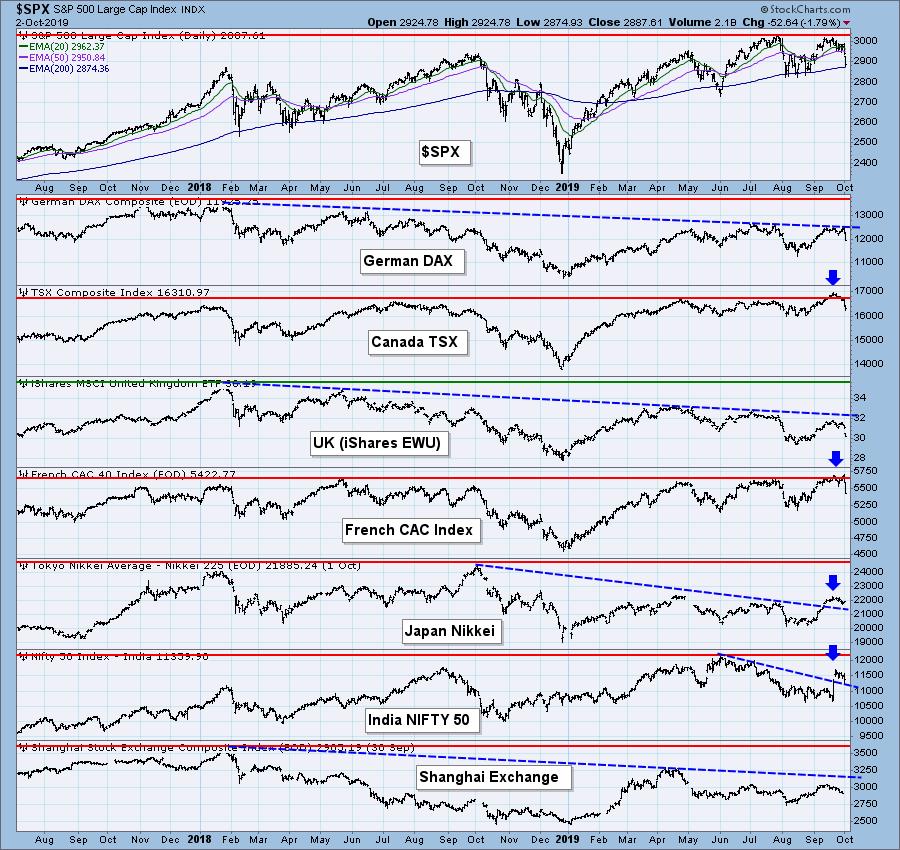
GLOBAL MARKETS
After some positive breakouts for many of the foreign exchanges, most were severely damaged by the US markets' decline today. Many were already losing ground.
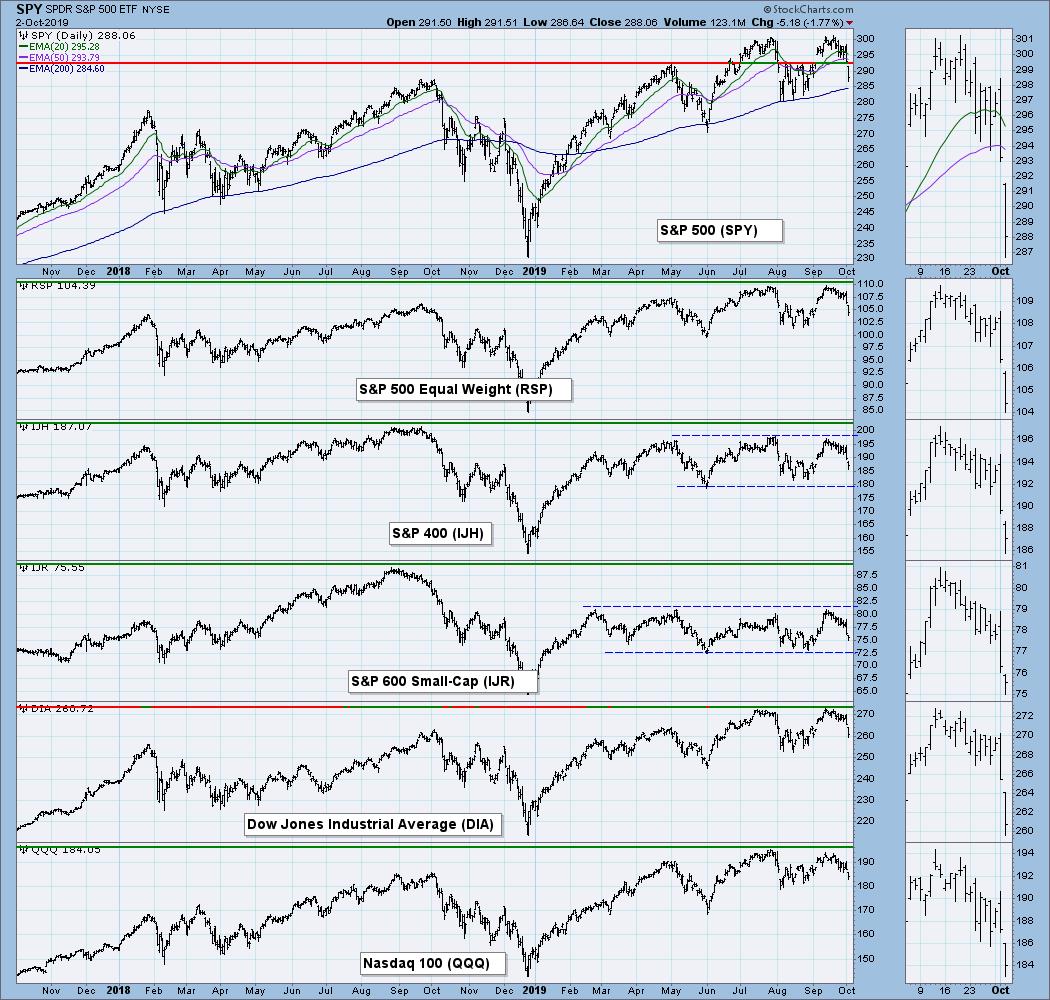
BROAD MARKET INDEXES
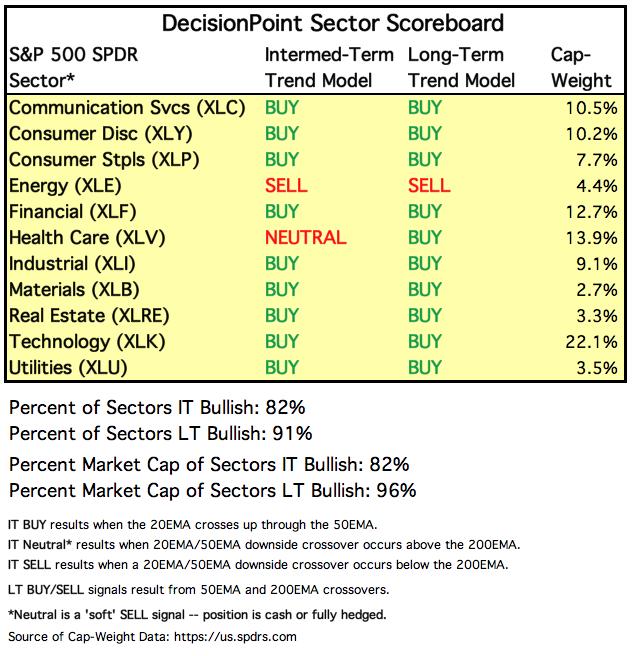
SECTORS
Each S&P 500 Index component stock is assigned to one, and only one, of eleven major sectors. This is a snapshot of the Intermediate-Term and Long-Term Trend Model signal status for those sectors.
STOCKS
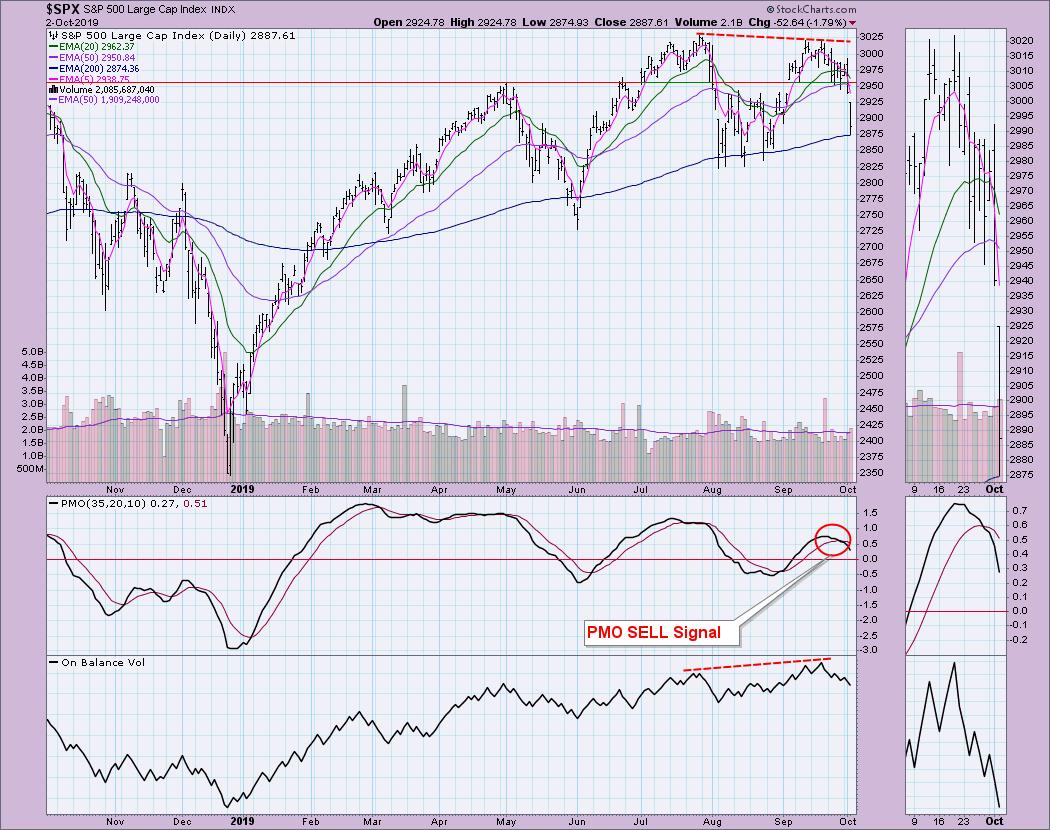
IT Trend Model: BUY as of 9/4/2019
LT Trend Model: BUY (SPY) as of 2/26/2019
SPX Daily Chart: Well, I guess the bright side of this chart is that the 200-EMA held up as support. The corrections we've seen previously have landed right around the 200-EMA and price bounced from there. However, we could be in for a bit of a roller coaster ride like we saw in August.
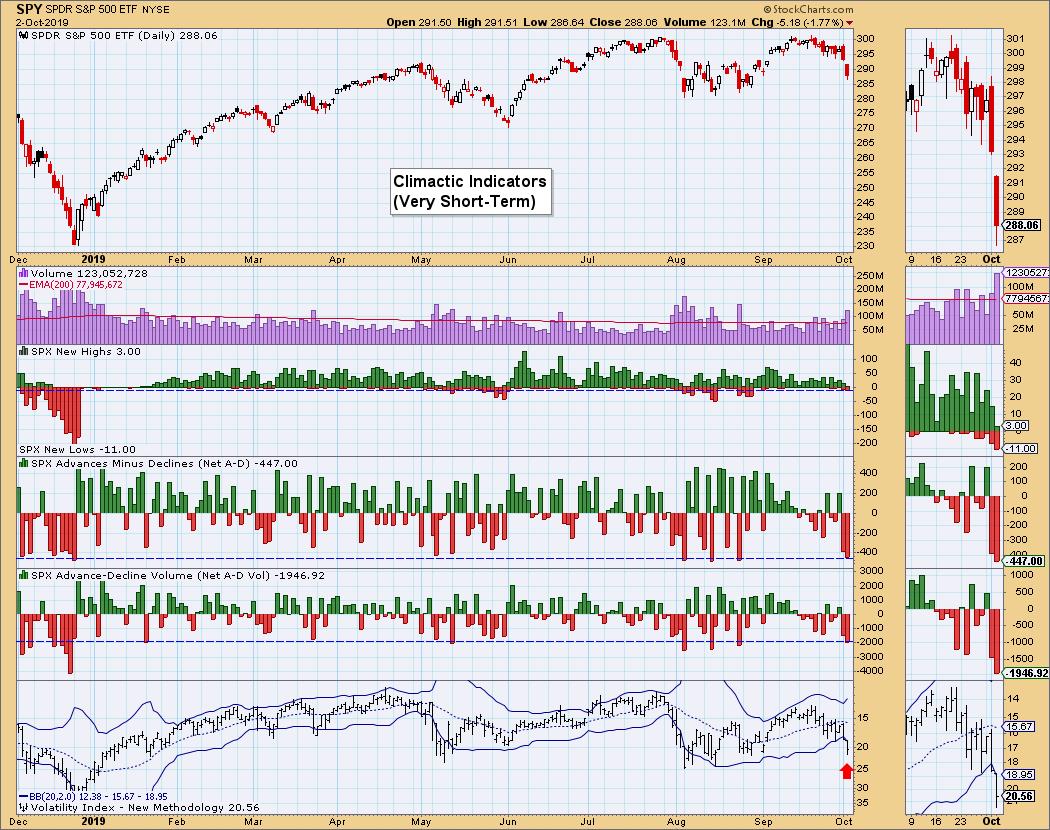
Climactic Market Indicators: Today we saw significant volume on this pullback. The VIX is well below the lower Bollinger Band. We had significantly high breadth readings. Back in August, those clearly marked bottoms when combined with the VIX's drop below the Bollinger Band. I am looking for a bounce into the end of the week based on these readings. HOWEVER - big however - back in December 2018, we saw these climactic readings rage on until New Lows really expanded. We've seen how these conditions can get "worse" before they get better. The Bollinger Band on the VIX can expand to accommodate lower readings. I'm not trying to be wishy-washy, I'm just pointing out that it could take until next week to see higher prices while indicators find equilibrium again.
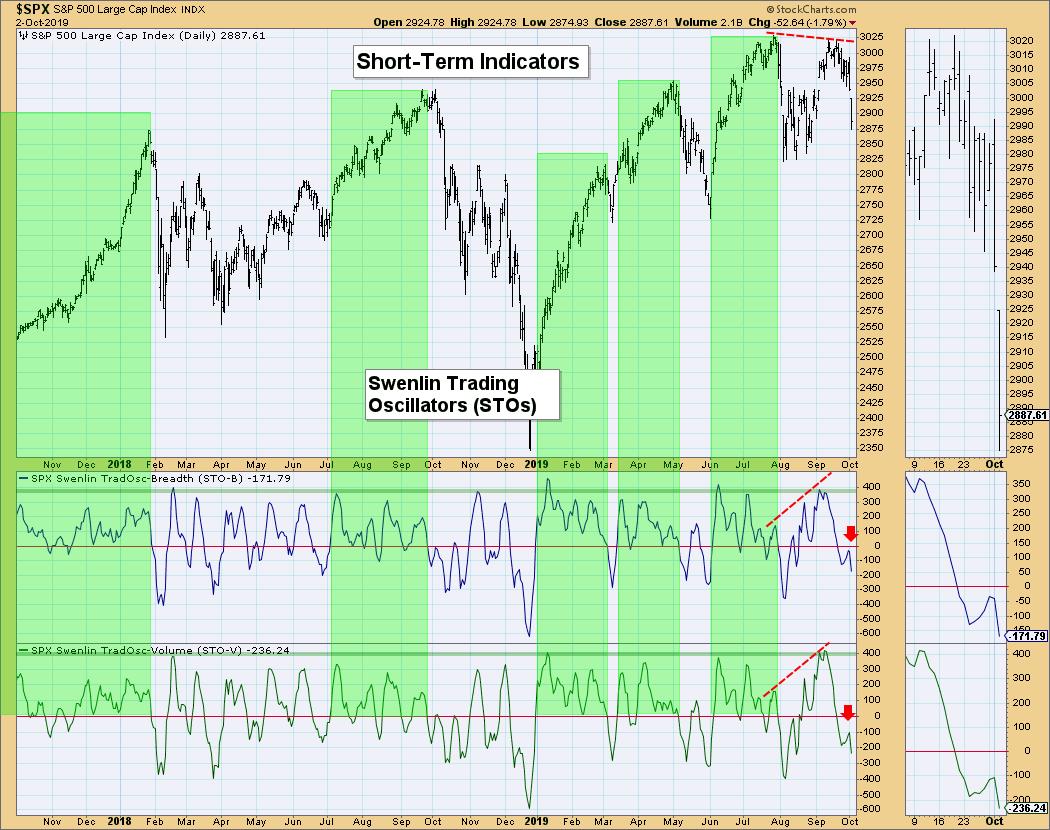
Short-Term Market Indicators: Tops below the signal line are bad news not only for the PMO, but also for our indicators. I find that they are getting oversold and could switch back up with the bounce I'm looking for in the very short term.
Intermediate-Term Market Indicators: These are in Neutral territory but falling fast. They are also still on the positive side of the zero line. I don't like them. These indicators are part of the reason I am looking for a mini-bounce followed by more downside. Let's face it, looking at price, it looks like an ominous double-top.
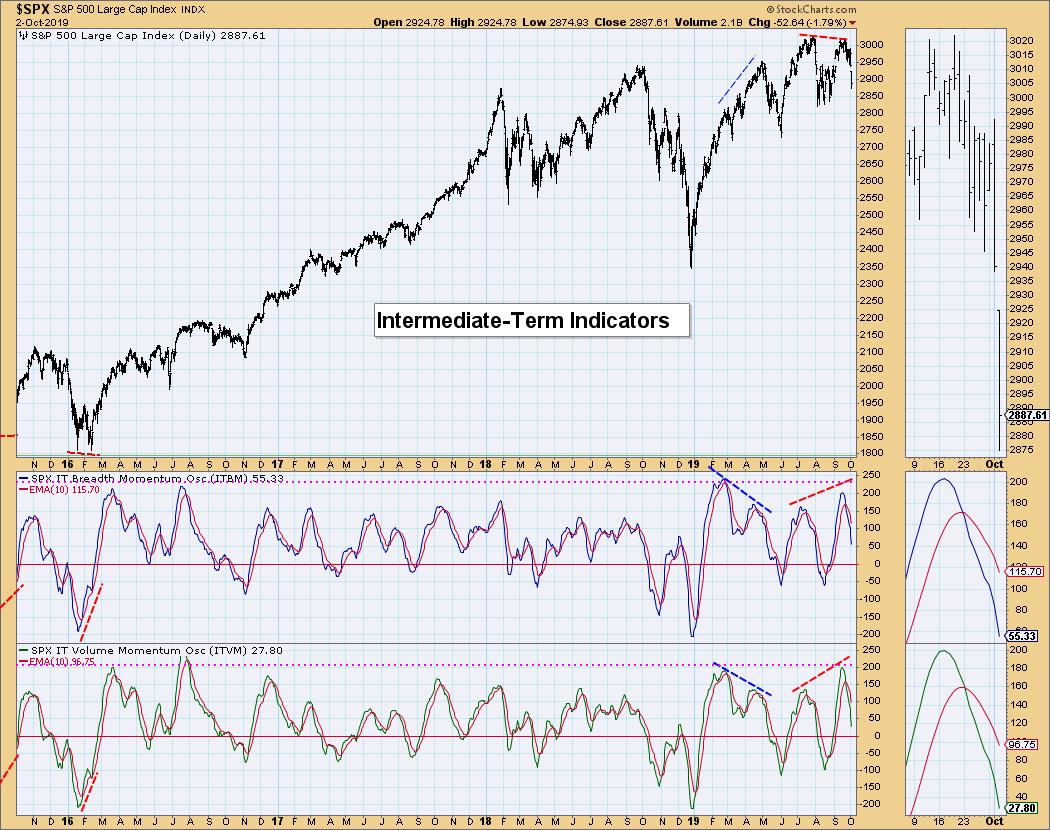
Conclusion: The good news today is the VIX is very oversold; breadth readings spiking could mean a selling exhaustion on this move. Unfortunately, IT indicators tell me any bounce will be short-lived and we should expect more downside after a pause or small bounce.
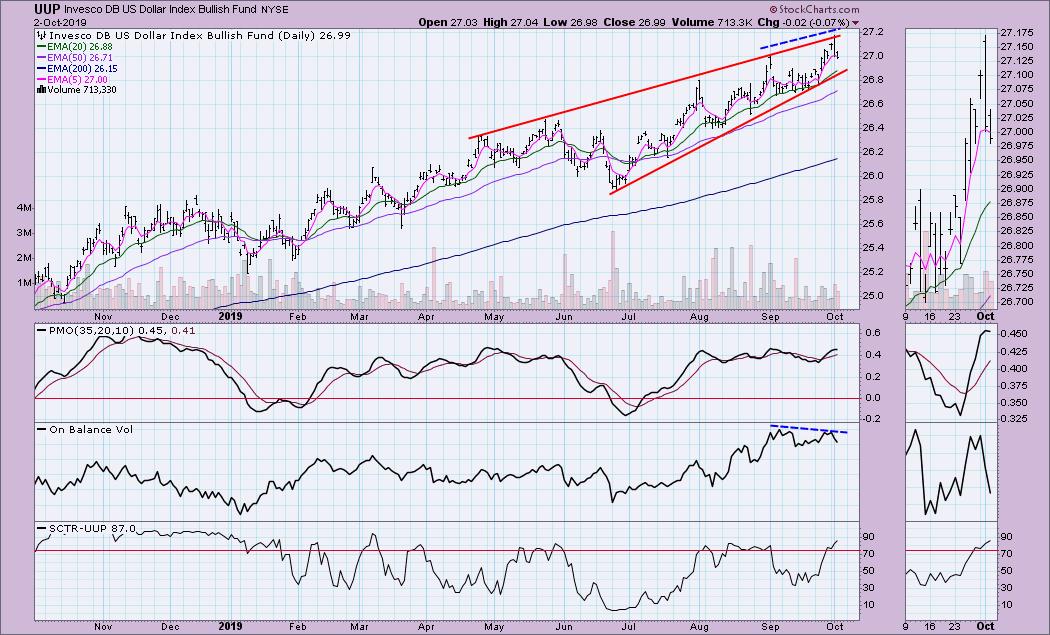
DOLLAR (UUP)
IT Trend Model: BUY as of 2/7/2019
LT Trend Model: BUY as of 5/25/2018
UUP Daily Chart: Last week, I wrote that "[t]his rising wedge is getting long in the tooth, but I believe it is still valid. The expectation is a breakdown below the rising bottoms trend line." I still believe it is a factor and that UUP will break down. The PMO is beginning to turn over and there is a negative divergence between OBV tops and price tops.
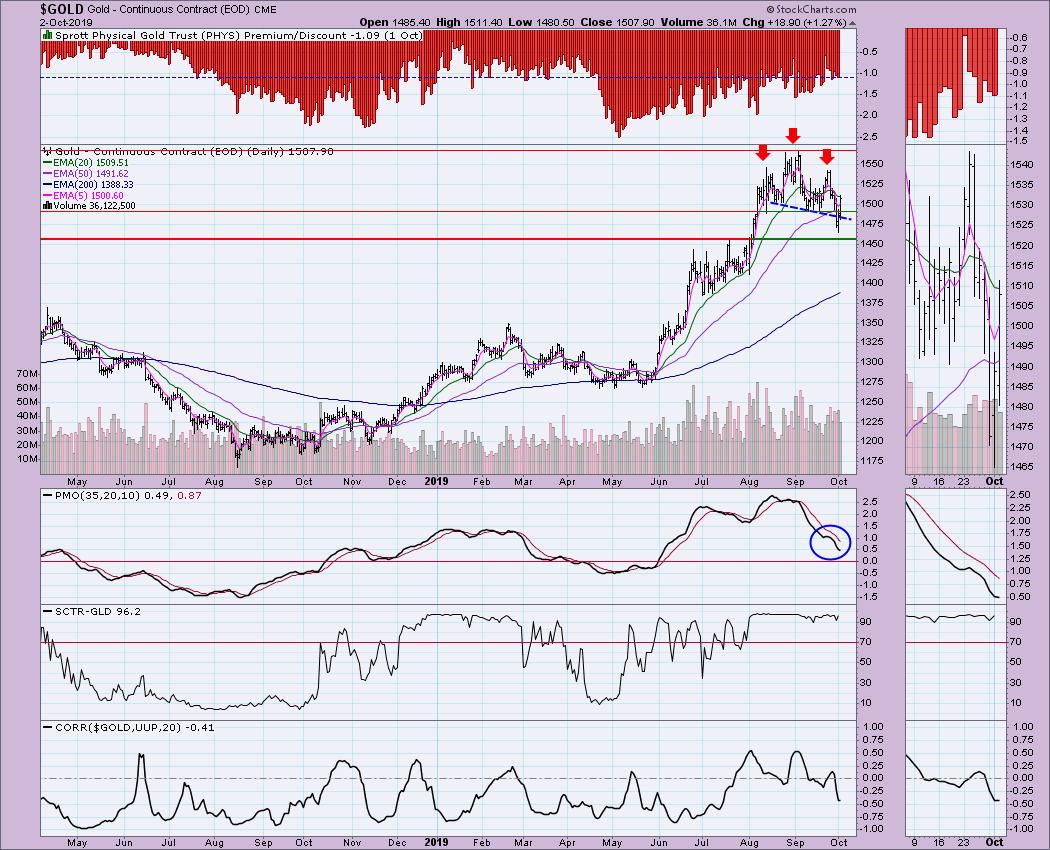
GOLD
IT Trend Model: BUY as of 6/3/2019
LT Trend Model: BUY as of 1/8/2019
GOLD Daily Chart: I've been watching the execution of a bearish head-and-shoulders pattern. I was pleased to see that it never really broke down after it dropped below the blue dashed neckline. Price found support at the July top and quickly rebounded. The PMO is decelerating and the SCTR is still positive. If the Dollar fails as I expect it to, that would give Gold the "oomph" needed to test this year's high.
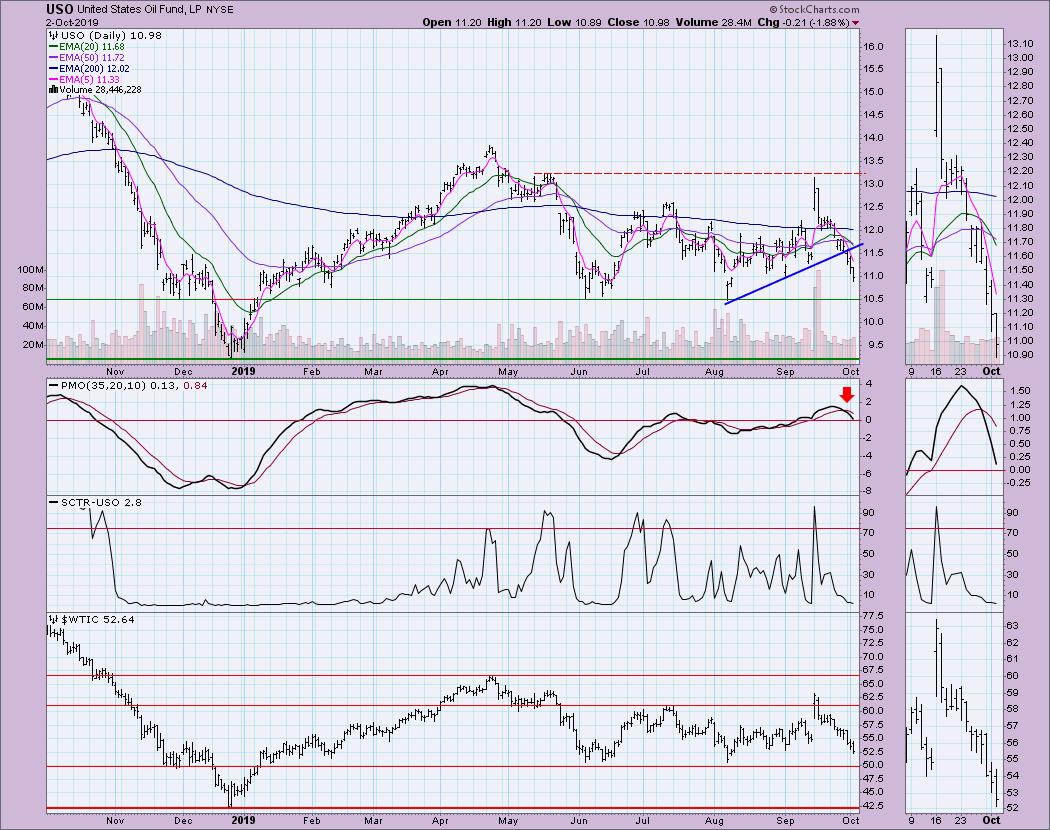
CRUDE OIL (USO)
IT Trend Model: SELL as of 10/2/2019
LT Trend Model: SELL as of 6/4/2019
USO Daily Chart: USO broke down on Monday and has continued lower. The PMO generated a SELL signal near the end of last week; we can now see that the Intermediate-Term Trend Model (ITTM) triggered a SELL signal today. I suspect it will find support at $10.50, but the trading range can really be extended to the December 2018 low. WTIC should find support at $50/barrel, but is also vulnerable to testing those December lows at $42.50/barrel.
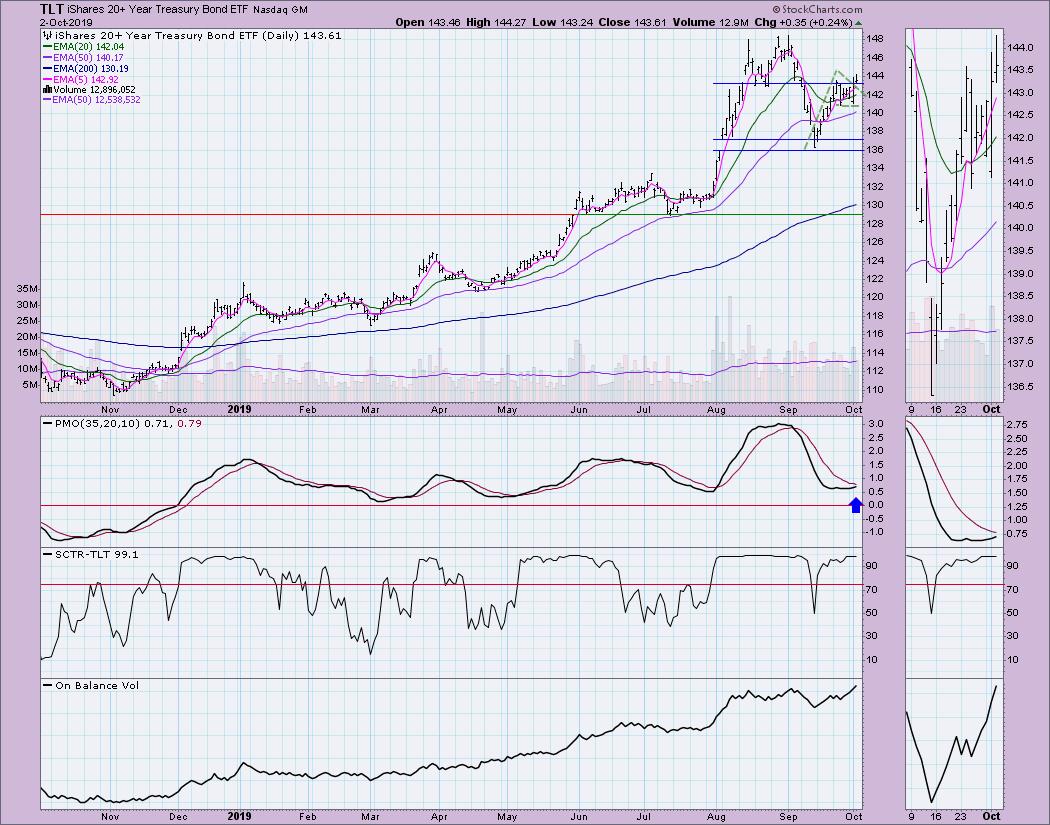
BONDS (TLT)
IT Trend Model: BUY as of 12/6/2018
LT Trend Model: BUY as of 1/2/2019
TLT Daily Chart: I am bullish on Bonds right now. Yesterday, price broke out from a bull flag. The PMO is turning up (albeit slow as a snail) and the SCTR is top-notch at 99.1. The setup seems great for a test of the recent all-time highs.
Technical Analysis is a windsock, not a crystal ball.
Happy Charting! - Erin
Email: erinh@stockcharts.com
**Don't miss any of the DecisionPoint commentaries! Go to the "Notify Me" box toward the end of this blog page to be notified as soon as they are published.**
NOTE: The signal status reported herein is based upon mechanical trading model signals, specifically the DecisionPoint Trend Model. They define the implied bias of the price index based upon moving average relationships, but they do not necessarily call for a specific action. They are information flags that should prompt chart review. Further, they do not call for continuous buying or selling during the life of the signal. For example, a BUY signal will probably (but not necessarily) return the best results if action is taken soon after the signal is generated. Additional opportunities for buying may be found as price zigzags higher, but the trader must look for optimum entry points. Conversely, exit points to preserve gains (or minimize losses) may be evident before the model mechanically closes the signal.
Helpful DecisionPoint Links:
DecisionPoint Shared ChartList and DecisionPoint Chart Gallery
Price Momentum Oscillator (PMO)
Swenlin Trading Oscillators (STO-B and STO-V)


