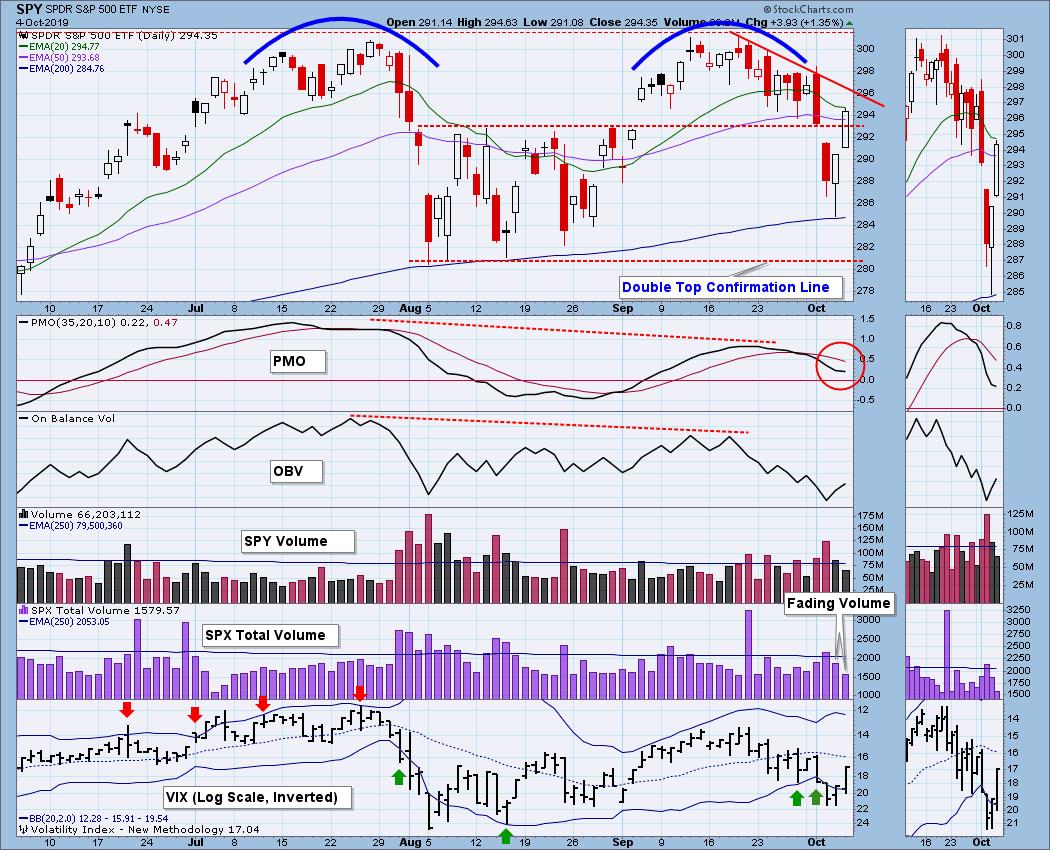
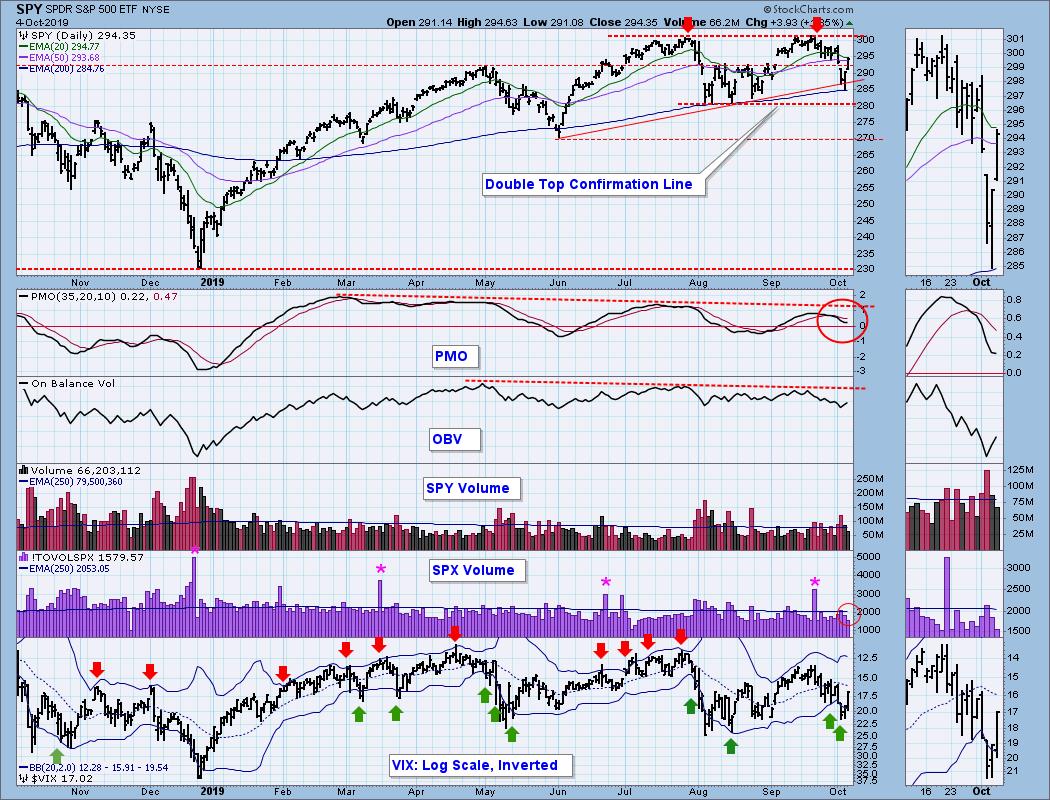
The market was treating my double top assessment pretty well, but on Friday price got back above the recently broken support; however, on the two-day rally SPX volume fell below the one-year average, failing to validate the advance. The daily PMO tried to turn up, but couldn't quite make it. It is looking better for the bulls, but the double top scenario still looks reasonable. There is a declining trend line drawn from the mid-September top. If that is taken out, I will pretty much give up on the double top idea.
The DecisionPoint Weekly Wrap presents an end-of-week assessment of the trend and condition of the stock market (S&P 500), the U.S. Dollar, Gold, Crude Oil, and Bonds.
Watch the latest episode of DecisionPoint on StockCharts TV's YouTube channel here!
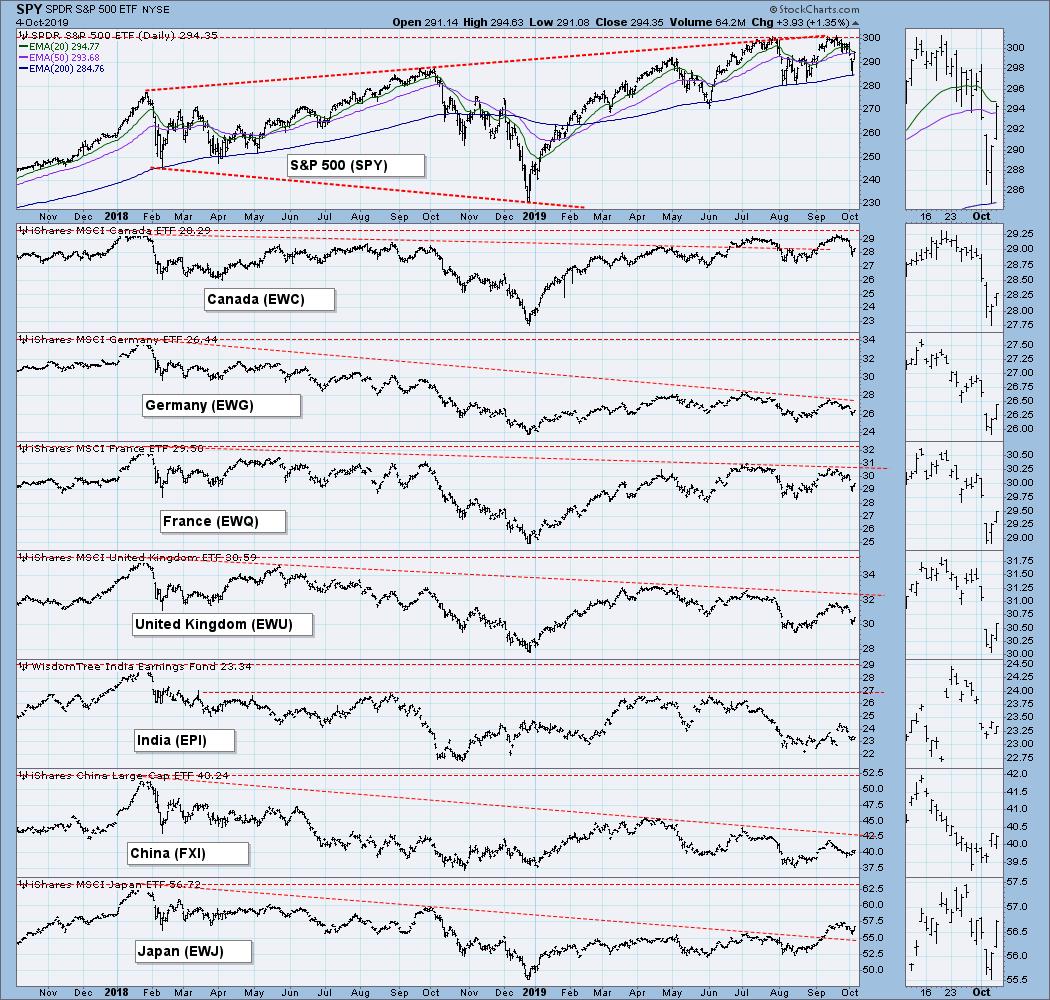
GLOBAL MARKETS
The U.S. market is still the leader.
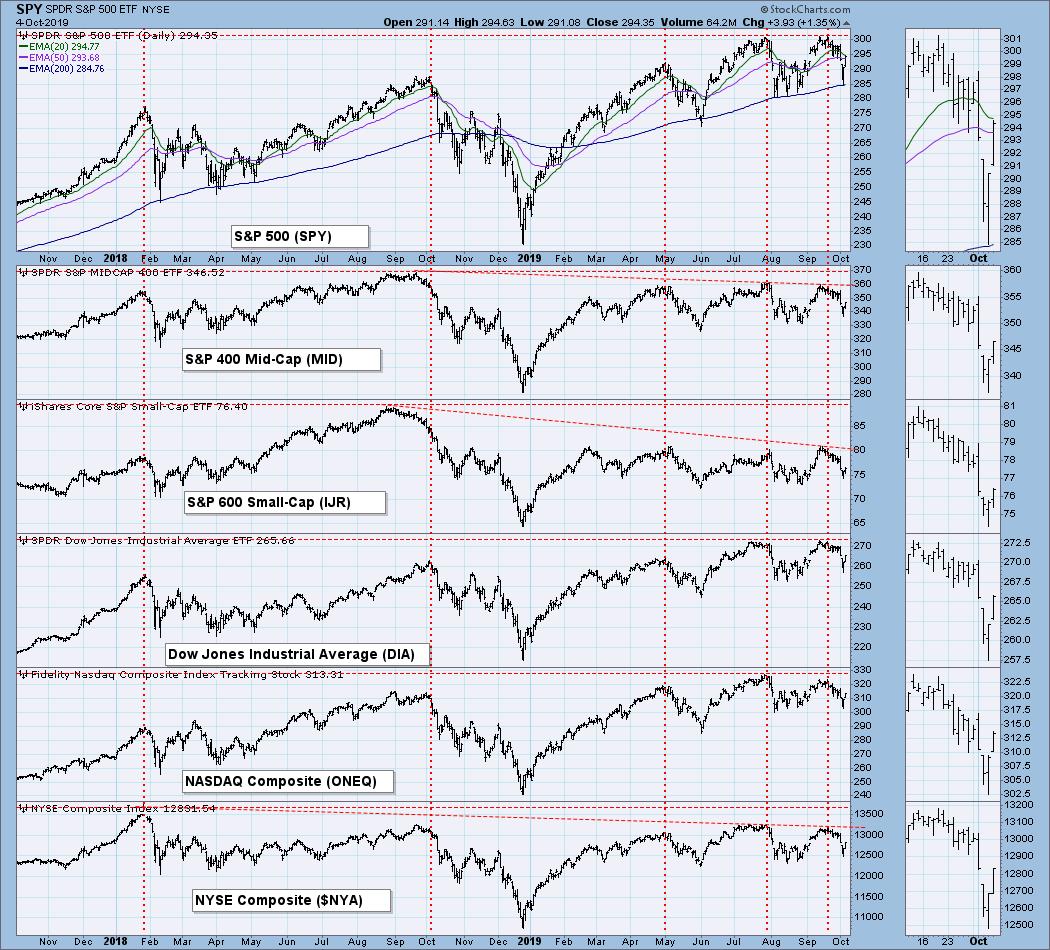
BROAD MARKET INDEXES
The large-cap Dow and S&P 500 approached all-time highs in September, but broader-based indexes are not doing as well.
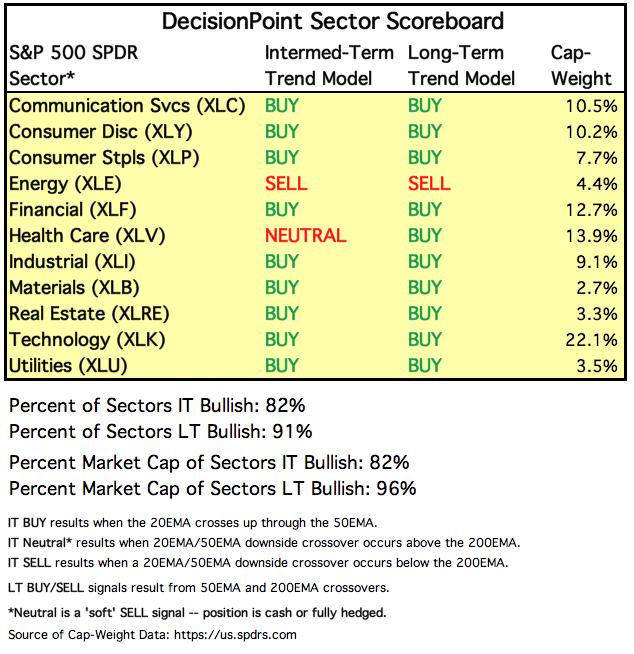
SECTORS
Each S&P 500 Index component stock is assigned to one, and only one, of 11 major sectors. This is a snapshot of the Intermediate-Term and Long-Term Trend Model signal status for those sectors.
INTEREST RATES
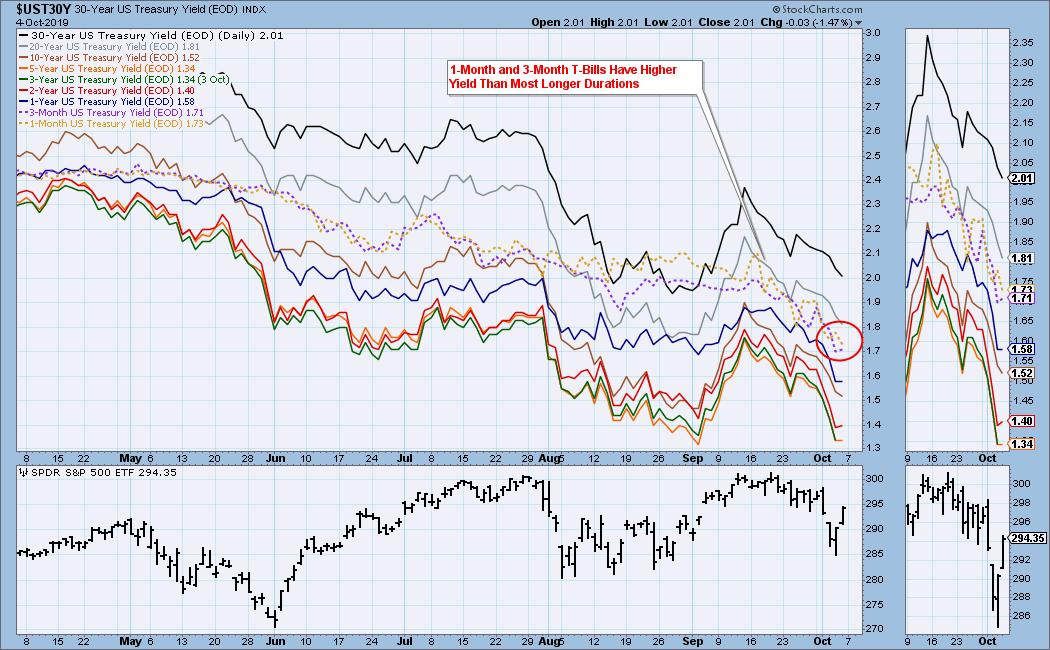
Because some interest rates are currently inverted, I will be including a chart so we can monitor the situation. In normal circumstances the longer money is borrowed the higher the interest rate that must be paid. When rates are inverted, the reverse is true. It is generally believed that rate inversions result from "a flight to safety." On the chart below, notice that the one-month and three month T-Bills (dotted lines) pay a higher interest rate than the one year through the 10-year T-Bonds.
STOCKS
IT Trend Model: NEUTRAL as of 9/6/2019
LT Trend Model: BUY as of 2/26/2019
SPY Daily Chart: In addition to the issues I discussed in the opening paragraph, the OBV and PMO have long-standing negative divergences.
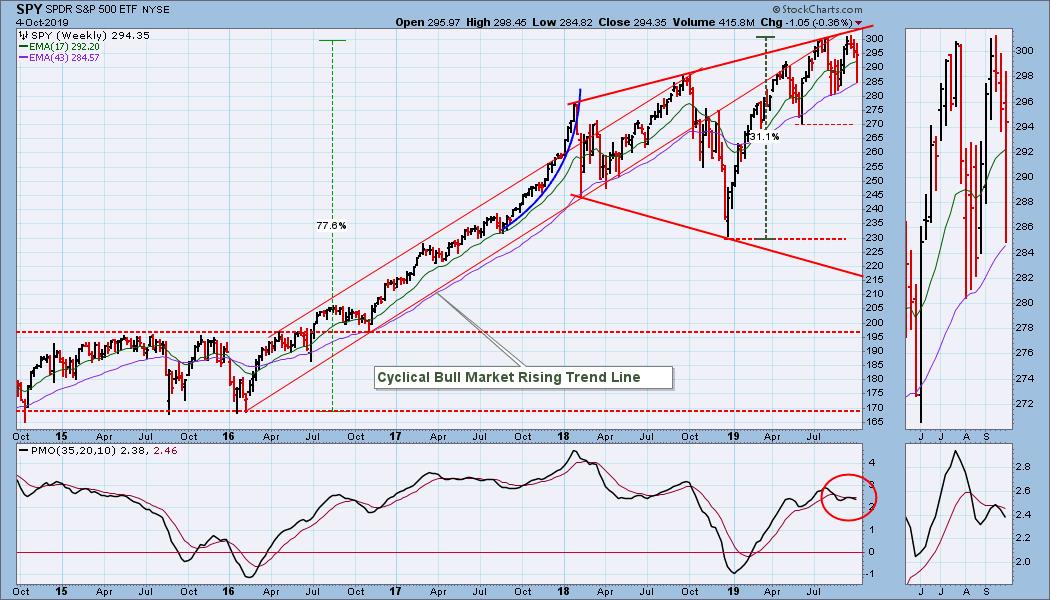
SPY Weekly Chart: In spite of the market's rebound, the market was down for the week.
Climactic Market Indicators: There was an exhaustion climax on Wednesday, but only net breadth was climactic on Friday.
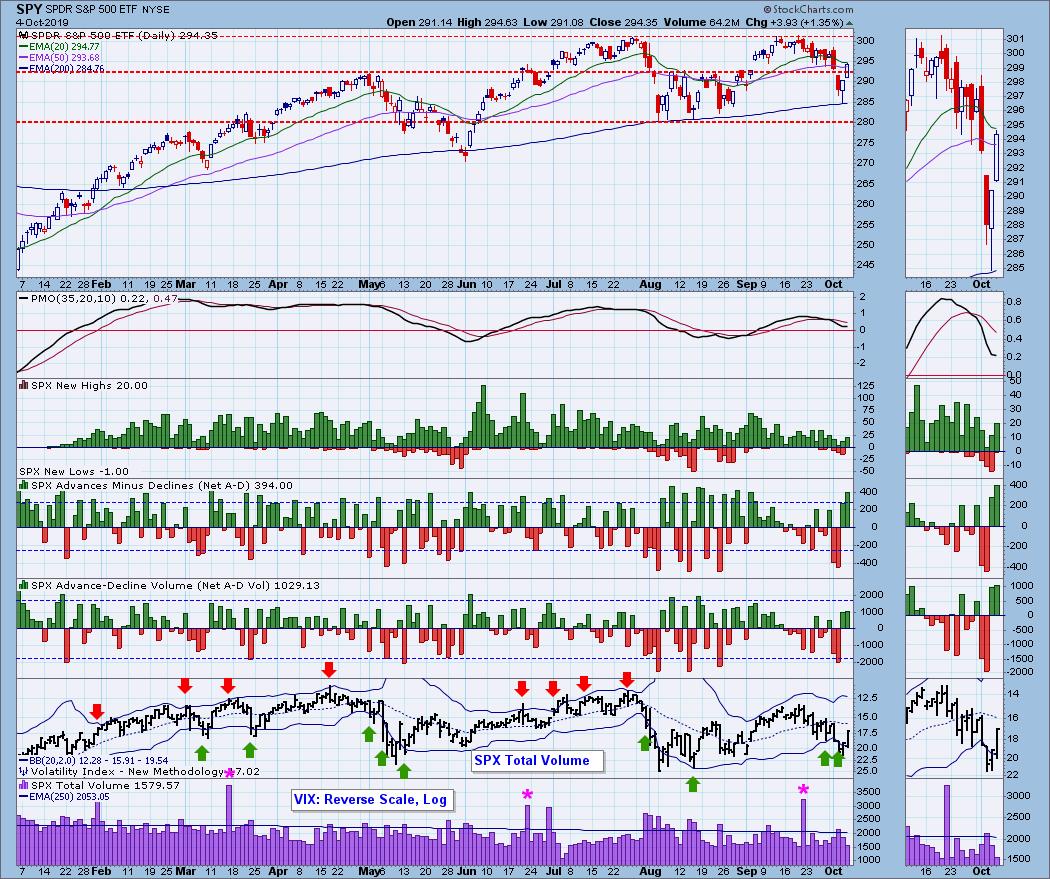
Short-Term Market Indicators: I have added two more of our indicators to this chart: Percent of SPX Stocks Above 20EMA, and Percent SPX Stocks PMO Rising. They are more direct internal measures and they have finite ranges. They will help us to more quickly identify overbought and oversold conditions, such as the market reached this week.
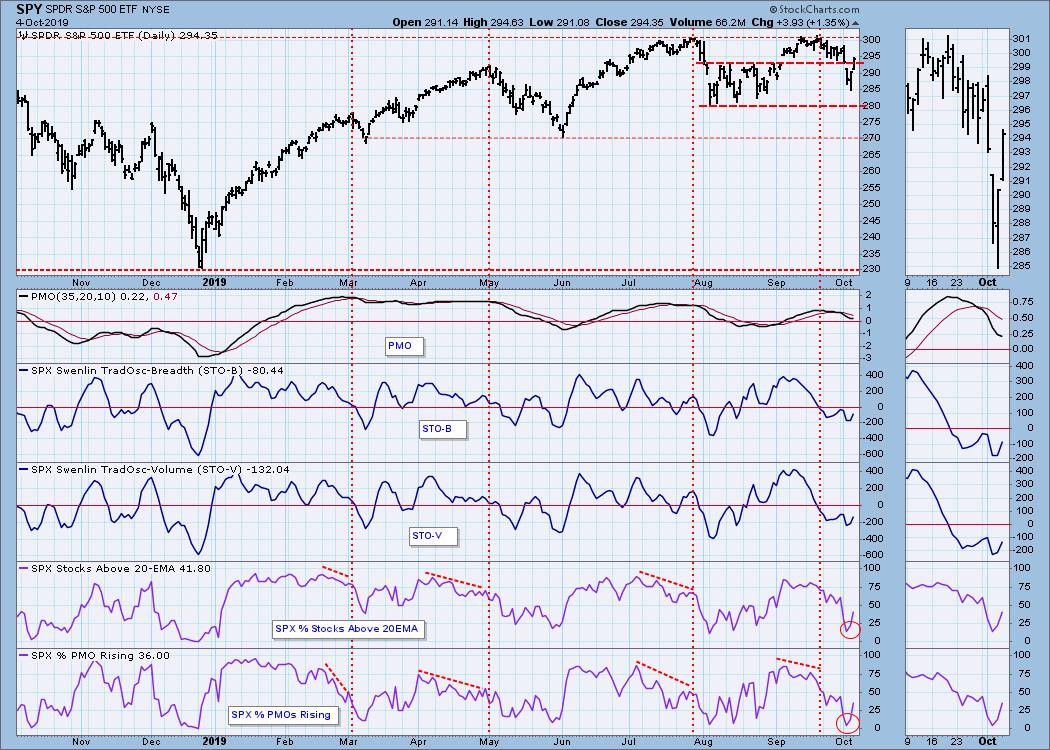
Intermediate-Term Market Indicators: If the bull market still lives, the ITBM and ITVM have reached relatively oversold levels based upon to the range they have maintained for most of the three years shown. The PMO and Silver Cross Index (percentage of SPX stocks with 20EMAs above 50EMAs) have months-long negative divergences.
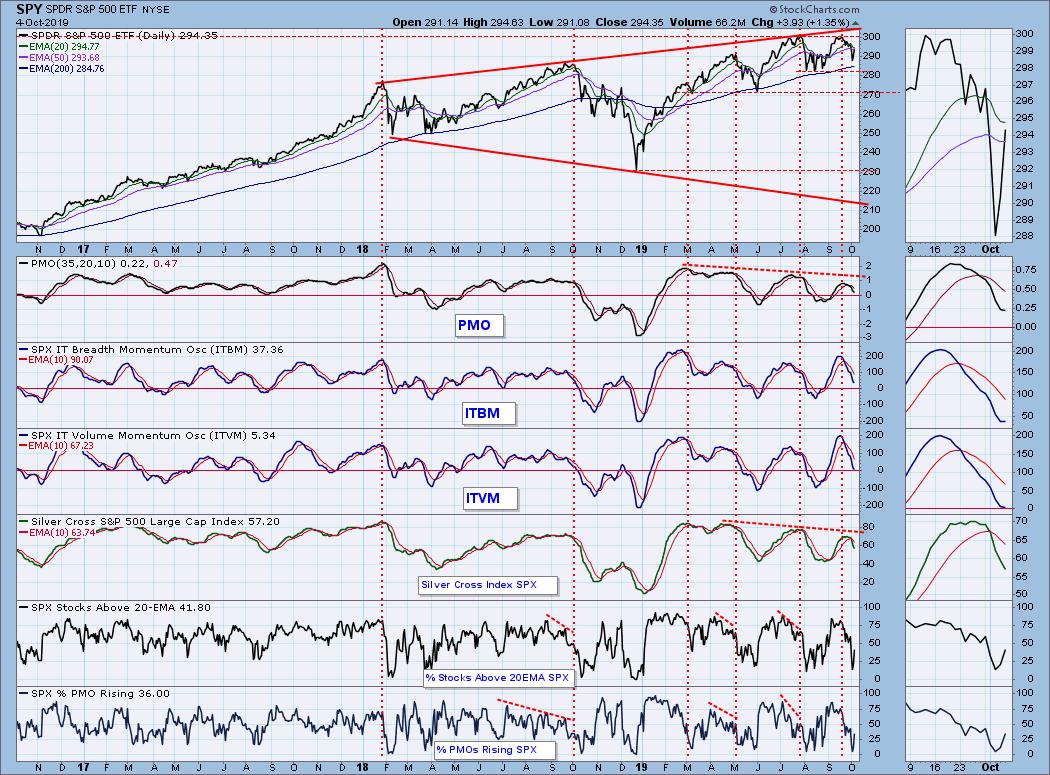
CONCLUSION: Short-term indicators got very oversold by Wednesday, so the bounce was not inappropriate. Intermediate-term indicators are oversold for a bull market, so the rally could continue next week, but there is plenty of room for more downside. The dominant feature continues to be the double top, which could be resolved, one way or the other, next week. After my review of the charts at the end of the week, I usually have an opinion as to the next move, but at this point I have to say I'm neutral.
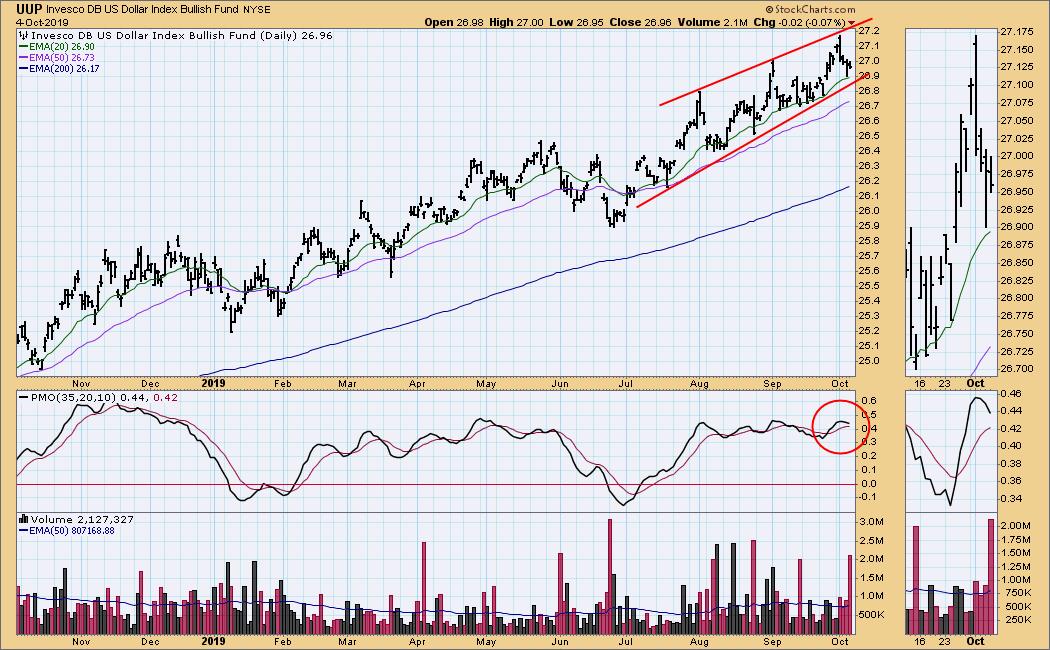
DOLLAR (UUP)
IT Trend Model: BUY as of 7/5/2019
LT Trend Model: BUY as of 5/25/2018
UUP Daily Chart: Price is advancing within a rising wedge formation, although I am inclined to think of the wedge as more of a rising trend channel. The daily PMO has topped, but it is positive and remains within a two-month range.
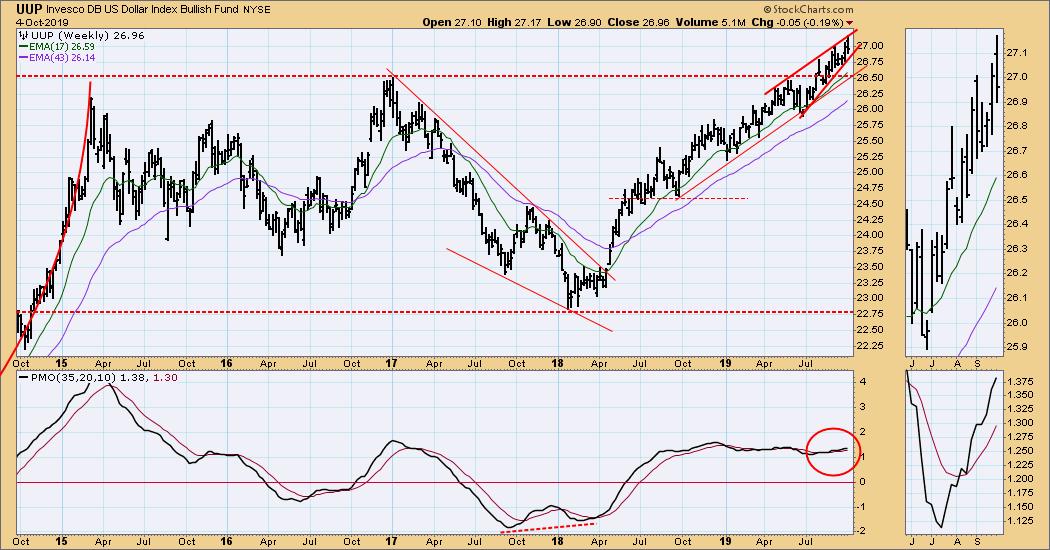
UUP Weekly Chart: Note that price has moved into a steeper rising trend, and a more acute rising wedge. The weekly PMO has been positive and flat for over a year. This is a good thing because it indicates an unwavering advance.
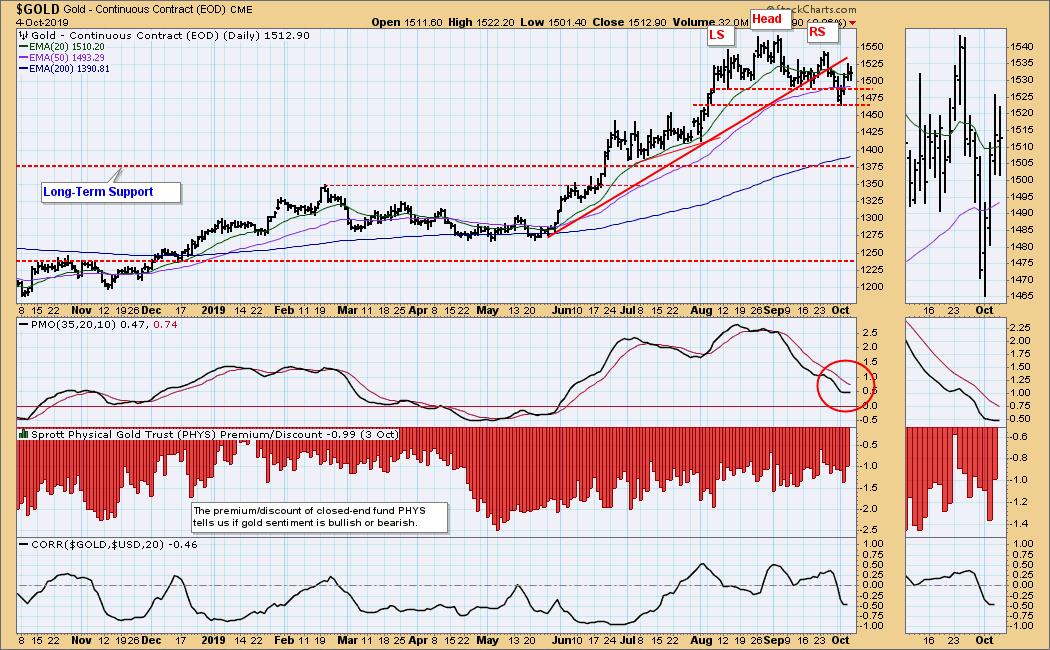
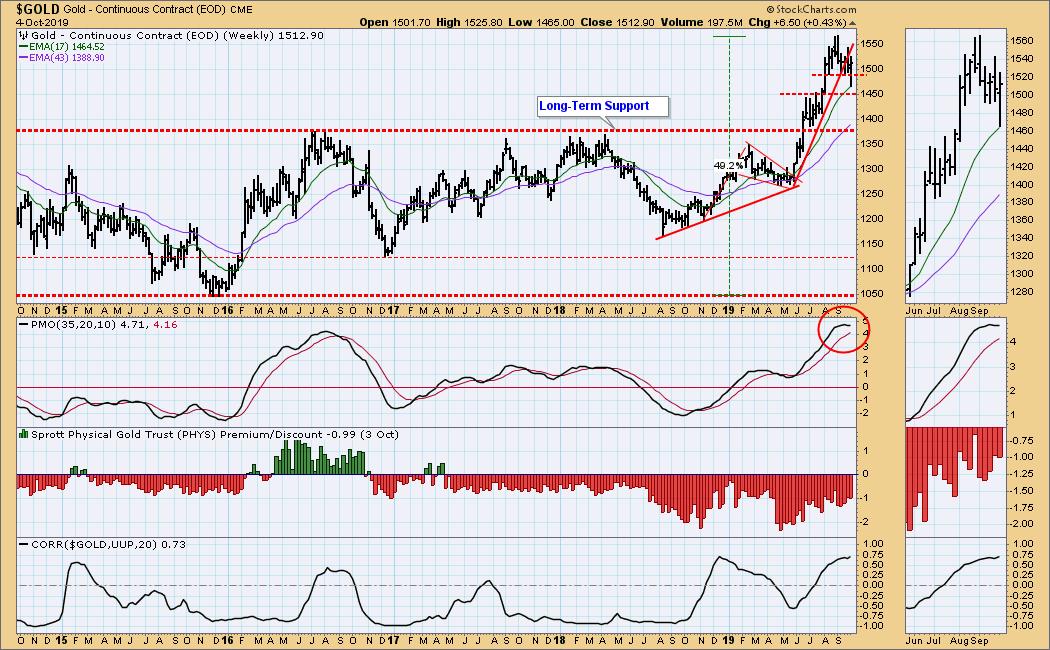
GOLD
IT Trend Model: BUY as of 6/3/2019
LT Trend Model: BUY as of 1/8/2019
GOLD Daily Chart: On Monday the head and shoulders pattern "executed" (signaled a bearish resolution) by dropping below the neck line. This week we saw a price reversal, and the pattern was aborted.
GOLD Weekly Chart: The weekly PMO is overbought and topping, so I hesitate to think that there is not more downside (or at least sideways movement) to come.
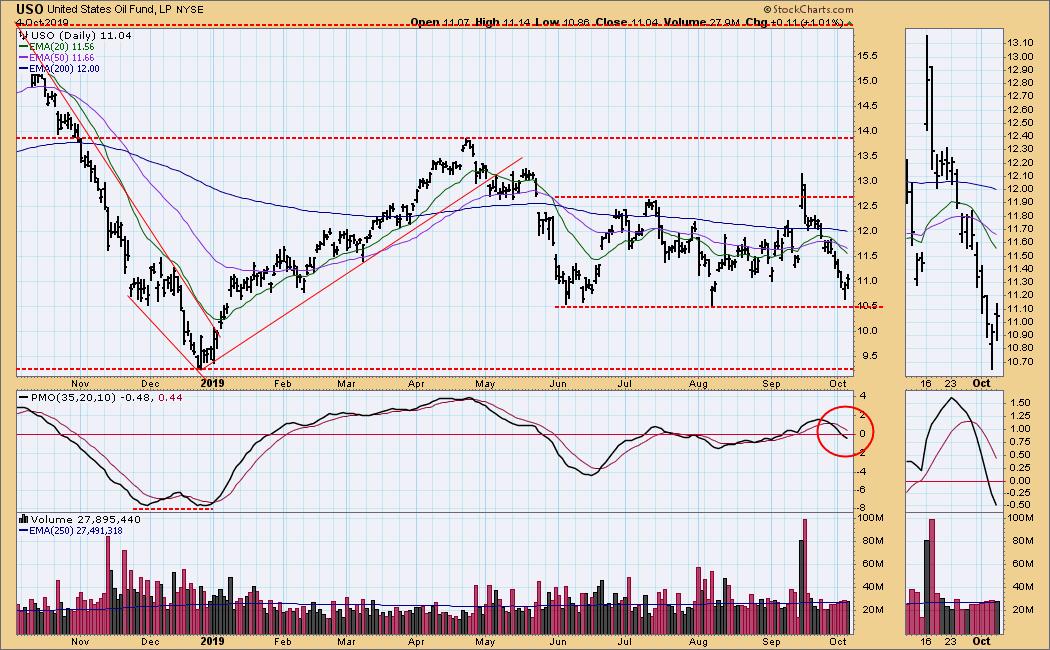
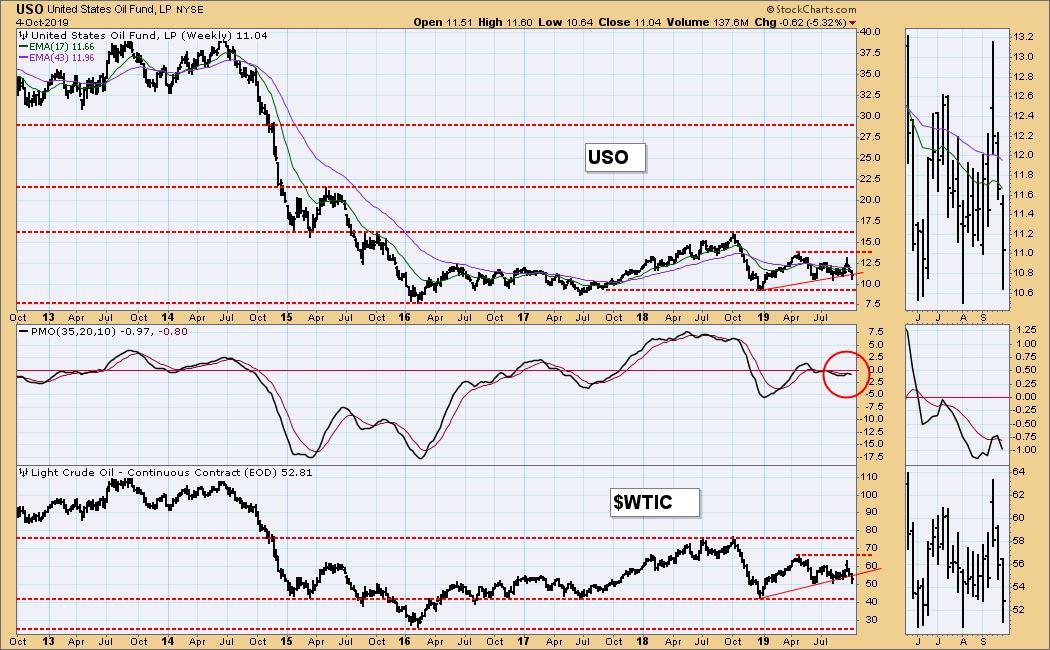
CRUDE OIL (USO)
IT Trend Model: SELL as of 10/2/2019
LT Trend Model: SELL as of 6/4/2019
USO Daily Chart: Price support was found just above the support at 10.50. The trading range still holds.
USO Weekly Chart: Absent major news, I think that crude will continue down to test support at $WTIC) 42.
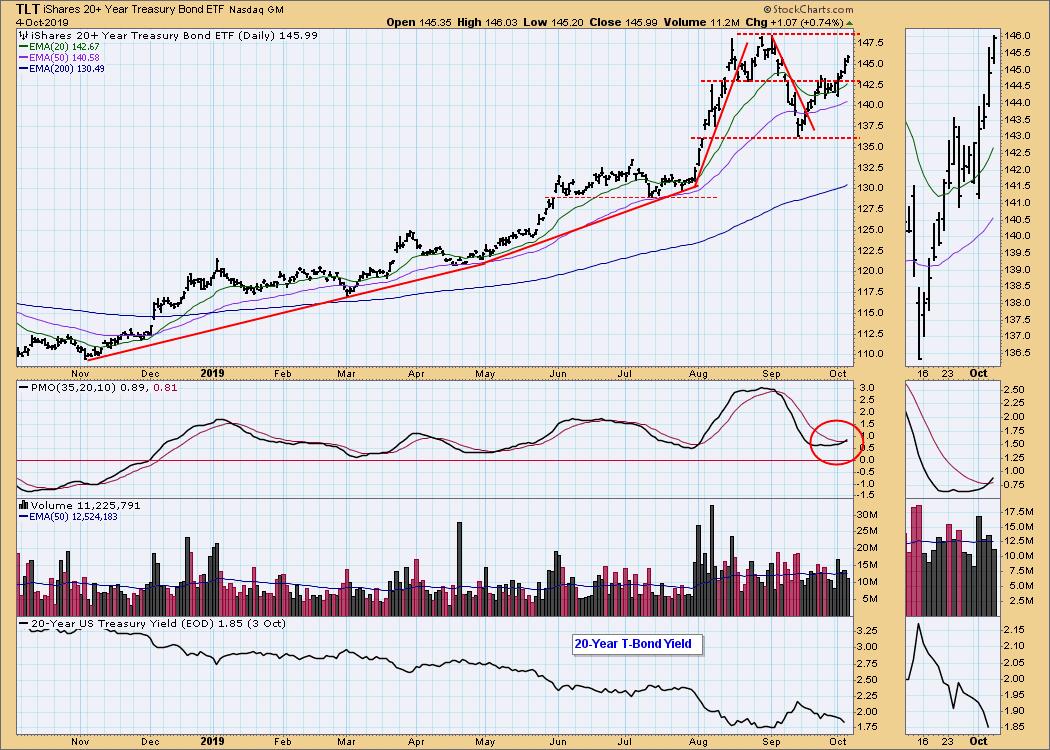
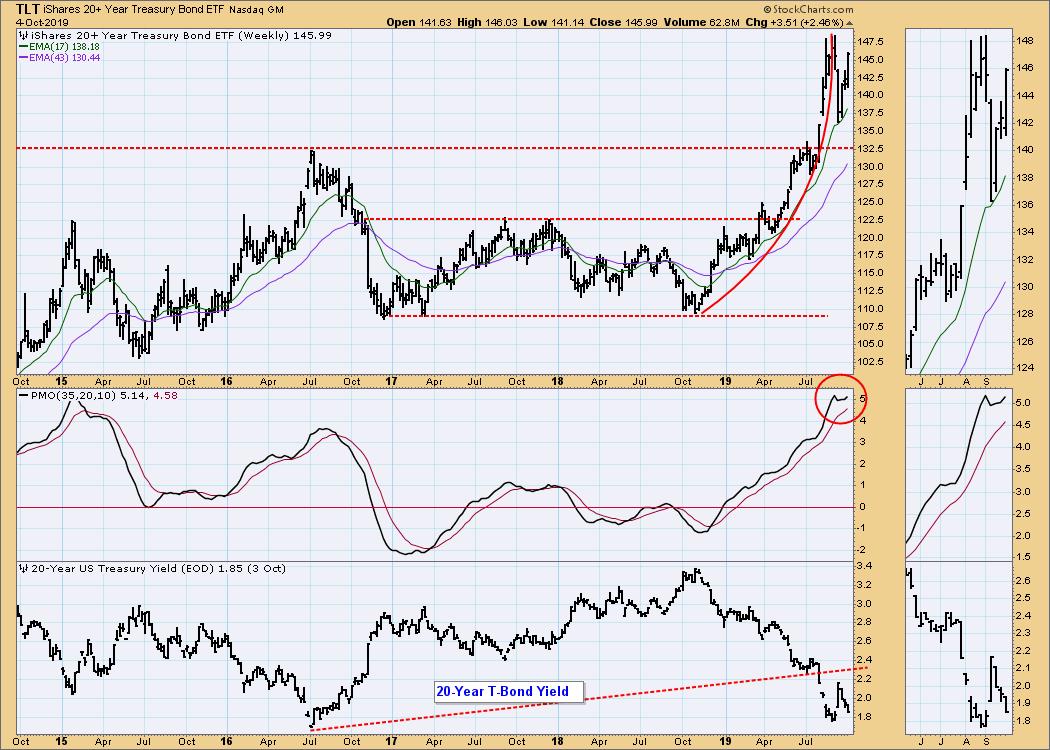
BONDS (TLT)
IT Trend Model: BUY as of 12/6/2018
LT Trend Model: BUY as of 1/2/2019
TLT Daily Chart: I have been saying that TLT will probably chop in the range of 136 to 143 until the next interest rate decision, but I was wrong to conclude that interest rates are the primary factor. The perception of bonds as a safe haven also plays a big part in price movement. As the stock market lost ground this week, bonds perked up.
TLT Weekly Chart: The parabolic advance has broken down, and a corrective action has taken place. The weekly PMO is overbought, but I'm not feelin' a lot of downside here.
**Don't miss any of the DecisionPoint commentaries! Go to the "Notify Me" box toward the end of this blog page to be notified as soon as they are published.**
Technical Analysis is a windsock, not a crystal ball.
Happy Charting! - Carl
NOTE: The signal status reported herein is based upon mechanical trading model signals, specifically, the DecisionPoint Trend Model. They define the implied bias of the price index based upon moving average relationships, but they do not necessarily call for a specific action. They are information flags that should prompt chart review. Further, they do not call for continuous buying or selling during the life of the signal. For example, a BUY signal will probably (but not necessarily) return the best results if action is taken soon after the signal is generated. Additional opportunities for buying may be found as price zigzags higher, but the trader must look for optimum entry points. Conversely, exit points to preserve gains (or minimize losses) may be evident before the model mechanically closes the signal.
Helpful DecisionPoint Links:
DecisionPoint Shared ChartList and DecisionPoint Chart Gallery
Price Momentum Oscillator (PMO)
Swenlin Trading Oscillators (STO-B and STO-V)
