
Today's results come from Carl's Scan and the Momentum Sleepers Scan. Usually, when I review these scan results, they don't come with good weekly charts. Today's weekly charts look pretty good so far, but I'll point out any weaknesses I see. Big companies like Microsoft and Amazon will occasionally make an appearance in my scan results, so I will generally include them if they have good charts. Of course, if they come from one of my scans, they tend to have good price charts!
I love to get your feedback on DP commentary, so shoot me an email at erinh@stockcharts.com. I read every one of them and try to answer them all! Your insight helps me to tailor my commentary to what my readers and viewers want to hear about.
Welcome to DecisionPoint Daily Diamonds, wherein I highlight five "diamonds in the rough." These are selected from the results of my DecisionPoint scans, which search for stocks that could benefit from the trend and condition of the market. Remember, these are not recommendations to buy or sell, but are the most interesting of the stocks that surfaced in my scans. My objective is to save you the work of the initial, tedious culling process, but you need to apply your own analysis to see if these stocks pique your interest as well. There are no guaranteed winners here!
Current Market Outlook:
Market Trend: Currently, we have Trend Model BUY signals in all three timeframes on the DP Scoreboard Indexes.
Market Condition: The market is overbought, with Price Momentum Oscillator (PMO) BUY signals on the DP Scoreboards. Remember, overbought conditions can persist in a bull market.
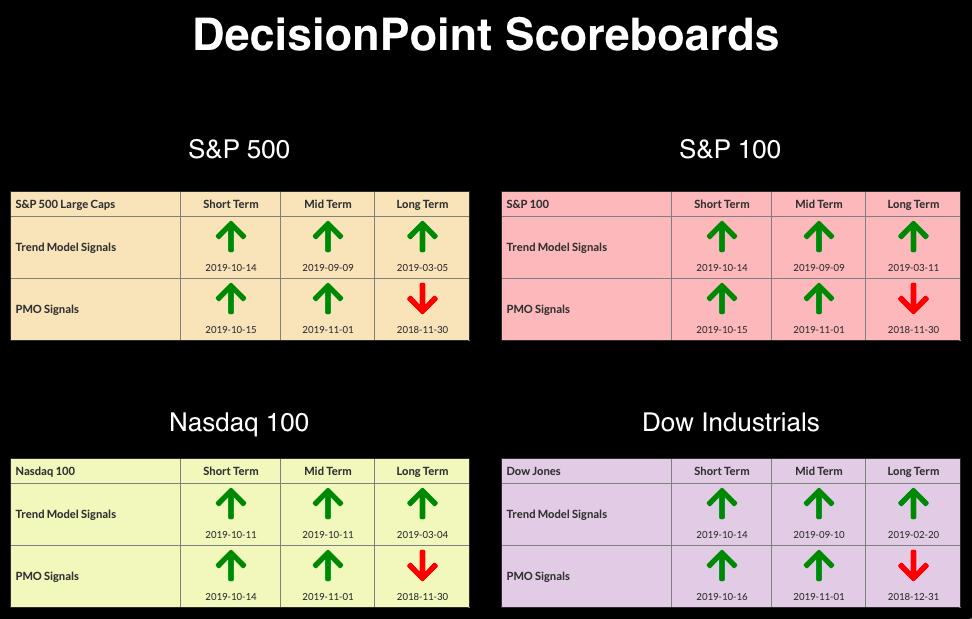
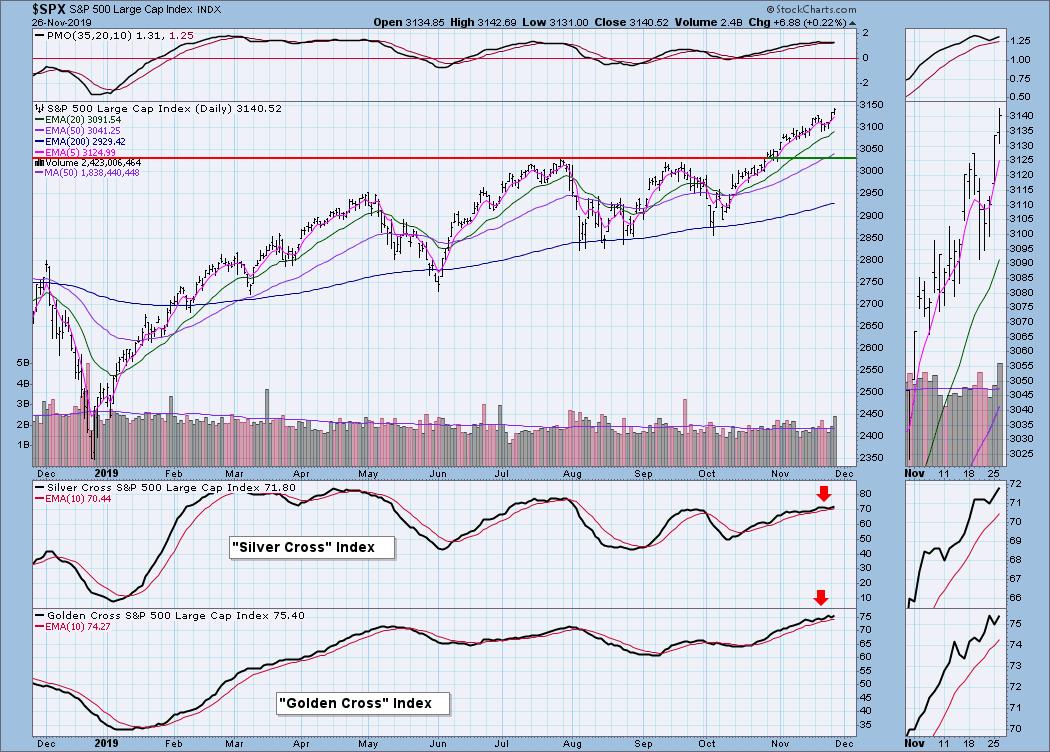
Market Environment: It is important to consider the odds for success. The Silver Cross Index measures the percentage of stocks on IT Trend Model BUY signals (20-EMA > 50-EMA), while the Golden Cross Index measures the percentage of stocks on LT Trend Model BUY signals (50-EMA > 200-EMA). Here are the current percentages on the Silver and Golden Cross Indexes:
Diamond Index:
- Diamond Scan Results: 2
- Diamond Dog Scan Results: 5
- Diamond Bull/Bear Ratio: .40
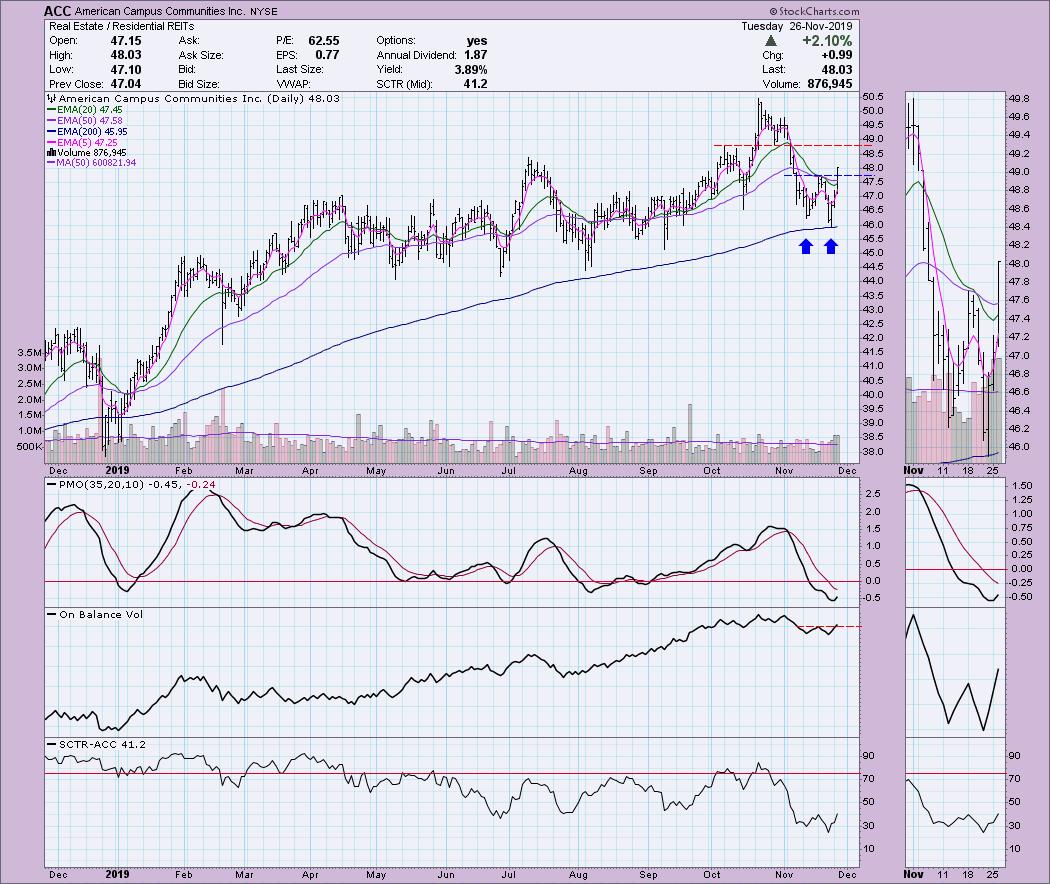
American Campus Communities Inc (ACC) - Earnings: 2/17 - 2/21/2020
The short-term double-bottom formation is what caught my eye on the "CandleGlance" of my scan results. Today the stock rallied more than 2%, so this may need a small pullback before it resumes the rally. The PMO has turned up in oversold territory and is preparing for a crossover BUY signal. Volume is coming in and has pushed the OBV above its previous top. This confirms the short-term breakout. The minimum upside target of the pattern would bring price just below the October top, which would be my investment target as well. There could be some overhead pressure at $48.75, coinciding with the early October high and the late October low.
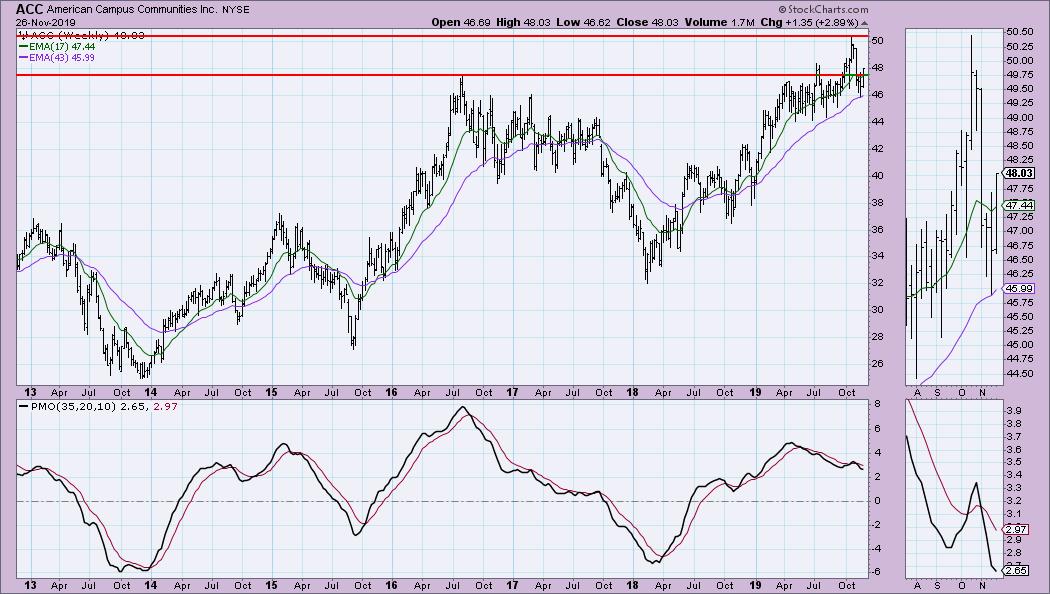
The weekly PMO is still moving lower but it is decelerating. This breakout is important given that it has brought price above the 2016 high. In the thumbnail, I note that price is currently at its high for the week and is above the 17-week EMA. I'd like to see it end Friday above that EMA.
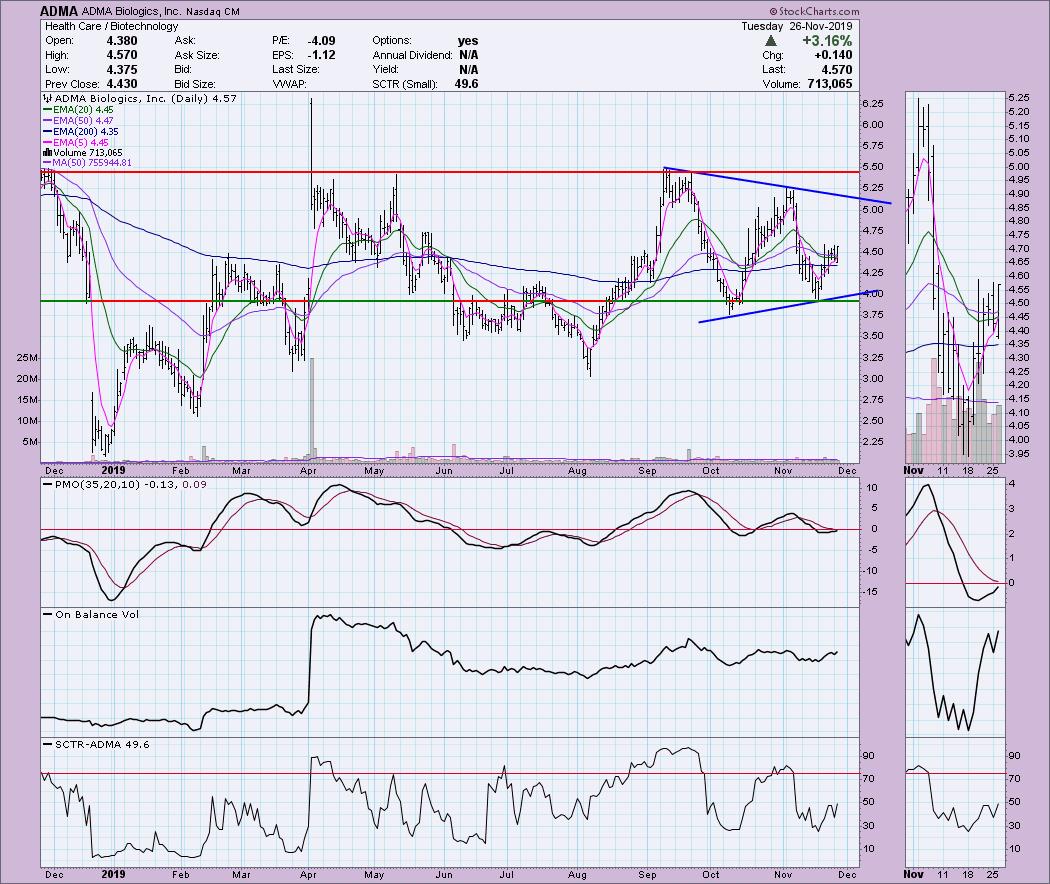
ADMA Biologics Inc (ADMA) - Earnings: 11/6/2019
This stock came from Carl's Scan. His scan allows for stock prices below $10 and this one is certainly well below. With this in mind, consider position sizing appropriately. The PMO is about to trigger a crossover BUY signal. That would put the PMO above zero, which is also positive. Though ADMA has been in a symmetrical triangle formation, these can unfortunately break in either direction. The PMO, SCTR and OBV are confirming the rally right now.
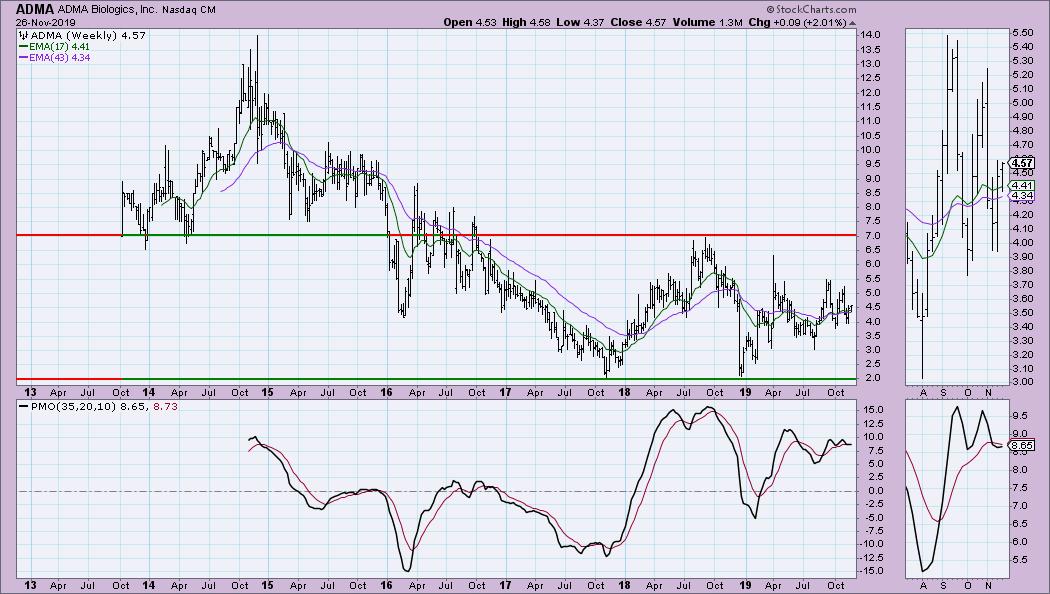
The weekly PMO is actually turning up after a recent crossover SELL signal. Price is staying above the 17-week EMA; I'd like to see it remain above the 43-week EMA. Note the wide trading range that began in 2017; this is the risk to me. It is in the middle of the trading range, so it could make a move in either direction right now. I'd babysit this one if I got in.
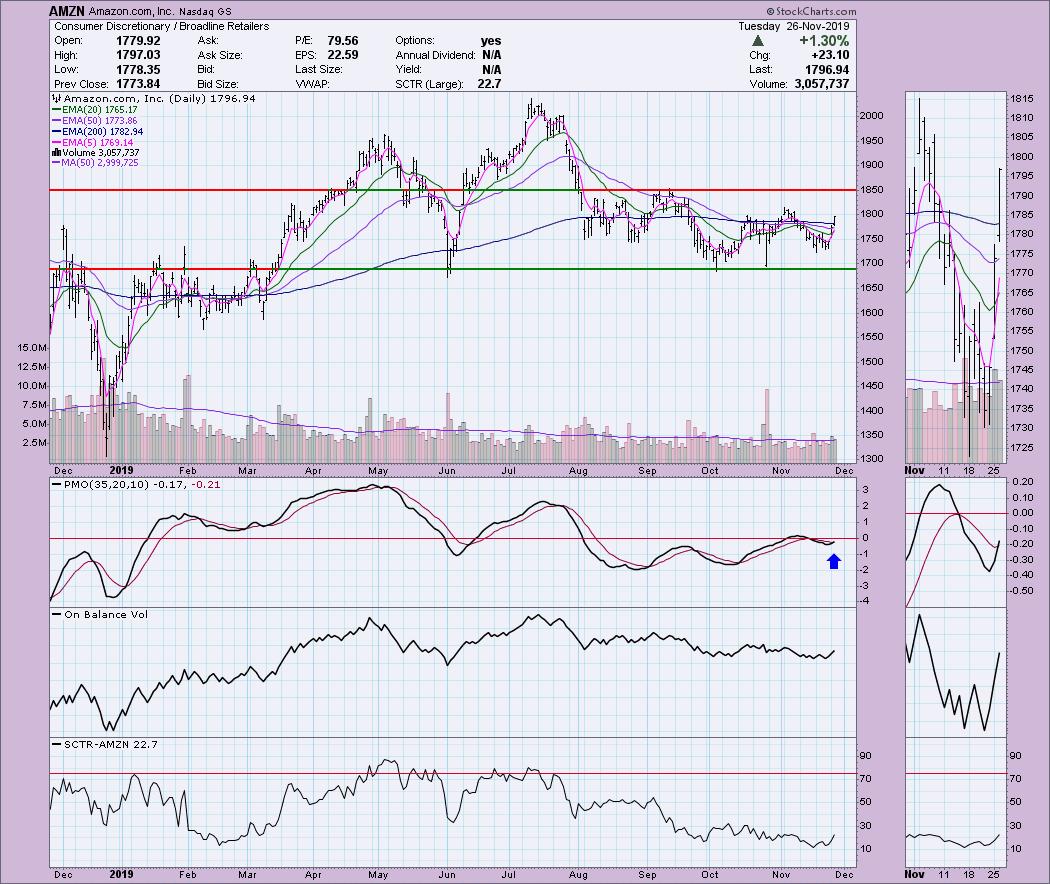
Amazon.com, Inc (AMZN) - Earnings: 1/29 - 2/3/2020
Speaking of trading ranges, Amazon has been in one between $1700 and $1850 for some time. I like today's breakout and subsequent trading above the 200-EMA. The momentum does seem to be building under the surface as the PMO bottoms rise during this trading range period. Again, trading ranges are of course best entered near the low, but the upper part of this range is above the 200-EMA. I believe price could find support here. My upside target would be the highs in May or June.
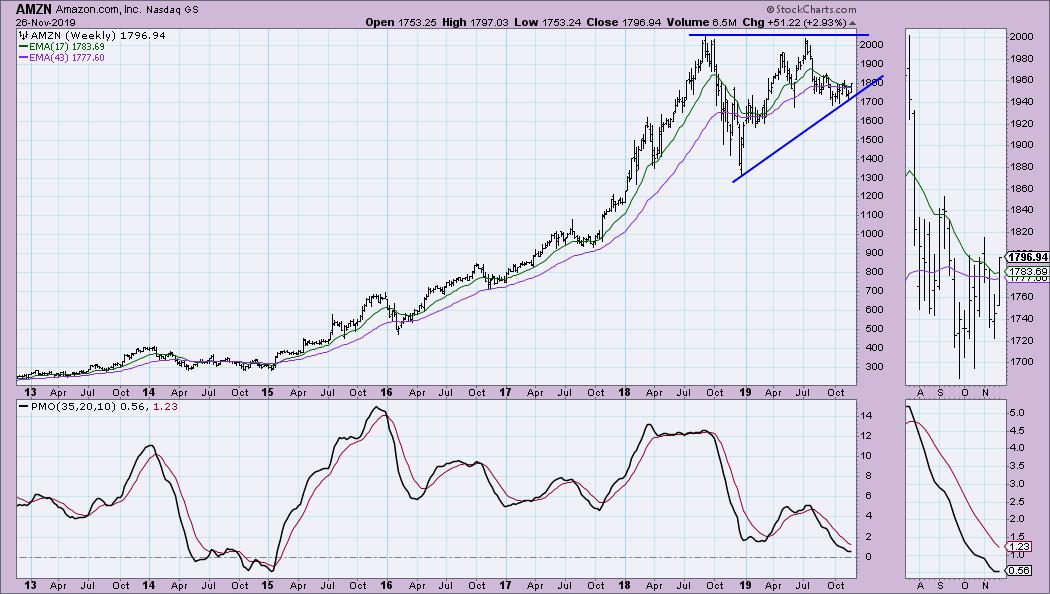
There's a possible ascending triangle here, which is bullish. The PMO is attempting to bottom just above the zero line. I would watch that intermediate-term rising trend line. At first blush, I would likely set a stop around $1600 or so.
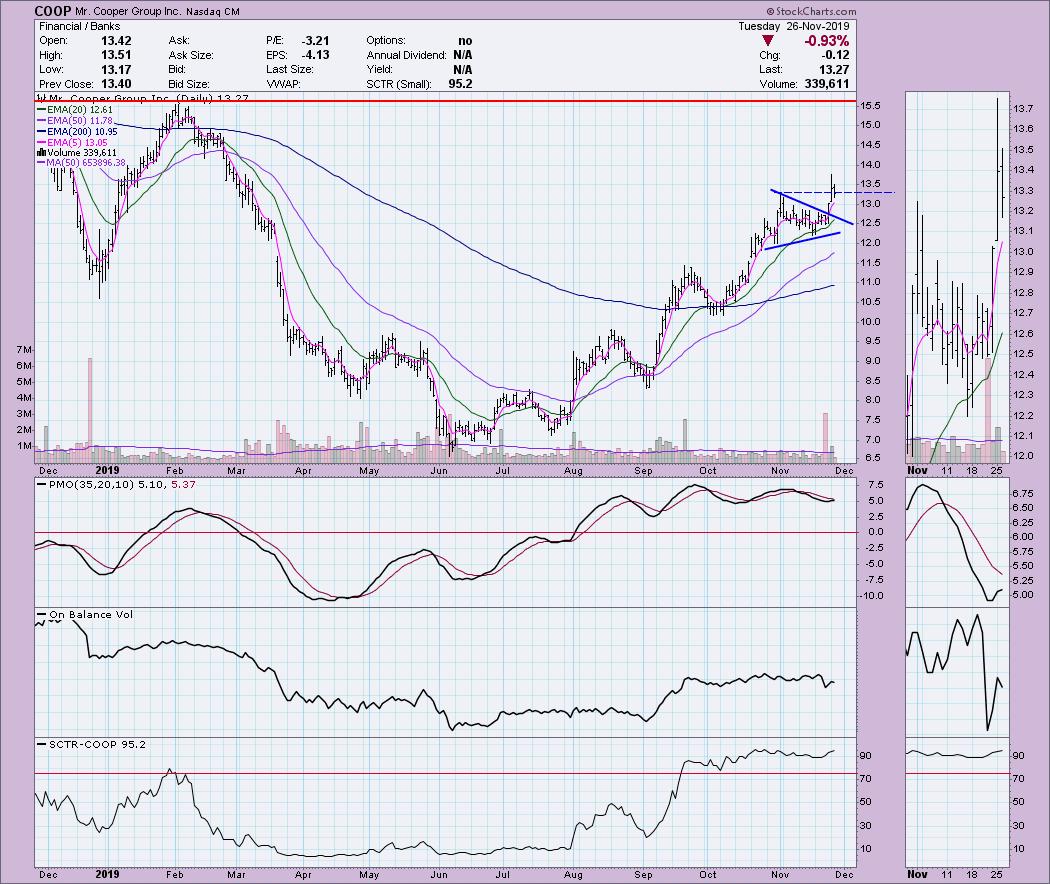
Mr. Cooper Group, Inc (COOP) - Earnings: 10/31/2019
COOP had a nice upside breakout from a pennant formation. Price broke out yesterday and pulled back today. My preference is to see the OBV outpace the reading from its previous top, but that wasn't the case on COOP. What I like most was that overhead resistance doesn't really come into play until it reaches the 2019 top. The SCTR has remained strong, which implies intermediate-term relative and internal strength.
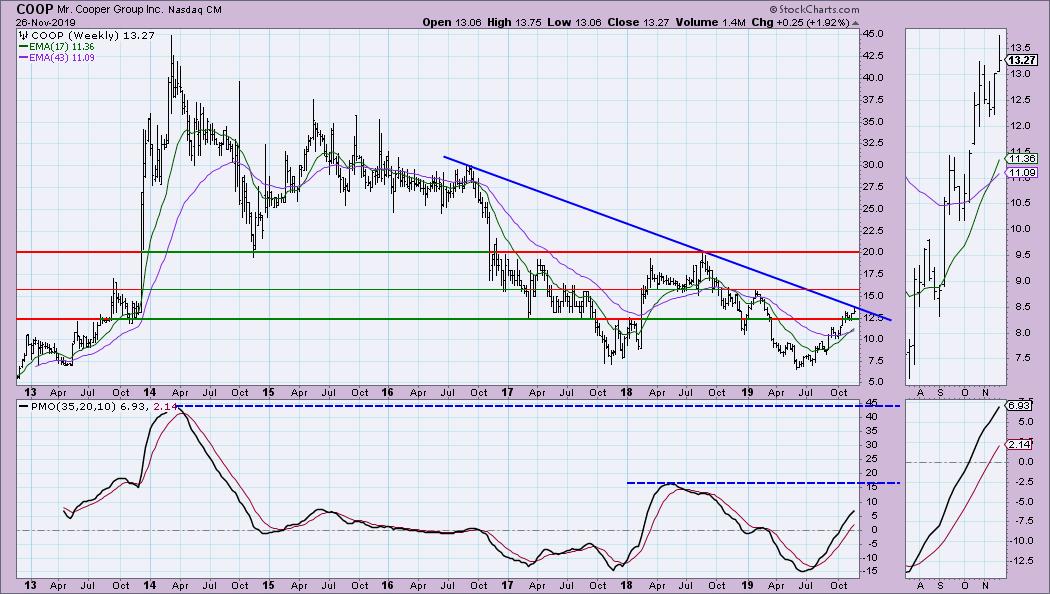
We haven't actually seen the breakout from the long-term declining trend, but we just saw a positive 17/43-week EMA crossover and the PMO is rising strongly with no hesitation. The 2019 top is intermediary resistance on the way to strong overhead resistance at $20. If we see price break this declining trend, I believe it will rally higher.
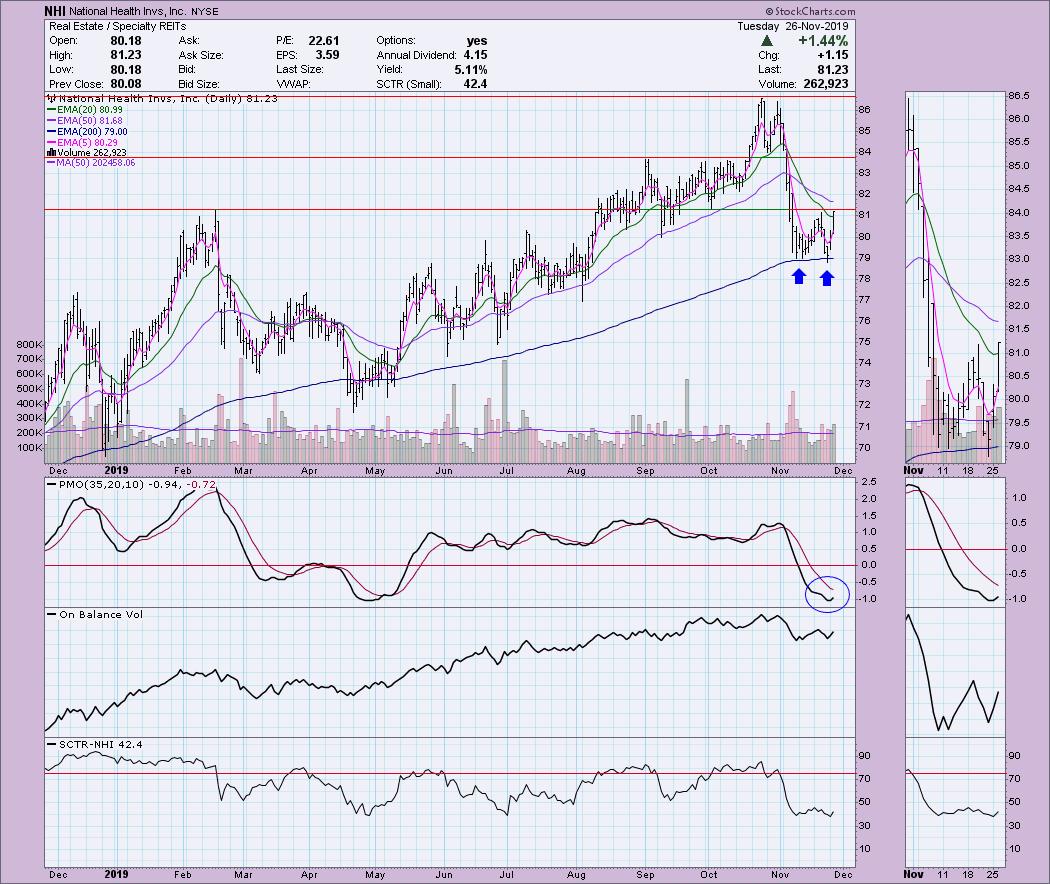
National Health Investors Inc (NHI) - Earnings: 2/17 - 2/21/2020
I liked the double-bottom pattern that is sitting right on the 200-EMA. Today, price closed above the 20-EMA, which hasn't happened since the decline began in early November. The pattern hasn't officially executed, but the expectation is a move that is the height of the pattern. Interestingly, that would put price right at overhead resistance around $84. That's a good target.
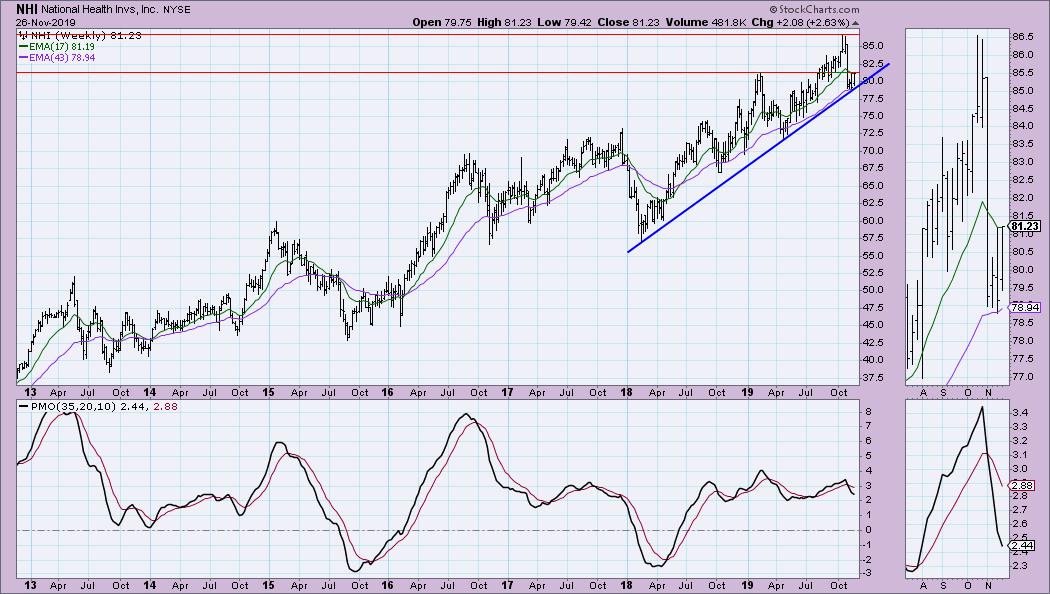
This is a "momentum sleeper," so the weekly chart doesn't look that great, but the PMO is in near-term oversold territory and appears to be decelerating. Price bounced right on the rising bottoms trend line. If it can stay above the early 2019 high, I'd look for a move toward the 2019 high.
Full Disclosure: I do not own any of the stocks above and I'm not planning on adding any at this time. I'm currently about 80% in cash.
Do NOT Miss This Event!
I will be presenting at the "Market Vision 2020" online conference on January 4th! It is sponsored by EarningsBeats.com and promises to be "THE" event to start the new year. We will have many of the commentators that you love presenting their "market view" for 2020, with John Murphy as the keynote speaker! For information on the event, sign up for the free emails that will give you all the details as we get closer!

Erin Swenlin will be presenting at the The MoneyShow Las Vegas May 11-13, 2020! You'll have an opportunity to meet Erin and discuss the latest DecisionPoint news and Diamond Scans. The conference is free to attend or view online!
Watch the latest episode of DecisionPoint with Carl & Erin Swenlin LIVE on Mondays 5:00p EST or on the StockCharts TV YouTube channel here!
Technical Analysis is a windsock, not a crystal ball.
Happy Charting!
- Erin
erinh@stockcharts.com
NOTE: The stocks reported herein are from mechanical trading model scans that are based upon moving average relationships, momentum and volume. DecisionPoint analysis is then applied to get five selections from the scans. The selections given should prompt readers to do a chart review using their own analysis process. This letter is not a call for a specific action to buy, sell or short any of the stocks provided. There are NO sure things or guaranteed returns on the daily selection of "diamonds in the rough."
Helpful DecisionPoint Links:
DecisionPoint Shared ChartList and DecisionPoint Chart Gallery
Price Momentum Oscillator (PMO)
Swenlin Trading Oscillators (STO-B and STO-V)
**Don't miss DecisionPoint Commentary! Add your email below to be notified of new updates"**


