Living in California, we pay a premium on just about everything, especially utilities in the summer. The monthly electric bill approaches $600, and water $300, but we do get relief with natural gas, which comes in at around $10. But don't say anything or our politicians will work out a way to screw that up too. For example, we recently experienced a 10-year drought, and we were told to reduce water usage. Our reward for doing that was to be handed huge increases in the water rate, because we weren't using enough water to fund the water department.
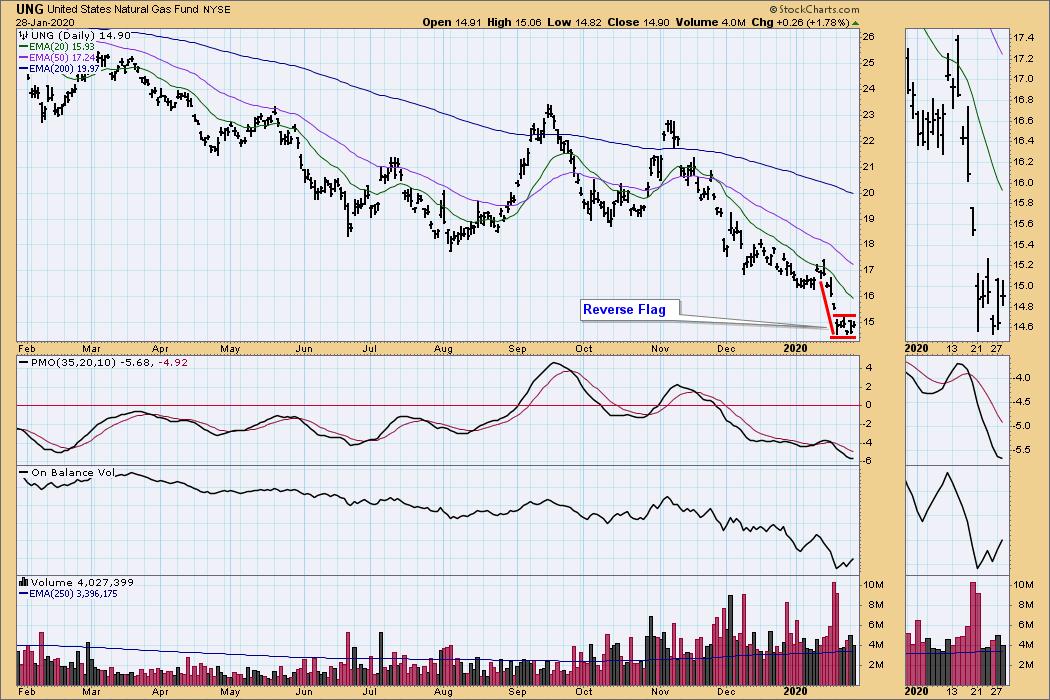
Anyway, because of my affinity for natural gas, I keep an eye on it in our ETF Tracker list with UNG. I can remember in the 1990s one expert predicted that we were going to run out of petroleum products, including natural gas, by the 2000s, but the reverse actually happened. As it turns out natural gas is now so plentiful that prices are scraping the bottom, recently making a new low. The bearish reverse flag formation tells us that more new lows are likely on the way.
(NOTE: The ETF Tracker is a list of about 100 ETFs intended to track a wide range of U.S. market indexes, sectors, global indexes, interest rates, currencies, and commodities. StockCharts.com subscribers can acquire it in the DecisionPoint Trend and Condition ChartPack.)

As investors we want to accomplish two basic things: (1) Determine the trend and condition of the market, and (2) select stocks that will ride that tide. The DecisionPoint Alert helps with the first step, and DecisionPoint Diamonds helps with the second. Go to DecisionPoint.com and SUBSCRIBE TODAY! (Charter Subscriber Discounts Available!)
I am rarely satisfied with a one-year daily chart, and will inevitably click up a weekly chart for more clarity. The declining bottoms line offered hope that maybe a bounce was coming, but that support broke down.

The weekly chart left me thirsting for more price history, so I went to a monthly chart. The data for UNG isn't deep enough, so I got the natural gas continuous contract data. We can see that we experienced increased scarcity in the mid-2000s, but prices have been working their way lower for 10 years. While it appears that price is approaching all-time lows, it could still take a decline of -50% or more before that level is reached.

While I love natural gas, I don't love UNG yet. A buying opportunity may be coming, but the PMOs in all time frames are falling, so continued patience will be necessary.
Happy Charting! - Carl
Technical Analysis is a windsock, not a crystal ball.
Helpful DecisionPoint Links:
DecisionPoint Alert Chart List
DecisionPoint Golden Cross/Silver Cross Index Chart List
DecisionPoint Sector Chart List
Price Momentum Oscillator (PMO)
Swenlin Trading Oscillators (STO-B and STO-V)


