EDITOR'S NOTE: This is an update to my 3/13/2002 DP Weekly Wrap comments.
When we look for downside potential for the S&P 500 Index, the simplest way is to look at obvious support levels based upon lines drawn across prior significant highs and lows. Over the last 20 years that includes:
(1) The 2018 bear market low at 2350, which after a -33% decline from all-time highs was penetrated today;
(2) The top of the 2015-16 consolidation at 2100, a -38% decline;
(3) The bottom of the 2015-16 consolidation at 1800, a -47% decline;
(4) The 2000 and 2007 tops at 1600; a -54% decline; and
(5) The 2009 bear market bottom at 650, a -80% decline. (The 1929-32 Bear Market was a -89% decline.)
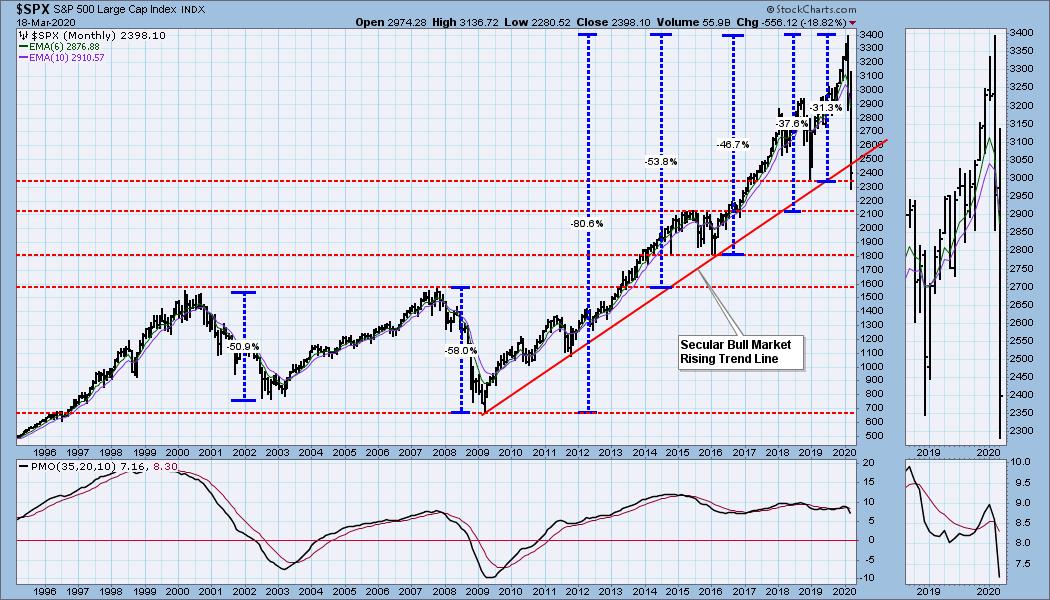
Certainly, everything up to a -54% decline is possible, even likely -- it has happened twice before in the last 20 years, and the market is already down over -30%. But is a mind-boggling decline to the 2009 low possible? It sounds crazy, but I'm not ruling it out.
Can these technical support levels be reconciled to fundamental valuations? The next chart shows the S&P 500 in relation to its normal valuation range*. We normally have hash marks on the right to show projected range levels based upon earnings estimates, but COVID-19 has demolished earnings estimates for the time being. When earnings for 2020 Q1 start coming in we should see greatly revised (downward) estimates for 2020 Q4, which will send the range bands down by a substantial amount. I don't know where the range band levels will be, but by using some of the proposed technical support levels this chart shows where they may end up. (See the horizontal red, blue, and green dashed lines.) If things continue to deteriorate, there will eventually be good and bad news: Stocks will be really cheap . . . if we have any money left to buy them.
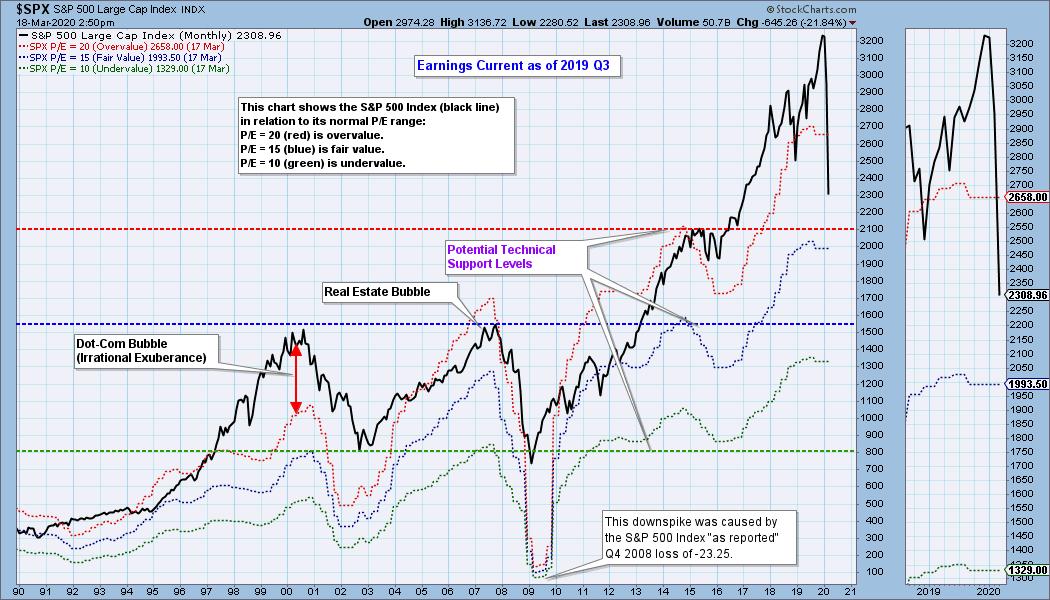
* This chart shows us the normal value range of the S&P 500 Index, indicating where the S&P 500 would have to be in order to have an overvalued P/E of 20 (red line), a fairly valued P/E of 15 (blue line) or an undervalued P/E of 10 (green line).

As investors we want to accomplish two basic things: (1) Determine the trend and condition of the market, and (2) select stocks that will ride that tide. The DecisionPoint Alert helps with the first step, and DecisionPoint Diamonds helps with the second. Go to DecisionPoint.com and SUBSCRIBE TODAY! (Charter Subscriber Discounts Available!
Technical Analysis is a windsock, not a crystal ball.
Helpful DecisionPoint Links:
DecisionPoint Alert Chart List
DecisionPoint Golden Cross/Silver Cross Index Chart List
DecisionPoint Sector Chart List
Price Momentum Oscillator (PMO)
Swenlin Trading Oscillators (STO-B and STO-V)


