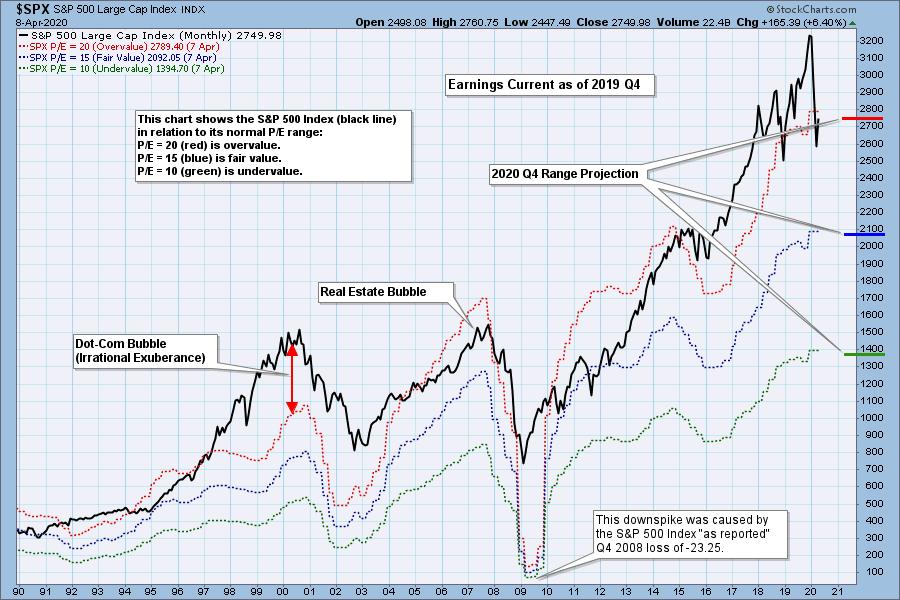
The S&P 500 final earnings for 2019 Q4 are out, and based upon GAAP (Generally Accepted Accounting Principals) earnings, the S&P 500 is finally back into the normal value range, but is still overvalued. The following chart shows us the normal value range of the S&P 500 Index, indicating where the S&P 500 would have to be in order to have an overvalued P/E of 20 (red line), a fairly valued P/E of 15 (blue line) or an undervalued P/E of 10 (green line). There are three hash marks on the right side of the chart, which show where the range markers are projected be at the end of 2020 Q4 based upon estimated future earnings (2020 Q4).
This chart is mostly based upon estimates reported before the COVID-19 crisis hit, and major downward adjustments in earnings are expected as reporting progresses through April and May.
As investors we want to accomplish two basic things: (1) Determine the trend and condition of the market, and (2) select stocks that will ride that tide. The DecisionPoint Alert helps with the first step, and DecisionPoint Diamonds helps with the second. Go to DecisionPoint.com and SUBSCRIBE TODAY!
Historically, price has usually remained below the top of the normal value range (red line); however, since about 1998, it has not been uncommon for price to exceed normal overvalue levels. The market hasn't been undervalued since 1984.

I use GAAP earnings as the basis for this article. The table below shows earnings projections through the end of this year, but major revisions are expected for the last three quarters of 2020.

The following table shows where the colored bands will be based upon earnings estimates, but, again, I expect they will be significantly lower once the majority of Q1 2020 reporting is in.

CONCLUSION: Market valuation is not a precise timing tool, but keeping track of it tells us if the fundamentals are favorable or not. Currently, the market is overvalued, but we know that earnings are crashing, and the value range will be adjusted significantly downward. It is inconceivable to me that prices won't adjust downward accordingly.
Technical Analysis is a windsock, not a crystal ball.
Helpful DecisionPoint Links:
DecisionPoint Alert Chart List
DecisionPoint Golden Cross/Silver Cross Index Chart List
DecisionPoint Sector Chart List
Price Momentum Oscillator (PMO)
Swenlin Trading Oscillators (STO-B and STO-V)


