I was indoctrinated into using exponential moving averages (EMAs) out of necessity, back when I was generating data for the old DecisionPoint.com website. I was generating and maintaining data on Excel spreadsheets, and, if I wanted a 200-day simple moving average (SMA), I would need to keep 200 days of data. A corresponding EMA needed only two lines of data -- yesterday's and today's. Obviously, the EMA was the more practical choice, and I still prefer them over the SMA.
I don't want to get into a lesson on precisely how they are both calculated. Suffice it to say that EMAs are weighted toward recent price activity, whereas, with SMAs, the oldest data is equally weighted with the newest data. While my preference for EMAs was initially influenced by practicality, I recently saw an example of why EMAs can be more rational. A reader pointed out that the Nasdaq 100 50SMA had recently crossed down through the 200SMA (see below), which, considering the depth of the February-March decline, was surprising to me. It was also odd that, while price is well above the 50SMA, the 50SMA is still moving down. Also, the 200SMA never stopped rising, even when price went well below it.
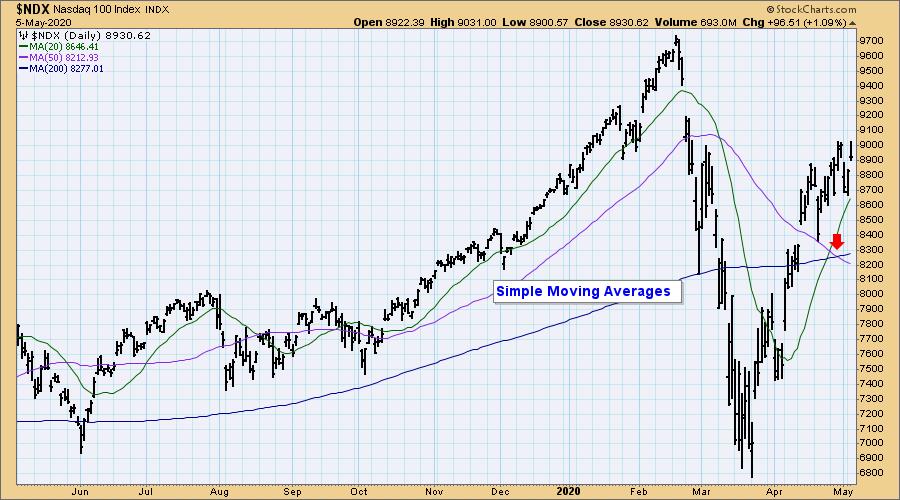
Here's the same chart, but with EMAs. Note that EMAs always move toward price -- when price crosses the EMA, the EMA changes direction so as to keep moving toward price. To me, this is more rational behavior.


As investors we want to accomplish two basic things: (1) Determine the trend and condition of the market, and (2) select stocks that will ride that tide. The DecisionPoint Alert helps with the first step, and DecisionPoint Diamonds helps with the second. Go to DecisionPoint.com and SUBSCRIBE TODAY!
The purpose of moving averages is to smooth the data, to "summarize" its direction. Clearly SMAs accomplish this, but sometimes their behavior can be a bit mysterious, because past data dropping off the calculation string counts as much as what happened today.
Happy Charting! - Carl
Technical Analysis is a windsock, not a crystal ball.
Helpful DecisionPoint Links:
DecisionPoint Alert Chart List
DecisionPoint Golden Cross/Silver Cross Index Chart List
DecisionPoint Sector Chart List
Price Momentum Oscillator (PMO)
Swenlin Trading Oscillators (STO-B and STO-V)


