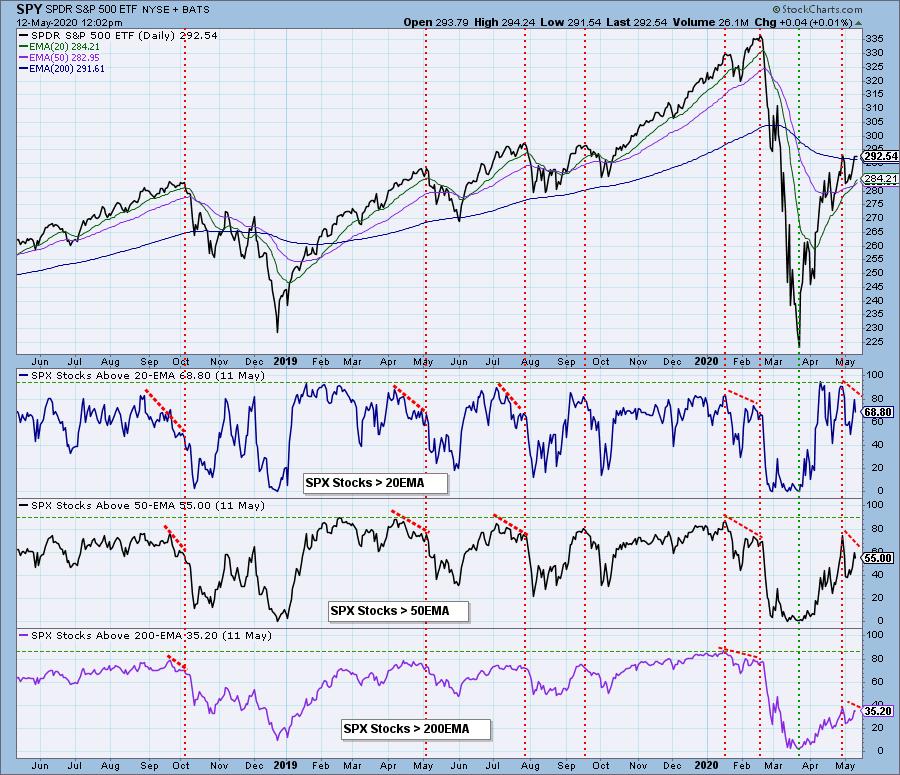
FOR THE BEARS . . .
This chart tracks the price of the individual S&P 500 component stocks relative to their 20EMA, 50EMA, and 200EMA. As price approaches the level of a prior top, I look for the indicators to make a lower top, which is a negative divergence. Such divergences tell us that fewer stocks are participating in the current price advance than the one before, and the message is that there is probably a price top and decline coming. We can see how reliable these warnings have proven to be in the past, although the amount of the declines varies greatly.

As investors we want to accomplish two basic things: (1) Determine the trend and condition of the market, and (2) select stocks that will ride that tide. The DecisionPoint Alert helps with the first step, and DecisionPoint Diamonds helps with the second. Go to DecisionPoint.com and SUBSCRIBE TODAY!
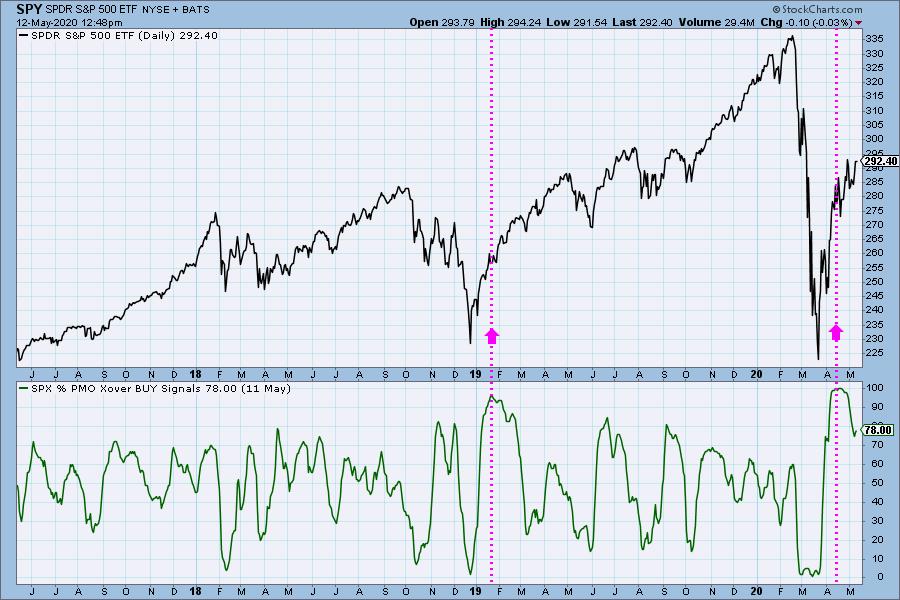
FOR THE BULLS . . .
If you're looking for a reason to be bullish, here's a chart that that I featured in last Friday's DecisionPoint ALERT. It shows the percentage of S&P 500 stocks that have PMO crossover buy signals, and recently it went from zero to 100% in a short period of time. When an indicator goes from very oversold to very overbought in one swift, smooth, uninterrupted move, it is a very bullish sign. We can see a similar move from the 2018 price low, and, even though the indicator subsequently drops rather precipitously from its high, we can see that the initial thrust launched an impressive rally. Will that follow through be duplicated this time? It could happen, but, as usual, there is no guarantee; nevertheless, this looks like a good start.
CONCLUSION: So we have a bearish sign and a bullish sign. Which should we believe? Actually, both could be right. While the bearish sign has the potential to be completely dominant, we could see a technical correction, even a substantial one, followed by a resumption of the rally. I personally tend to look for a more bearish result, but that bullish thrust on the second chart is quite compelling, and can't be ignored. Of course, other outcomes are possible, but I think these charts prepare us for many of the possible variations.
** NOTE: I posted these charts intraday, and the indicators do not update until after the close.
Technical Analysis is a windsock, not a crystal ball.
Helpful DecisionPoint Links:
DecisionPoint Alert Chart List
DecisionPoint Golden Cross/Silver Cross Index Chart List
DecisionPoint Sector Chart List
Price Momentum Oscillator (PMO)
Swenlin Trading Oscillators (STO-B and STO-V)


