Years ago it occurred to me that we should consider market "bias" when interpreting the condition (overbought/oversold) of market indicators. Here is how bias works:
BIAS = BULLISH: Overbought conditions may not impede upward price progress. Conditions become oversold well above the bottom of the normal range. Bullish resolutions are more likely.
BIAS = BEARISH: Oversold conditions may not result in rally-inducing compression, just more weakness. Conditions become overbought well below the top of the normal range. Bearish resolutions are more likely.
BIAS = NEUTRAL: Overbought conditions result in a price pullback until conditions are oversold. At that point, price rallies until conditions are once again overbought. Repeat cycle.
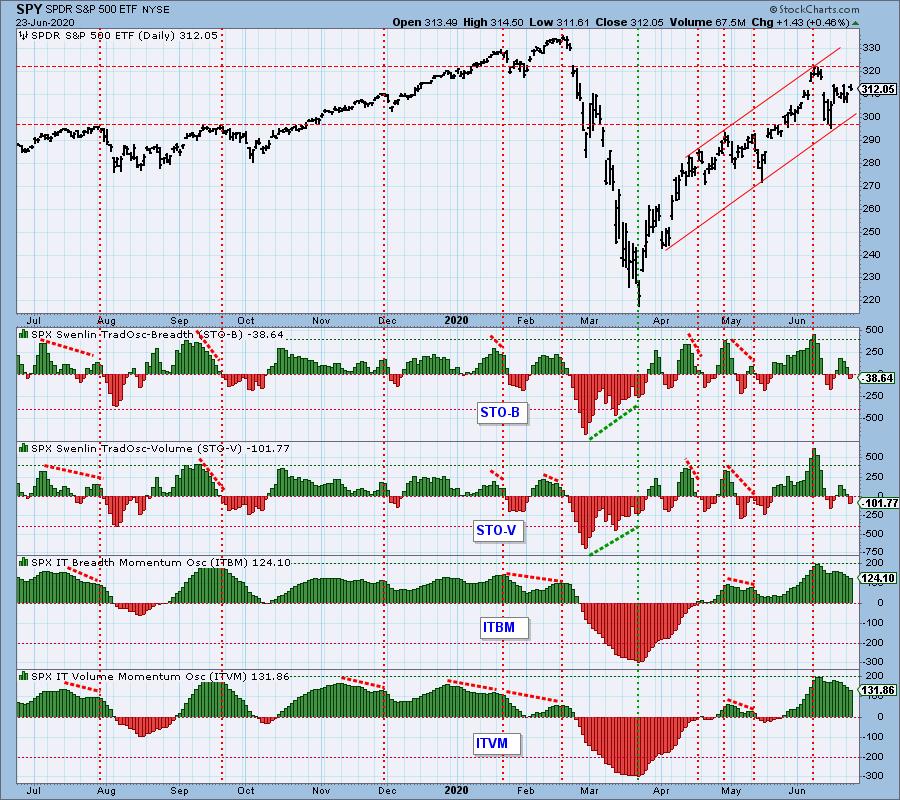
I discussed market bias with Erin on our June 18 StockCharts TV show, and it got me thinking about how best to assess it. If there is a way to quantify it, I haven't thought of it yet. But recently it occurred to me that, perhaps, an intuitive assessment might be possible by changing our primary short-term (STOs) and intermediate-term (ITBM/ITVM) indicators from line charts to histograms. Here they are together on the same chart, and it is easy to see the presence of market bias, and how it persists in one direction or the other.
Obviously, bias differs in each time frame, with bias fluctuation being much more active in the short-term. And there is no mistaking where the latest period of bearish bias begins and ends (mid-February to mid-March). More striking is the relatively stable period of bullish bias from mid-August 2019 to the February 2020 top, compared to the period since the March bottom, which is much more choppy. Despite the chop, the recent range of the STOs (-200 to +400) shows bullish bias because it is skewed toward the top of the normal range (-400 to +400).

As investors we want to accomplish two basic things: (1) Determine the trend and condition of the market, and (2) select stocks that will ride that tide. The DecisionPoint Alert helps with the first step, and DecisionPoint Diamonds helps with the second. Go to DecisionPoint.com and SUBSCRIBE TODAY!
The intermediate-term view (ITBM/ITVM) is, of course, more stable, and it is easy to see the when bias is bullish or bearish, because these indicators tend to stay above or below the zero line -- their normal range being +200 to -200.
The important thing to remember about bias is that it is what it is at the time that it is. It can change quickly, and there is no guarantee tomorrow's bias will be the same as today's. But, absent other evidence, it wouldn't be wrong to assume that tomorrow's bias will probably be about like today's. A good example of "other evidence" would be the negative divergences showing on the ITBM and ITVM prior to the February top.
CONCLUSION: Interpretation of technical indicators and conclusions drawn therefrom should be weighted based upon our assessment of the direction of market bias. We think this new chart format will help in that process.
Note: I plan to discuss this on our next show, which will be posted on the DecisionPoint YouTube channel Thursday morning at 8 am ET.
Happy Charting! - Carl
Technical Analysis is a windsock, not a crystal ball.
Helpful DecisionPoint Links:
DecisionPoint Alert Chart List
DecisionPoint Golden Cross/Silver Cross Index Chart List
DecisionPoint Sector Chart List
Price Momentum Oscillator (PMO)
Swenlin Trading Oscillators (STO-B and STO-V)


