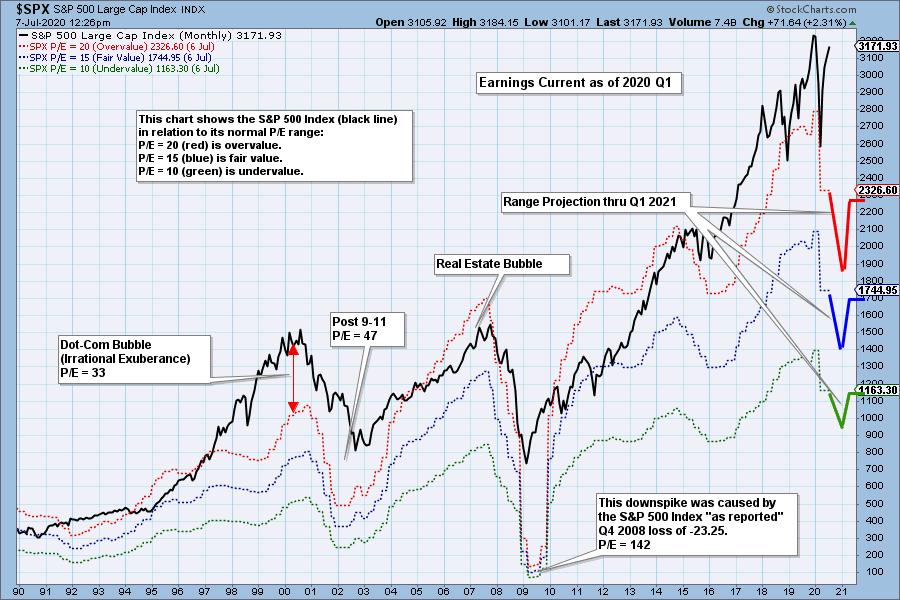
The S&P 500 preliminary earnings results for 2020 Q1 are out, and based upon GAAP (Generally Accepted Accounting Principals) earnings, the S&P 500 is far above its normal value range. The following chart shows us the normal value range of the S&P 500 Index, indicating where the S&P 500 would have to be in order to have an overvalued P/E of 20 (red line), a fairly valued P/E of 15 (blue line), or an undervalued P/E of 10 (green line). Annotations on the right side of the chart show where the range is projected be based upon earnings estimates for the next four quarters, through 2021 Q1. Perhaps, referring to the estimates with the implied appellation of "lies" is overstating a bit, but I think calling them WAGs (Wild Audacious Guesses) certainly fits the situation. In normal circumstances, projecting earnings is always difficult, but the COVID-19 disruption has made the task nearly impossible.
As investors we want to accomplish two basic things: (1) Determine the trend and condition of the market, and (2) select stocks that will ride that tide. The DecisionPoint Alert helps with the first step, and DecisionPoint Diamonds helps with the second. Go to DecisionPoint.com and SUBSCRIBE TODAY!
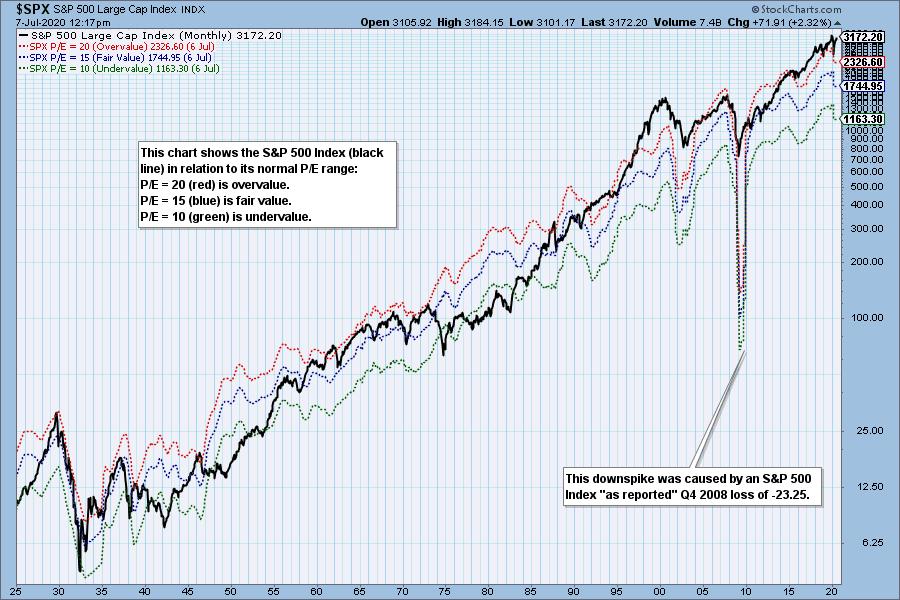
Historically, price has usually remained below the top of the normal value range (red line); however, since about 1998, it has not been uncommon for price to exceed normal overvalue levels, sometimes by a lot. And the market hasn't been undervalued since 1984.
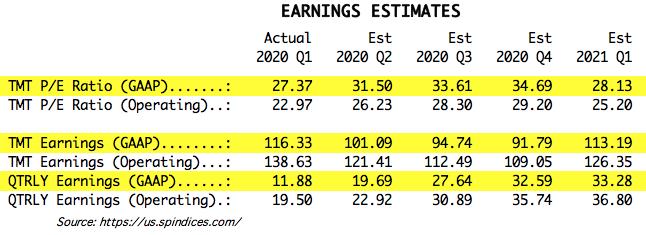
I use GAAP earnings as the basis for this article. The table below shows earnings projections through March 2021.
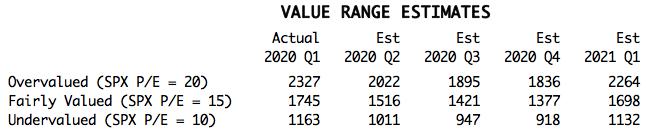
The following table shows where the colored bands will be based upon earnings estimates.
CONCLUSION: It is said that the market hates uncertainty, and I can think of no more uncertain time in regard to future earnings. The amount of damage that has been done to the economy is inestimable, and it is anybody's guess how fast it will recover. Standby for major revisions to earnings estimates.
Technical Analysis is a windsock, not a crystal ball.
Helpful DecisionPoint Links:
DecisionPoint Alert Chart List
DecisionPoint Golden Cross/Silver Cross Index Chart List
DecisionPoint Sector Chart List
Price Momentum Oscillator (PMO)
Swenlin Trading Oscillators (STO-B and STO-V)
1


