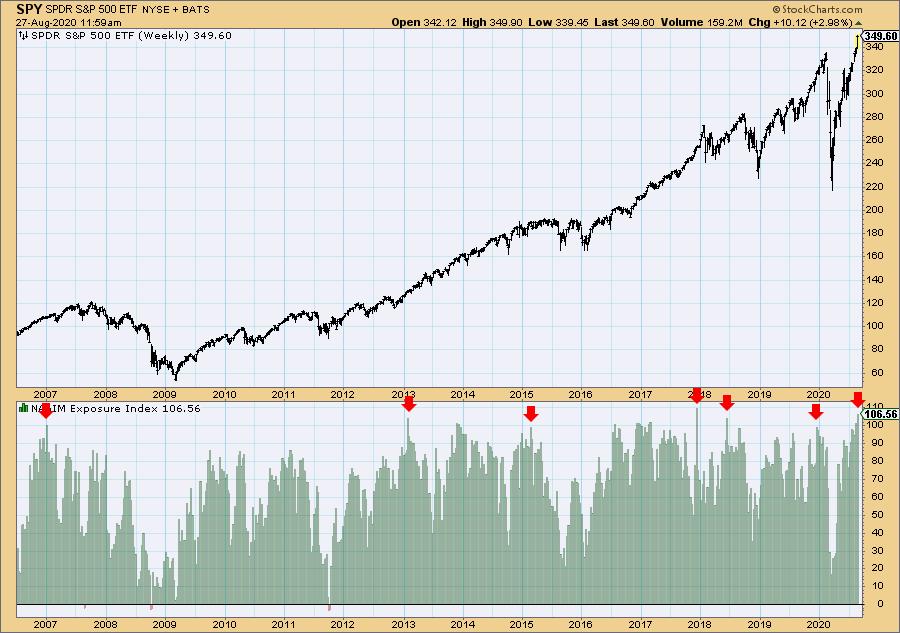
The NAAIM Exposure Index hit 106.56 this week, which is the second highest reading in the history of this indocator (the highest being in December 2017, a few weeks before the January 2018 market top).
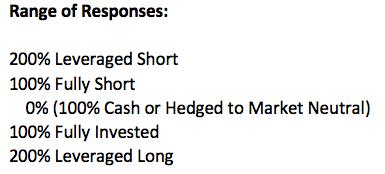
NAAIM (National Association of Active Investment Managers)member firms who are active money managers are asked each week to provide a number which represents their overall equity exposure at the market close on a specific day of the week, currently Wednesdays. Responses can vary widely as indicated below. Responses are tallied and averaged to provide the average long (or short) position of all NAAIM managers, as a group.

Here is the link to register for this Monday's (8/31/2020) free DecisionPoint Trading Room!
Here is the link to the recording from Monday (8/24/2020) with panelist Carl Swenlin!
Don't forget Diamonds-subscribers! The DecisionPoint "Diamond Mine" will be open Friday, August 28th exclusively for you! Bring your questions and symbol requests as we dive into the Diamonds of the Week and search for what setups are out there for Monday! Registration links will be sent out on Wednesday and are always located within the Diamonds reports!
In spite of the wide range of possible responses (200% long to 200% short), the average response is usually somewhere between zero and +100. On rare occasions the average has been below zero (slightly short), or slightly above +100. As investors, we should be somewhat wary when readings reach the extremes of that range, because too many people are getting on one side of the boat. Currently, investors are too bullish, and that could be telling us that we're very near a price top.
As investors we want to accomplish two basic things: (1) Determine the trend and condition of the market, and (2) select stocks that will ride that tide. The DecisionPoint Alert helps with the first step, and DecisionPoint Diamonds helps with the second. Go to DecisionPoint.com and SUBSCRIBE TODAY!
I don't rely on sentiment indicators very much these days, because I have trouble sorting through the ambiguity of the readings -- notice on the chart how often the high readings do not coincide with important price tops. Nevertheless, considering that the current high sentiment reading comes after a vertical, five-month market rally, it could be that the bullish side of the boat is getting a little too crowded.
Happy Charting! - Carl
Technical Analysis is a windsock, not a crystal ball.
Disclaimer: This blog is for educational purposes only and should not be construed as financial advice. The ideas and strategies should never be used without first assessing your own personal and financial situation, or without consulting a financial professional. Any opinions expressed herein are solely those of the author, and do not in any way represent the views or opinions of any other person or entity.
Helpful DecisionPoint Links:
DecisionPoint Alert Chart List
DecisionPoint Golden Cross/Silver Cross Index Chart List
DecisionPoint Sector Chart List
Price Momentum Oscillator (PMO)
Swenlin Trading Oscillators (STO-B and STO-V)


