This is an excerpt from today's DecisionPoint Alert on DecisionPoint.com:
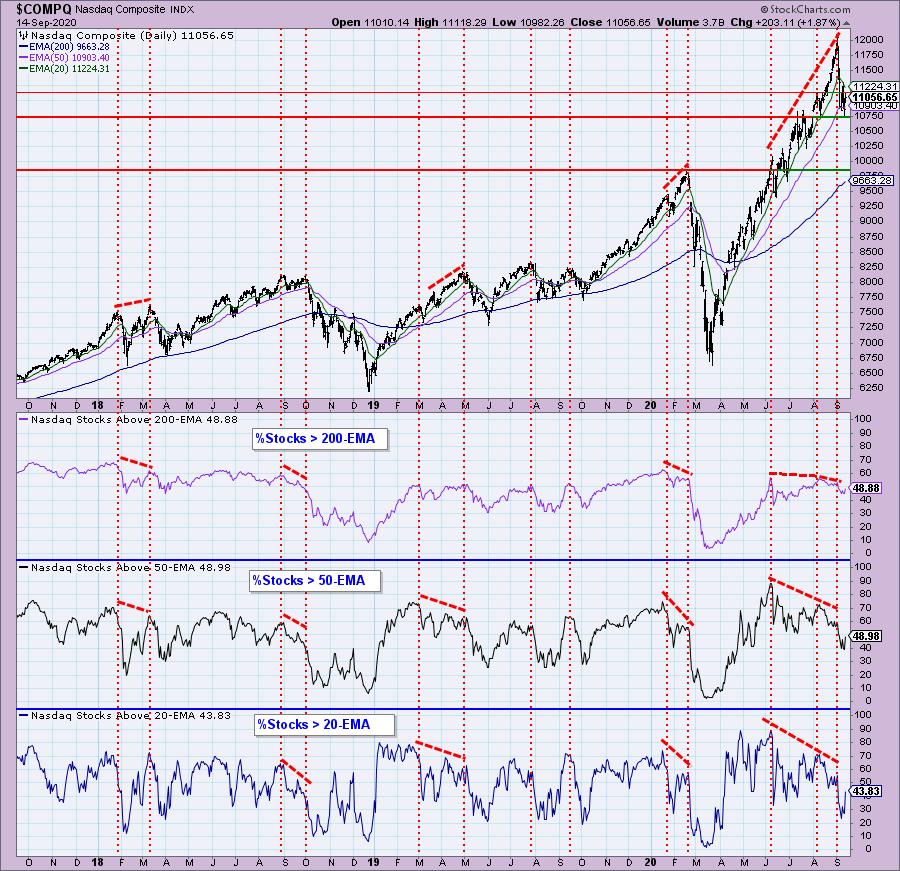
It may only be a one-day bounce, but the questions are already appearing..."Is the correction over in Technology? Is this a BUY point?" Below I have the chart of the Nasdaq, followed by the Technology Sector SPDR (XLK). The first chart is a longer-term daily chart that shows us the strength and weakness in participation by looking at the percent of stocks with price above their 20/50/200-EMAs. We are seeing some improvement on %Stocks above their 20/50/200-EMAs. I have annotated numerous negative divergences that have occurred over time and this recent one also was prescient. I do think it is positive that price found support at the August low, but it didn't hold the 50-EMA.
 As investors we want to accomplish two basic things: (1) Determine the trend and condition of the market, and (2) select stocks that will ride that tide. The DecisionPoint Alert helps with the first step, and DecisionPoint Diamonds helps with the second. Go to DecisionPoint.com and SUBSCRIBE TODAY!

Click here to register in advance for the recurring free DecisionPoint Trading Room (Next one is 9/21)!
Did you miss today's (9/14) trading room? Here is a link to the recording (password: 3^aXxCJ2).
What does the Technology sector look like? Unfortunately, my thought was a bearish reverse flag the minute I opened it. However, it is holding onto its rising trend and is staying above the 50-EMA. The RSI is nearly positive and the PMO is less overbought.

Conclusion: At this point, I suspect that Technology, like the market as a whole, will see a pause or sideways consolidation. The indicators aren't negative enough to expect another big leg down, but they aren't positive enough to suggest a sustained rally ahead. I think you could get back into the technology sector or hold onto your technology sector stocks. However, there are other areas of the market that I find more interesting these days which Diamonds readers can confirm.
Happy Charting! - Erin
Technical Analysis is a windsock, not a crystal ball.
Helpful DecisionPoint Links:
DecisionPoint Alert Chart List
DecisionPoint Golden Cross/Silver Cross Index Chart List
DecisionPoint Sector Chart List
Price Momentum Oscillator (PMO)
Swenlin Trading Oscillators (STO-B and STO-V)


